Powerpoint Templates and Google slides for Average Lead Time
Save Your Time and attract your audience with our fully editable PPT Templates and Slides.
-
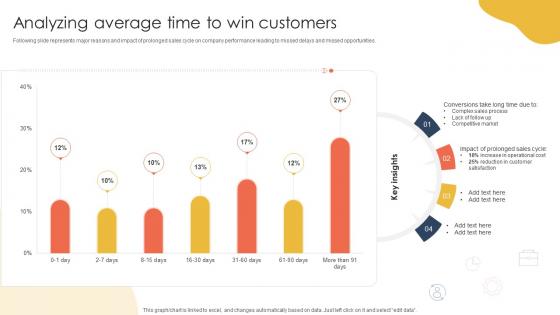
 Analyzing Average Time How To Keep Leads Flowing Sales Funnel Management SA SS
Following slide represents major reasons and impact of prolonged sales cycle on company performance leading to missed delays and missed opportunities. Deliver an outstanding presentation on the topic using this Analyzing Average Time How To Keep Leads Flowing Sales Funnel Management SA SS. Dispense information and present a thorough explanation of Competitive Market, Customer Satisfaction, Prolonged Sales using the slides given. This template can be altered and personalized to fit your needs. It is also available for immediate download. So grab it now.
-
 Average Time Required To Nurture Potential Leads Overview And Importance Of Sales Automation
This slide represents the average time required by customer to make purchase decision that help company to understand their preferences and nurture potential leads accordingly Present the topic in a bit more detail with this Average Time Required To Nurture Potential Leads Overview And Importance Of Sales Automation. Use it as a tool for discussion and navigation on Communication, Process, Potential. This template is free to edit as deemed fit for your organization. Therefore download it now.
-
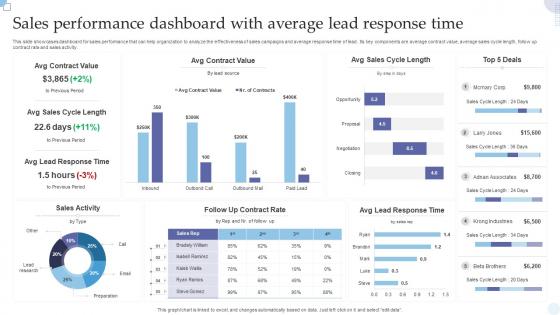
 Sales Performance Dashboard With Average Lead Response Time
This slide showcases dashboard for sales performance that can help organization to analyze the effectiveness of sales campaigns and average response time of lead. Its key components are average contract value, average sales cycle length, follow up contract rate and sales activity. Presenting our well structured Sales Performance Dashboard With Average Lead Response Time. The topics discussed in this slide are Sales Activity, Avg Lead Response Time. This is an instantly available PowerPoint presentation that can be edited conveniently. Download it right away and captivate your audience.
-
 Audit kpi dashboard showing lead time average entry variance and amount contribution
Presenting this set of slides with name - Audit Kpi Dashboard Showing Lead Time Average Entry Variance And Amount Contribution. This is a four stage process. The stages in this process are Audit, Examine, Survey.


