Powerpoint Templates and Google slides for Average Employee
Save Your Time and attract your audience with our fully editable PPT Templates and Slides.
-
 Average Small Business Employee Size powerpoint presentation and google slides ICP
This PowerPoint presentation provides an overview of the average small business employee size. It examines the current trends in small business employee size, the benefits of having a smaller team, and the challenges associated with having a larger team. It also provides tips on how to effectively manage a small business team and how to determine the right size for your business. The presentation is ideal for small business owners and entrepreneurs who are looking to understand the average small business employee size and how it can impact their business.
-
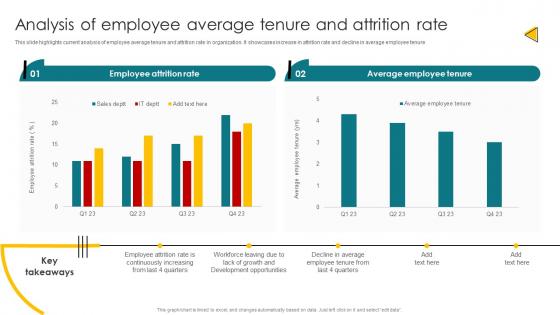 Analysis Of Employee Average Tenure And Attrition Rate Talent Management And Succession
This slide highlights current analysis of employee average tenure and attrition rate in organization. It showcases increase in attrition rate and decline in average employee tenure. Present the topic in a bit more detail with this Analysis Of Employee Average Tenure And Attrition Rate Talent Management And Succession. Use it as a tool for discussion and navigation on Employee Attrition Rate, Average Employee Tenure, Analysis. This template is free to edit as deemed fit for your organization. Therefore download it now.
-
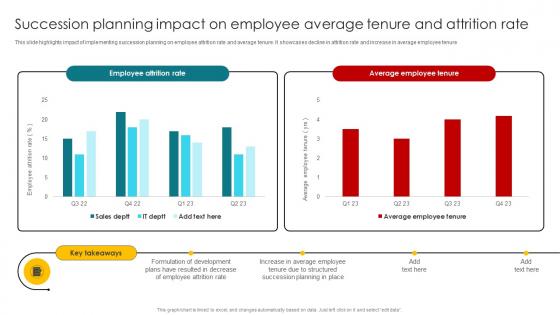 Succession Planning Impact On Employee Average Tenure Talent Management And Succession
This slide highlights impact of implementing succession planning on employee attrition rate and average tenure. It showcases decline in attrition rate and increase in average employee tenure. Present the topic in a bit more detail with this Succession Planning Impact On Employee Average Tenure Talent Management And Succession. Use it as a tool for discussion and navigation on Employee Attrition Rate, Average Employee Tenure, Succession Planning. This template is free to edit as deemed fit for your organization. Therefore download it now.
-
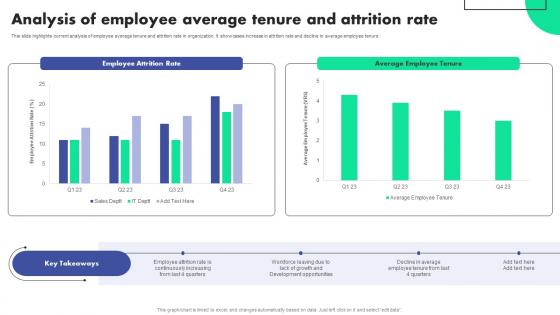 Analysis Of Employee Average Tenure Succession Planning To Identify Talent And Critical Job Roles
This slide highlights current analysis of employee average tenure and attrition rate in organization. It showcases increase in attrition rate and decline in average employee tenure. Deliver an outstanding presentation on the topic using this Analysis Of Employee Average Tenure Succession Planning To Identify Talent And Critical Job Roles. Dispense information and present a thorough explanation of Development, Opportunities, Growth using the slides given. This template can be altered and personalized to fit your needs. It is also available for immediate download. So grab it now.
-
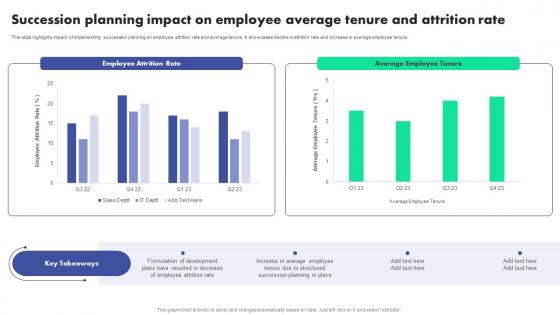 Succession Employee Average Tenure And Attrition Succession Planning To Identify Talent And Critical Job Roles
This slide highlights impact of implementing succession planning on employee attrition rate and average tenure. It showcases decline in attrition rate and increase in average employee tenure. Deliver an outstanding presentation on the topic using this Succession Employee Average Tenure And Attrition Succession Planning To Identify Talent And Critical Job Roles. Dispense information and present a thorough explanation of Succession, Planning, Development using the slides given. This template can be altered and personalized to fit your needs. It is also available for immediate download. So grab it now.
-
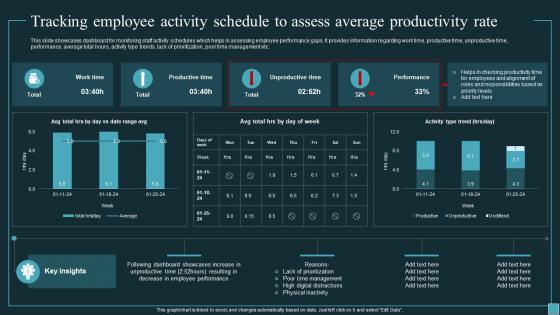 Implementing Workforce Analytics Tracking Employee Activity Schedule To Assess Average Data Analytics SS
This slide showcases dashboard for monitoring staff activity schedules which helps in assessing employee performance gaps. It provides information regarding work time, productive time, unproductive time, performance, average total hours, activity type trends, lack of prioritization, poor time management etc. Present the topic in a bit more detail with this Implementing Workforce Analytics Tracking Employee Activity Schedule To Assess Average Data Analytics SS. Use it as a tool for discussion and navigation on Tracking Employee Activity Schedule, Assess Average Productivity Rate, Lack Of Prioritization, Poor Time Management. This template is free to edit as deemed fit for your organization. Therefore download it now.
-
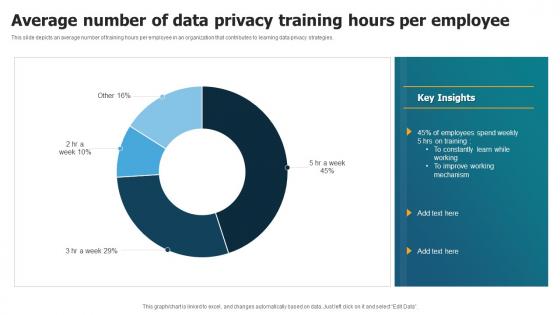 Average Number Of Data Privacy Training Hours Per Employee
This slide depicts an average number of training hours per employee in an organization that contributes to learning data privacy strategies. Introducing our Average Number Of Data Privacy Training Hours Per Employee set of slides. The topics discussed in these slides are Average Number, Training Hours Per Employee. This is an immediately available PowerPoint presentation that can be conveniently customized. Download it and convince your audience.
-
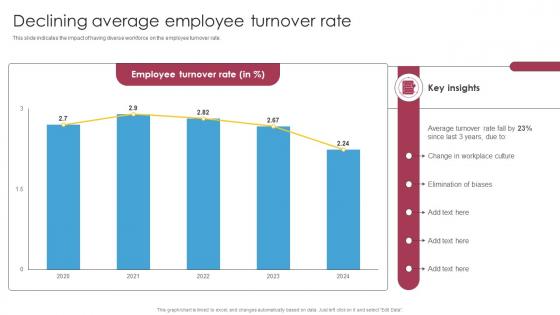 Declining Average Employee Turnover Rate Strategic Hiring Solutions For Optimizing DTE SS
This slide indicates the impact of having diverse workforce on the employee turnover rate. Present the topic in a bit more detail with this Declining Average Employee Turnover Rate Strategic Hiring Solutions For Optimizing DTE SS. Use it as a tool for discussion and navigation on Change In Workplace, Elimination Of Biases, Average Turnover Rate. This template is free to edit as deemed fit for your organization. Therefore download it now.
-
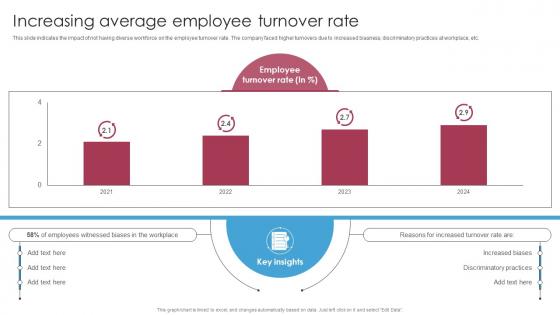 Increasing Average Employee Turnover Rate Strategic Hiring Solutions For Optimizing DTE SS
This slide indicates the impact of not having diverse workforce on the employee turnover rate. The company faced higher turnovers due to increased biasness, discriminatory practices at workplace, etc. Present the topic in a bit more detail with this Increasing Average Employee Turnover Rate Strategic Hiring Solutions For Optimizing DTE SS. Use it as a tool for discussion and navigation on Turnover Rate, Increased Biases, Discriminatory Practices. This template is free to edit as deemed fit for your organization. Therefore download it now.
-
 Insights Showing Average Number Of Digital Channels Employed
The purpose of this slide is to guide businesses regarding average number of channels to be employed to reach greater number of people. It aims to help businesses increase organic traffic and conversions by ensuring reach scalability through multiple digital channels. Presenting our well structured Insights Showing Average Number Of Digital Channels Employed. The topics discussed in this slide are Key Insights,showing average,digital channels employed. This is an instantly available PowerPoint presentation that can be edited conveniently. Download it right away and captivate your audience.
-
 Average Wage Employees In Powerpoint And Google Slides Cpb
Presenting Average Wage Employees In Powerpoint And Google Slides Cpb slide which is completely adaptable. The graphics in this PowerPoint slide showcase three stages that will help you succinctly convey the information. In addition, you can alternate the color, font size, font type, and shapes of this PPT layout according to your content. This PPT presentation can be accessed with Google Slides and is available in both standard screen and widescreen aspect ratios. It is also a useful set to elucidate topics like Average Wage Employees. This well structured design can be downloaded in different formats like PDF, JPG, and PNG. So, without any delay, click on the download button now.
-
 Succession Planning For Employee Analysis Of Employee Average Tenure And Attrition Rate
This slide highlights current analysis of employee average tenure and attrition rate in organization. It showcases increase in attrition rate and decline in average employee tenure. Present the topic in a bit more detail with this Succession Planning For Employee Analysis Of Employee Average Tenure And Attrition Rate Use it as a tool for discussion and navigation on Employee Attrition Rate, Average Employee Tenure This template is free to edit as deemed fit for your organization. Therefore download it now.
-
 Succession Planning For Employee Succession Planning Impact On Employee Average Tenure
This slide highlights impact of implementing succession planning on employee attrition rate and average tenure. It showcases decline in attrition rate and increase in average employee tenure. Deliver an outstanding presentation on the topic using this Succession Planning For Employee Succession Planning Impact On Employee Average Tenure Dispense information and present a thorough explanation of Employee Attrition Rate, Average Employee Tenure using the slides given. This template can be altered and personalized to fit your needs. It is also available for immediate download. So grab it now.
-
 Best Staff Retention Strategies Key Statistics Highlighting Average Employee Turnover Rate
The purpose of this slide is to showcase the survey result on a competitive salary structure. Information covered in this slide is related to salary range structure review frequency and single vs multiple salary structures along with key observations. Present the topic in a bit more detail with this Best Staff Retention Strategies Key Statistics Highlighting Average Employee Turnover Rate Use it as a tool for discussion and navigation on Employee Retention Rate, Employee Turnover Rate, New Candidates Hired This template is free to edit as deemed fit for your organization. Therefore download it now.
-
 Average Employees Per Company In Powerpoint And Google Slides Cpb
Presenting Average Employees Per Company In Powerpoint And Google Slides Cpb slide which is completely adaptable. The graphics in this PowerPoint slide showcase four stages that will help you succinctly convey the information. In addition, you can alternate the color, font size, font type, and shapes of this PPT layout according to your content. This PPT presentation can be accessed with Google Slides and is available in both standard screen and widescreen aspect ratios. It is also a useful set to elucidate topics like Average Employees Per Company. This well structured design can be downloaded in different formats like PDF, JPG, and PNG. So, without any delay, click on the download button now.
-
 Average Revenue Employee In Powerpoint And Google Slides Cpb
Presenting our Average Revenue Employee In Powerpoint And Google Slides Cpb PowerPoint template design. This PowerPoint slide showcases five stages. It is useful to share insightful information on Average Revenue Employee. This PPT slide can be easily accessed in standard screen and widescreen aspect ratios. It is also available in various formats like PDF, PNG, and JPG. Not only this, the PowerPoint slideshow is completely editable and you can effortlessly modify the font size, font type, and shapes according to your wish. Our PPT layout is compatible with Google Slides as well, so download and edit it as per your knowledge.
-
 Average Cost Of Filling The Position Recruitment Training Plan For Employee And Managers
This slide provides the graph of average hiring cost that shows decline in hiring costs after implementing the recruitment training program Present the topic in a bit more detail with this Average Cost Of Filling The Position Recruitment Training Plan For Employee And Managers Use it as a tool for discussion and navigation on Recruitment Training, Reducing The Average, Before Implementing This template is free to edit as deemed fit for your organization. Therefore download it now.
-
 Average Hiring Time To Fill The Position Recruitment Training Plan For Employee And Managers
This slide provides the graph of average hiring time that shows decline in hiring timings after implementing the recruitment training program Deliver an outstanding presentation on the topic using this Average Hiring Time To Fill The Position Recruitment Training Plan For Employee And Managers Dispense information and present a thorough explanation of Implementing The Recruitment, Average Hiring Time, Implementing The Program using the slides given. This template can be altered and personalized to fit your needs. It is also available for immediate download. So grab it now.
-
 Average Employee Turnover Rate Balanced Scorecard Based On Workforce Age Ppt Infographics
Present the topic in a bit more detail with this Average Employee Turnover Rate Balanced Scorecard Based On Workforce Age Ppt Infographics. Use it as a tool for discussion and navigation on Employee Turnover. This template is free to edit as deemed fit for your organization. Therefore download it now.
-
 Key Average Salary Given To Employees By The Company Salary Survey Report
This slide shows the average compensation structure given to the employees and has been compared with other competitive salaries. It shows the comparison by years of experience, salary by education, and average bonus rate received by the employee. Deliver an outstanding presentation on the topic using this Key Average Salary Given To Employees By The Company Salary Survey Report. Dispense information and present a thorough explanation of Compensation, Structure, Experience using the slides given. This template can be altered and personalized to fit your needs. It is also available for immediate download. So grab it now.
-
 HR Graph For Employee Average Absenteeism Rate
This graph showcases human resource graph for absenteeism rate which indicates employee motivation and engagement in work. It also outlines average absenteeism rate of last six years Introducing our HR Graph For Employee Average Absenteeism Rate set of slides. The topics discussed in these slides are HR Graph, Employee Average, Absenteeism Rate. This is an immediately available PowerPoint presentation that can be conveniently customized. Download it and convince your audience.
-
 Key Average Salary Given To Employees By The Company Income Estimation Report
This slide shows the average compensation structure given to the employees and has been compared with other competitive salaries. It shows the comparison by years of experience, salary by education, and average bonus rate received by the employee. Present the topic in a bit more detail with this Key Average Salary Given To Employees By The Company Income Estimation Report. Use it as a tool for discussion and navigation on Comparison, Compensation, Structure. This template is free to edit as deemed fit for your organization. Therefore download it now.
-
 Key Average Salary Given To Employees By The Company Salary Assessment Report
This slide shows the average compensation structure given to the employees and has been compared with other competitive salaries. It shows the comparison by years of experience, salary by education, and average bonus rate received by the employee. Present the topic in a bit more detail with this Key Average Salary Given To Employees By The Company Salary Assessment Report. Use it as a tool for discussion and navigation on Competitive, Experience, Compensation Structure. This template is free to edit as deemed fit for your organization. Therefore download it now.
-
 Employee Succession Planning And Management Determining Employee Headcount Average Tenure
Following slide displays informational stats about employee headcount and average tenure. It also includes a graph that shows stats about hiring and turnove Deliver an outstanding presentation on the topic using this Employee Succession Planning And Management Determining Employee Headcount Average Tenure. Dispense information and present a thorough explanation of Department Employees, Department, Employee Headcount using the slides given. This template can be altered and personalized to fit your needs. It is also available for immediate download. So grab it now.
-
 Determining Employee Headcount Average Tenure And Turnover Rate Introducing Employee Succession
Following slide displays informational stats about employee headcount and average tenure. It also includes a graph that shows stats about hiring and turnover rate. Deliver an outstanding presentation on the topic using this Determining Employee Headcount Average Tenure And Turnover Rate Introducing Employee Succession. Dispense information and present a thorough explanation of Determining Employee, Headcount Average, Tenure And Turnover Rate using the slides given. This template can be altered and personalized to fit your needs. It is also available for immediate download. So grab it now.
-
 Average Employee Compensation Management Dashboard
The following slide showcases workforce compensation management dashboard to keep a track of benefits provided to employees. The dashboard includes employee count by salary range, workforce details and count by rating. Introducing our Average Employee Compensation Management Dashboard set of slides. The topics discussed in these slides are Average Employee Compensation, Management Dashboard. This is an immediately available PowerPoint presentation that can be conveniently customized. Download it and convince your audience.
-
 Key Statistics Highlighting Average Employee Turnover Rate Industries Developing Staff Retention Strategies
The purpose of this slide is to graphically represent the average staff turnover rate in multiple industries. The industries covered in the slide are construction, manufacturing, transportation, information, financial, hospitality, and health services along with key observations. Present the topic in a bit more detail with this Key Statistics Highlighting Average Employee Turnover Rate Industries Developing Staff Retention Strategies. Use it as a tool for discussion and navigation on Key Statistics Highlighting, Average Employee Turnover Rate, Different Industries. This template is free to edit as deemed fit for your organization. Therefore download it now.
-
 Talent Management And Succession Determining Employee Headcount Average Tenure And Turnover
Following slide displays informational stats about employee headcount and average tenure. It also includes a graph that shows stats about hiring and turnover rate. Present the topic in a bit more detail with this Talent Management And Succession Determining Employee Headcount Average Tenure And Turnover. Use it as a tool for discussion and navigation on Headcount, Average Tenure, Turnover Rate. This template is free to edit as deemed fit for your organization. Therefore download it now.
-
 Determining Employee Headcount Average Developing Leadership Pipeline Through Succession
Following slide displays informational stats about employee headcount and average tenure. It also includes a graph that shows stats about hiring and turnover rate. Deliver an outstanding presentation on the topic using this Determining Employee Headcount Average Developing Leadership Pipeline Through Succession. Dispense information and present a thorough explanation of Determining Employee, Headcount Average, Turnover Rate using the slides given. This template can be altered and personalized to fit your needs. It is also available for immediate download. So grab it now.
-
 Effective Succession Planning Process Determining Employee Headcount Average Tenure And Turnover Rate
Following slide displays informational stats about employee headcount and average tenure. It also includes a graph that shows stats about hiring and turnover rate. Present the topic in a bit more detail with this Effective Succession Planning Process Determining Employee Headcount Average Tenure And Turnover Rate. Use it as a tool for discussion and navigation on Determining Employee, Headcount Average, Tenure And Turnover Rate. This template is free to edit as deemed fit for your organization. Therefore download it now.
-
 Average Salary Review To Analyze Employee Bonus And Overtime Share
This slide showcases salary review to help company analyze future compensation needs. It includes key components such as pay distribution, breakdown, etc. Introducing our Average Salary Review To Analyze Employee Bonus And Overtime Share set of slides. The topics discussed in these slides are Salary Distribution, Bonus Share, Salary Breakdown. This is an immediately available PowerPoint presentation that can be conveniently customized. Download it and convince your audience.
-
 Engineering Company Products And Services Employee Average Wage By Role For Engineering
The slide highlights the average wage for employees of engineering company. It shows average salary in USD against the various roles for engineering seervices. Deliver an outstanding presentation on the topic using this Engineering Company Products And Services Employee Average Wage By Role For Engineering. Dispense information and present a thorough explanation of Engineering Services, Performance, Employee Average Wage using the slides given. This template can be altered and personalized to fit your needs. It is also available for immediate download. So grab it now.
-
 Key Statistics Highlighting Average Employee Turnover Effective Employee Retention
The purpose of this slide is to graphically represent the average staff turnover rate in multiple industries. The industries covered in the slide are construction, manufacturing, transportation, information, financial, hospitality, and health services along with key observations. Deliver an outstanding presentation on the topic using this Key Statistics Highlighting Average Employee Turnover Effective Employee Retention. Dispense information and present a thorough explanation of Employee Turnover, Observations, Industries using the slides given. This template can be altered and personalized to fit your needs. It is also available for immediate download. So grab it now.
-
 Employee Retention Strategies Key Statistics Highlighting Average Employee Turnover Rate
The purpose of this slide is to graphically represent the average staff turnover rate in multiple industries. The industries covered in the slide are construction, manufacturing, transportation, information, financial, hospitality, and health services along with key observations. Deliver an outstanding presentation on the topic using this Employee Retention Strategies Key Statistics Highlighting Average Employee Turnover Rate. Dispense information and present a thorough explanation of Observations, Employee Turnover Rate, Financial Industry using the slides given. This template can be altered and personalized to fit your needs. It is also available for immediate download. So grab it now.
-
 Key Statistics Highlighting Average Employee Turnover Rate In Staff Retention Tactics For Healthcare
Present the topic in a bit more detail with this Key Statistics Highlighting Average Employee Turnover Rate In Staff Retention Tactics For Healthcare. Use it as a tool for discussion and navigation on Companies, Salary, Survey Findings. This template is free to edit as deemed fit for your organization. Therefore download it now.
-
 Analysis Of Employee Average Tenure Succession Planning To Prepare Employees For Leadership Roles
This slide highlights current analysis of employee average tenure and attrition rate in organization. It showcases increase in attrition rate and decline in average employee tenure. Deliver an outstanding presentation on the topic using this Analysis Of Employee Average Tenure Succession Planning To Prepare Employees For Leadership Roles. Dispense information and present a thorough explanation of Analysis, Development, Opportunities using the slides given. This template can be altered and personalized to fit your needs. It is also available for immediate download. So grab it now.
-
 Key Statistics Highlighting Average Employee Turnover Ultimate Guide To Employee Retention Policy
The purpose of this slide is to graphically represent the average staff turnover rate in multiple industries. The industries covered in the slide are construction, manufacturing, transportation, information, financial, hospitality, and health services along with key observations. Deliver an outstanding presentation on the topic using this Key Statistics Highlighting Average Employee Turnover Ultimate Guide To Employee Retention Policy. Dispense information and present a thorough explanation of Industries, Employee, Statistics using the slides given. This template can be altered and personalized to fit your needs. It is also available for immediate download. So grab it now.
-
 Key Statistics Highlighting Average Employee Turnover Employee Retention Strategies To Reduce Staffing Cost
The purpose of this slide is to graphically represent the average staff turnover rate in multiple industries. The industries covered in the slide are construction, manufacturing, transportation, information, financial, hospitality, and health services along with key observations. Present the topic in a bit more detail with this Key Statistics Highlighting Average Employee Turnover Employee Retention Strategies To Reduce Staffing Cost. Use it as a tool for discussion and navigation on Statistics, Observations, Information. This template is free to edit as deemed fit for your organization. Therefore download it now.
-
 Key Statistics Highlighting Average Employee Turnover Rate In Different Industries
The purpose of this slide is to graphically represent the average staff turnover rate in multiple industries. The industries covered in the slide are construction, manufacturing, transportation, information, financial, hospitality, and health services along with key observations. Deliver an outstanding presentation on the topic using this Key Statistics Highlighting Average Employee Turnover Rate In Different Industries. Dispense information and present a thorough explanation of Average Employee, Hospitality Industry using the slides given. This template can be altered and personalized to fit your needs. It is also available for immediate download. So grab it now.
-
 Average Employee Turnover Cost By Profession
This slide illustrates a survey report of professionals facing high turnover cost along with the average rate of all roles. It includes professions such as human resources, research, product management, marketing and consulting. Introducing our Average Employee Turnover Cost By Profession set of slides. The topics discussed in these slides are Profession, Turnover Cost This is an immediately available PowerPoint presentation that can be conveniently customized. Download it and convince your audience.
-
 Key Statistics Highlighting Average Employee Turnover Developing Employee Retention Program
The purpose of this slide is to graphically represent the average staff turnover rate in multiple industries. The industries covered in the slide are construction, manufacturing, transportation, information, financial, hospitality, and health services along with key observations. Present the topic in a bit more detail with this Key Statistics Highlighting Average Employee Turnover Developing Employee Retention Program. Use it as a tool for discussion and navigation on Industries, Employee, Statistics. This template is free to edit as deemed fit for your organization. Therefore download it now.
-
 Key Statistics Highlighting Average Employee Human Resource Retention Strategies For Business Owners
The purpose of this slide is to graphically represent the average staff turnover rate in multiple industries. The industries covered in the slide are construction, manufacturing, transportation, information, financial, hospitality, and health services along with key observations. Present the topic in a bit more detail with this Key Statistics Highlighting Average Employee Human Resource Retention Strategies For Business Owners. Use it as a tool for discussion and navigation on Construction, Manufacturing, Transportation. This template is free to edit as deemed fit for your organization. Therefore download it now.
-
 Rail kpi for average variable employee non employee costs per train ppt slide
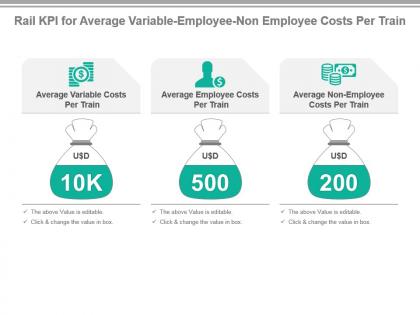
Presenting rail kpi for average variable employee non employee costs per train ppt slide. This presentation slide shows Three Key Performance Indicators or KPIs in a Dashboard style design. The first KPI that can be shown is Average Variable Costs Per Train. The second KPI is Average Employee Costs Per Train. The third is Average Non Employee Costs Per Train. These KPI Powerpoint graphics are all data driven, and the shape automatically adjusts according to your data. Just right click on the KPI graphic, enter the right value and the shape will adjust automatically. Make a visual impact with our KPI slides.
-
 Carrier kpi for average variable employee non employee costs presentation slide
Presenting carrier kpi for average variable employee non employee costs presentation slide. This presentation slide shows three Key Performance Indicators or KPIs in a Dashboard style design. The first KPI that can be shown is Average Variable Costs Per Airplane. The second KPI is Average Employee Costs Per Airplane and the third is Average Non Employee Costs Per Airplane. These KPI Powerpoint graphics are all data driven, and the shape automatically adjusts according to your data. Just right click on the KPI graphic, enter the right value and the shape will adjust automatically. Make a visual impact with our KPI slides.
-
 Kpi for average time to deliver employee costs profit per delivery powerpoint slide
Presenting kpi for average time to deliver employee costs profit per delivery powerpoint slide. This presentation slide shows three Key Performance Indicators or KPIs in a Dashboard style design. The first KPI that can be shown is Average Time to Deliver. The second KPI is Employee Costs Per Delivery and the third is Profit Per Delivery. These KPI Powerpoint graphics are all data driven, and the shape automatically adjusts according to your data. Just right click on the KPI graphic, enter the right value and the shape will adjust automatically. Make a visual impact with our KPI slides.
-
 Kpi for fuel cost per trip average non employee direct costs per truck presentation slide
Presenting kpi for fuel cost per trip average non employee direct costs per truck presentation slide. This presentation slide shows three Key Performance Indicators or KPIs in a Dashboard style design. The first KPI that can be shown is Fuel Cost Per Trip. The second KPI is Average Non Employee Costs Per Truck and the third is Average Direct Costs Per Truck. These KPI Powerpoint graphics are all data driven, and the shape automatically adjusts according to your data. Just right click on the KPI graphic, enter the right value and the shape will adjust automatically. Make a visual impact with our KPI slides.
-
 Kpi for profit average employee costs dentist time per treatment powerpoint slide
Presenting kpi for profit average employee costs dentist time per treatment powerpoint slide. This presentation slide shows three Key Performance Indicators or KPIs in a Dashboard style design. The first KPI that can be shown is Profit Per Dentist Treatment. The second KPI is Average Employee Costs Per Dentist Treatment and the third is Average Dentist Time Per Dentist Treatment. These KPI Powerpoint graphics are all data driven, and the shape automatically adjusts according to your data. Just right click on the KPI graphic, enter the right value and the shape will adjust automatically. Make a visual impact with our KPI slides.
-
 Hospital kpi for average employee costs profit delayed discharges powerpoint slide
Presenting hospital kpi for average employee costs profit delayed discharges powerpoint slide. This presentation slide shows three Key Performance Indicators or KPIs in a Dashboard style design. The first KPI that can be shown is Average Employee Costs Per Hospital Bed. The second KPI is Profit Per Hospital Bed and the third is percentage of Delayed Discharges. These KPI Powerpoint graphics are all data driven, and the shape automatically adjusts according to your data. Just right click on the KPI graphic, enter the right value and the shape will adjust automatically. Make a visual impact with our KPI slides.
-
 Kpi for average employee non employee costs ratio cost per test ppt slide
Presenting kpi for average employee non employee costs ratio cost per test ppt slide. This presentation slide shows three Key Performance Indicators or KPIs in a Dashboard style design. The first KPI that can be shown is Average Employee Costs Per Laboratory Test. The second KPI is Average Non Employee Costs Per Laboratory Test and the third is Ratio Employee Costs Versus Non Employee Costs Per Laboratory Test. These KPI Powerpoint graphics are all data driven, and the shape automatically adjusts according to your data. Just right click on the KPI graphic, enter the right value and the shape will adjust automatically. Make a visual impact with our KPI slides.
-
 Accommodation and food dashboard average number of guests per employee
Presenting this set of slides with name - Accommodation And Food Dashboard Average Number Of Guests Per Employee. This is a six stage process. The stages in this process are Accommodation And Food, Shelter And Food, Accommodation And Beverages.
-
 Average training hours per employee ppt powerpoint presentation inspiration picture cpb
Presenting Average Training Hours Per Employee Ppt Powerpoint Presentation Inspiration Picture Cpb slide which is completely adaptable. The graphics in this PowerPoint slide showcase six stages that will help you succinctly convey the information. In addition, you can alternate the color, font size, font type, and shapes of this PPT layout according to your content. This PPT presentation can be accessed with Google Slides and is available in both standard screen and widescreen aspect ratios. It is also a useful set to elucidate topics like Average Training Hours Per Employee. This well-structured design can be downloaded in different formats like PDF, JPG, and PNG. So, without any delay, click on the download button now.
-
 Employee retention rate average ppt powerpoint presentation gallery guide cpb
Presenting Employee Retention Rate Average Ppt Powerpoint Presentation Gallery Guide Cpb slide which is completely adaptable. The graphics in this PowerPoint slide showcase three stages that will help you succinctly convey the information. In addition, you can alternate the color, font size, font type, and shapes of this PPT layout according to your content. This PPT presentation can be accessed with Google Slides and is available in both standard screen and widescreen aspect ratios. It is also a useful set to elucidate topics like Employee Retention Rate Average. This well structured design can be downloaded in different formats like PDF, JPG, and PNG. So, without any delay, click on the download button now.
-
 Time average number employees ppt powerpoint presentation model design templates cpb
Presenting Time Average Number Employees Ppt Powerpoint Presentation Model Design Templates Cpb slide which is completely adaptable. The graphics in this PowerPoint slide showcase six stages that will help you succinctly convey the information. In addition, you can alternate the color, font size, font type, and shapes of this PPT layout according to your content. This PPT presentation can be accessed with Google Slides and is available in both standard screen and widescreen aspect ratios. It is also a useful set to elucidate topics like Time Average Number Employees. This well-structured design can be downloaded in different formats like PDF, JPG, and PNG. So, without any delay, click on the download button now.
-
 Employee Production Scorecard Average Earning Wage Rate
Present the topic in a bit more detail with this Employee Production Scorecard Average Earning Wage Rate. Use it as a tool for discussion and navigation on Employee, Production, Scorecard. This template is free to edit as deemed fit for your organization. Therefore download it now.
-
 Average Cost Employer Health Coverage Ppt Powerpoint Presentation Layouts Design Inspiration Cpb
Presenting our Average Cost Employer Health Coverage Ppt Powerpoint Presentation Layouts Design Inspiration Cpb PowerPoint template design. This PowerPoint slide showcases three stages. It is useful to share insightful information on Average Cost Employer Health Coverage This PPT slide can be easily accessed in standard screen and widescreen aspect ratios. It is also available in various formats like PDF, PNG, and JPG. Not only this, the PowerPoint slideshow is completely editable and you can effortlessly modify the font size, font type, and shapes according to your wish. Our PPT layout is compatible with Google Slides as well, so download and edit it as per your knowledge.
-
 Average Cost Employee Turnover Ppt Powerpoint Presentation Summary Background Cpb
Presenting Average Cost Employee Turnover Ppt Powerpoint Presentation Summary Background Cpb slide which is completely adaptable. The graphics in this PowerPoint slide showcase three stages that will help you succinctly convey the information. In addition, you can alternate the color, font size, font type, and shapes of this PPT layout according to your content. This PPT presentation can be accessed with Google Slides and is available in both standard screen and widescreen aspect ratios. It is also a useful set to elucidate topics like Average Cost Employee Turnover. This well structured design can be downloaded in different formats like PDF, JPG, and PNG. So, without any delay, click on the download button now.
-
 Average Burden Rate Employees Ppt Powerpoint Presentation Layouts Show Cpb
Presenting Average Burden Rate Employees Ppt Powerpoint Presentation Layouts Show Cpb slide which is completely adaptable. The graphics in this PowerPoint slide showcase four stages that will help you succinctly convey the information. In addition, you can alternate the color, font size, font type, and shapes of this PPT layout according to your content. This PPT presentation can be accessed with Google Slides and is available in both standard screen and widescreen aspect ratios. It is also a useful set to elucidate topics like Average Burden Rate Employees. This well-structured design can be downloaded in different formats like PDF, JPG, and PNG. So, without any delay, click on the download button now.
-
 Average Cost Onboard New Employee Ppt Powerpoint Presentation Ideas Show Cpb
Presenting Average Cost Onboard New Employee Ppt Powerpoint Presentation Ideas Show Cpb slide which is completely adaptable. The graphics in this PowerPoint slide showcase five stages that will help you succinctly convey the information. In addition, you can alternate the color, font size, font type, and shapes of this PPT layout according to your content. This PPT presentation can be accessed with Google Slides and is available in both standard screen and widescreen aspect ratios. It is also a useful set to elucidate topics like Average Cost Onboard New Employee. This well-structured design can be downloaded in different formats like PDF, JPG, and PNG. So, without any delay, click on the download button now.
-
 Employee Wellbeing And Benefits Statement With Average Cost
Introducing our Employee Wellbeing And Benefits Statement With Average Cost set of slides. The topics discussed in these slides are Percentage Of Employees, Average Cost, Employees. This is an immediately available PowerPoint presentation that can be conveniently customized. Download it and convince your audience.
-
 Average Employee Benefits Ppt Powerpoint Presentation Icon Pictures Cpb
Presenting our Average Employee Benefits Ppt Powerpoint Presentation Icon Pictures Cpb PowerPoint template design. This PowerPoint slide showcases four stages. It is useful to share insightful information on Average Employee Benefits. This PPT slide can be easily accessed in standard screen and widescreen aspect ratios. It is also available in various formats like PDF, PNG, and JPG. Not only this, the PowerPoint slideshow is completely editable and you can effortlessly modify the font size, font type, and shapes according to your wish. Our PPT layout is compatible with Google Slides as well, so download and edit it as per your knowledge.


