Powerpoint Templates and Google slides for Analytics Report
Save Your Time and attract your audience with our fully editable PPT Templates and Slides.
-
 Governed Data And Analytic Quality Playbook Report Sample Example Document
This is a reformattable Governed Data And Analytic Quality Playbook Report Sample Example Document. It is crafted with high quality visuals available for immediate download in A4 size. Everything that this template offers can be accessed in different formats and ratios, including Google Slides and PowerPoint.
-
 Data Analytics Playbook Report Sample Example Document
This is Data Analytics Playbook Report Sample Example Document featuring A4 size content and graphics. It is designed in PowerPoint using various tools. However, you can also access it with Google Slides.
-
 Strategic Playbook For Data Analytics And Machine Learning Report Sample Example Document
This is Strategic Playbook For Data Analytics And Machine Learning Report Sample Example Document featuring A4 size content and graphics. It is designed in PowerPoint using various tools. However, you can also access it with Google Slides.
-
 Data Analytics And BI Playbook Report Sample Example Document
This is Data Analytics And BI Playbook Report Sample Example Document featuring A4 size content and graphics. It is designed in PowerPoint using various tools. However, you can also access it with Google Slides.
-
 Next Generation Search And AI powered Analytics Report Sample Example Document
This is a complete deck titled Next Generation Search And AI powered Analytics Report Sample Example Document. It is crafted using high-quality visuals that can be readjusted in PowerPoint and Google Slides. This template comes in an editable format and is available in A4 size format for immediate download.
-
 Data Analytics Solution Deployment Proposal Report Sample Example Document
This is a complete deck titled Data Analytics Solution Deployment Proposal Report Sample Example Document. It is crafted using high-quality visuals that can be readjusted in PowerPoint and Google Slides. This template comes in an editable format and is available in A4 size format for immediate download.
-
 Project Proposal For Big Data Analytics Report Sample Example Document
This is Project Proposal For Big Data Analytics Report Sample Example Document featuring A4 size content and graphics. It is designed in PowerPoint using various tools. However, you can also access it with Google Slides.
-
 Marketing Analytics Annual Report Pdf Doc Ppt Document Report Template
This report focuses on measuring and analyzing the performance of marketing programs implemented in the company. A company overview business approach, consolidated financial statement are covered in this PowerPoint presentation. Market position and key elements are discussed here which covers the competitive strength and growth strategy. The report shares the customer list allocated by industry the major accomplishments of the company etc. The ROI of the firm is measured in this slide along with various marketing campaign performance. We have also covered the consolidated financial statements such as balance sheet operations stockholders equity and cash flows. Download this 100 percent editable and customizable PowerPoint template which is also compatible with google slides.
-
 Website Analytics Report Powerpoint Ppt Template Bundles
If you require a professional template with great design,then this Website Analytics Report Powerpoint Ppt Template Bundles is an ideal fit for you. Deploy it to enthrall your audience and increase your presentation threshold with the right graphics,images,and structure. Portray your ideas and vision using twelve slides included in this complete deck. This template is suitable for expert discussion meetings presenting your views on the topic. With a variety of slides having the same thematic representation,this template can be regarded as a complete package. It employs some of the best design practices,so everything is well-structured. Not only this,it responds to all your needs and requirements by quickly adapting itself to the changes you make. This PPT slideshow is available for immediate download in PNG,JPG,and PDF formats,further enhancing its usability. Grab it by clicking the download button.
-
 Service Offering Social Listening Consumer Insights Analytics And Reporting
This aptly crafted editable PPT deck contains fifteen slides. Our topic specific Service Offering Social Listening Consumer Insights Analytics And Reporting presentation deck helps devise the topic with a clear approach. We offer a wide range of custom made slides with all sorts of relevant charts and graphs, overviews, topics subtopics templates, and analysis templates. Speculate, discuss, design or demonstrate all the underlying aspects with zero difficulty. This deck also consists creative and professional looking slides of all sorts to achieve the target of a presentation effectively. You can present it individually or as a team working in any company organization.
-
 Analytics Journey Data Exploration Operational Reporting Value Creation
Deliver a credible and compelling presentation by deploying this Analytics Journey Data Exploration Operational Reporting Value Creation. Intensify your message with the right graphics, images, icons, etc. presented in this complete deck. This PPT template is a great starting point to convey your messages and build a good collaboration. The twelve slides added to this PowerPoint slideshow helps you present a thorough explanation of the topic. You can use it to study and present various kinds of information in the form of stats, figures, data charts, and many more. This Analytics Journey Data Exploration Operational Reporting Value Creation PPT slideshow is available for use in standard and widescreen aspects ratios. So, you can use it as per your convenience. Apart from this, it can be downloaded in PNG, JPG, and PDF formats, all completely editable and modifiable. The most profound feature of this PPT design is that it is fully compatible with Google Slides making it suitable for every industry and business domain.
-
 KPI Dashboard To Assess M And A Analytics Report Guide Of Business Merger And Acquisition Plan Strategy SS V
This slide covers KPI dashboard to assess MAndA analytics report. It involves key details such as percentage of total number of MAndA, nature of business acquired and digital focused acquisitions. Present the topic in a bit more detail with this KPI Dashboard To Assess M And A Analytics Report Guide Of Business Merger And Acquisition Plan Strategy SS V. Use it as a tool for discussion and navigation on Digital Focused Acquisitions, Nature Of Business Acquired. This template is free to edit as deemed fit for your organization. Therefore download it now.
-
 Guide For Web And Digital Marketing Marketing Web Analytics Report Overview MKT SS V
The following slide depicts website analytics reports to gain insights associated with web performance and ensure effective user experience. It includes metrics such as number of sessions, page views, traffic, concentration rate, visits etc. Present the topic in a bit more detail with this Guide For Web And Digital Marketing Marketing Web Analytics Report Overview MKT SS V. Use it as a tool for discussion and navigation on Page Views, Web Traffic Concentration. This template is free to edit as deemed fit for your organization. Therefore download it now.
-
 Social Media Analytics Report By Channel Guide For Web And Digital Marketing MKT SS V
The following slide depicts key insights of social media analytics summary to determine emerging trends and gather information. It includes elements such as conversions by channel type, impressions, reach, followers, comments, likes, views etc. Present the topic in a bit more detail with this Social Media Analytics Report By Channel Guide For Web And Digital Marketing MKT SS V. Use it as a tool for discussion and navigation on Channel Type, Impressions Vs Reach. This template is free to edit as deemed fit for your organization. Therefore download it now.
-
 Marketing Web Analytics Report Overview Guide For Implementing Analytics MKT SS V
The following slide depicts website analytics reports to gain insights associated with web performance and ensure effective user experience. It includes metrics such as number of sessions, page views, traffic, concentration rate, visits etc.Deliver an outstanding presentation on the topic using this Marketing Web Analytics Report Overview Guide For Implementing Analytics MKT SS V. Dispense information and present a thorough explanation of Marketing Web, Analytics Report Overview using the slides given. This template can be altered and personalized to fit your needs. It is also available for immediate download. So grab it now.
-
 Social Media Analytics Report By Channel Guide For Implementing Analytics MKT SS V
The following slide depicts key insights of social media analytics summary to determine emerging trends and gather information. It includes elements such as conversions by channel type, impressions, reach, followers, comments, likes, views etc. Deliver an outstanding presentation on the topic using this Social Media Analytics Report By Channel Guide For Implementing Analytics MKT SS V. Dispense information and present a thorough explanation of Social Media Analytics, Report Channel using the slides given. This template can be altered and personalized to fit your needs. It is also available for immediate download. So grab it now.
-
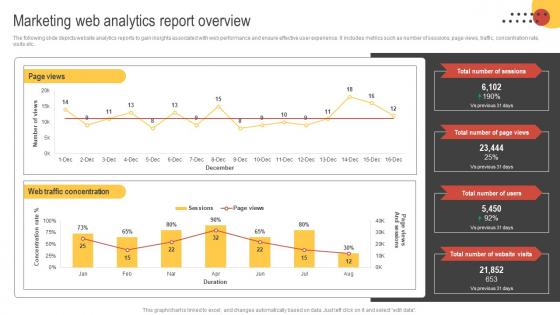 Big Data Marketing Marketing Web Analytics Report Overview MKT SS V
The following slide depicts website analytics reports to gain insights associated with web performance and ensure effective user experience. It includes metrics such as number of sessions, page views, traffic, concentration rate, visits etc. Deliver an outstanding presentation on the topic using this Big Data Marketing Marketing Web Analytics Report Overview MKT SS V Dispense information and present a thorough explanation of Web Traffic Concentration, Number Of Sessions, Number Of Page Views using the slides given. This template can be altered and personalized to fit your needs. It is also available for immediate download. So grab it now.
-
 Big Data Marketing Social Media Analytics Report By Channel MKT SS V
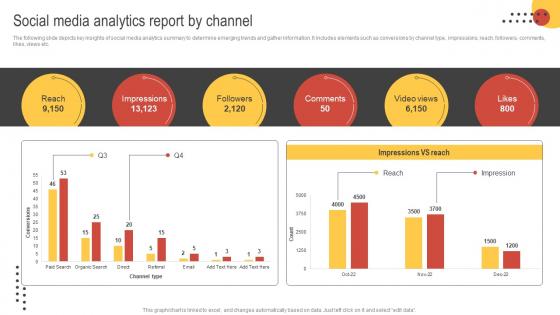
The following slide depicts key insights of social media analytics summary to determine emerging trends and gather information. It includes elements such as conversions by channel type, impressions, reach, followers, comments, likes, views etc. Present the topic in a bit more detail with this Big Data Marketing Social Media Analytics Report By Channel MKT SS V Use it as a tool for discussion and navigation on Reach, Impressions, Followers This template is free to edit as deemed fit for your organization. Therefore download it now.
-
 Content Nurturing Strategies Google Analytics Report To Analyze Target Customers Demographics MKT SS
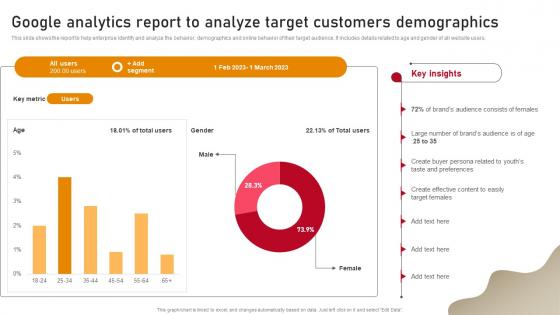
This slide shows the report to help enterprise identify and analyze the behavior, demographics and online behavior of their target audience. It includes details related to age and gender of all website users. Deliver an outstanding presentation on the topic using this Content Nurturing Strategies Google Analytics Report To Analyze Target Customers Demographics MKT SS Dispense information and present a thorough explanation of Content Marketing Manager, Brand Marketing Manager, Senior Designer using the slides given. This template can be altered and personalized to fit your needs. It is also available for immediate download. So grab it now.
-
 Marketing Web Analytics Report Overview Marketing Data Analysis MKT SS V
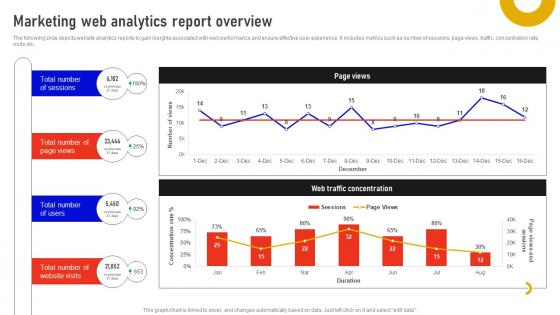
The following slide depicts website analytics reports to gain insights associated with web performance and ensure effective user experience. It includes metrics such as number of sessions, page views, traffic, concentration rate, visits etc. Present the topic in a bit more detail with this Marketing Web Analytics Report Overview Marketing Data Analysis MKT SS V Use it as a tool for discussion and navigation on Marketing, Web Analytics, Report Overview This template is free to edit as deemed fit for your organization. Therefore download it now.
-
 Social Media Analytics Report By Channel Marketing Data Analysis MKT SS V
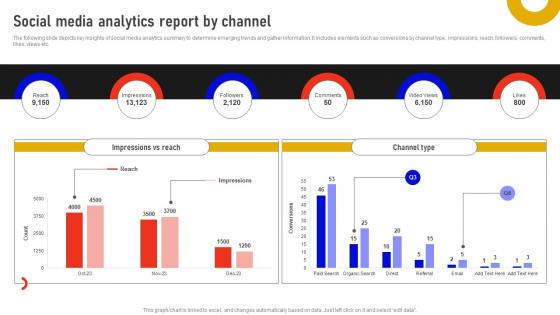
The following slide depicts key insights of social media analytics summary to determine emerging trends and gather information. It includes elements such as conversions by channel type, impressions, reach, followers, comments, likes, views etc. Present the topic in a bit more detail with this Social Media Analytics Report By Channel Marketing Data Analysis MKT SS V Use it as a tool for discussion and navigation on Channel Type, Social Media, Analytics Report This template is free to edit as deemed fit for your organization. Therefore download it now.
-
 International Market Research Report On Brand Analytics
This slide shows the global market research report on the outdoor gear products brand. It includes the brand awareness, top 5 branding themes, sample distribution on the basis of age, region and gender. Introducing our International Market Research Report On Brand Analytics set of slides. The topics discussed in these slides are Brand Awareness, Sample Information. This is an immediately available PowerPoint presentation that can be conveniently customized. Download it and convince your audience.
-
 Marketing Web Analytics Report Overview Guide For Social Media Marketing MKT SS V
The following slide depicts website analytics reports to gain insights associated with web performance and ensure effective user experience. It includes metrics such as number of sessions, page views, traffic, concentration rate, visits etc.Present the topic in a bit more detail with this Marketing Web Analytics Report Overview Guide For Social Media Marketing MKT SS V. Use it as a tool for discussion and navigation on Marketing Web Analytics, Report Overview. This template is free to edit as deemed fit for your organization. Therefore download it now.
-
 Social Media Analytics Report By Channel Guide For Social Media Marketing MKT SS V
The following slide depicts key insights of social media analytics summary to determine emerging trends and gather information. It includes elements such as conversions by channel type, impressions, reach, followers, comments, likes, views etc.Present the topic in a bit more detail with this Social Media Analytics Report By Channel Guide For Social Media Marketing MKT SS V. Use it as a tool for discussion and navigation on Impressions, Comments, Social Media Analytics Report. This template is free to edit as deemed fit for your organization. Therefore download it now.
-
 Marketing Web Analytics Report Overview Guide For Improving Decision MKT SS V
The following slide depicts website analytics reports to gain insights associated with web performance and ensure effective user experience. It includes metrics such as number of sessions, page views, traffic, concentration rate, visits etc. Present the topic in a bit more detail with this Marketing Web Analytics Report Overview Guide For Improving Decision MKT SS V. Use it as a tool for discussion and navigation on Website Visits, Marketing, Web Analytics. This template is free to edit as deemed fit for your organization. Therefore download it now.
-
 Social Media Analytics Report By Channel Guide For Improving Decision MKT SS V
The following slide depicts key insights of social media analytics summary to determine emerging trends and gather information. It includes elements such as conversions by channel type, impressions, reach, followers, comments, likes, views etc. Present the topic in a bit more detail with this Social Media Analytics Report By Channel Guide For Improving Decision MKT SS V. Use it as a tool for discussion and navigation on Social Media, Analytics Report By Channel, Comments. This template is free to edit as deemed fit for your organization. Therefore download it now.
-
 Marketing Web Analytics Report Overview Guide For Boosting Marketing MKT SS V
The following slide depicts website analytics reports to gain insights associated with web performance and ensure effective user experience. It includes metrics such as number of sessions, page views, traffic, concentration rate, visits etc. Present the topic in a bit more detail with this Marketing Web Analytics Report Overview Guide For Boosting Marketing MKT SS V. Use it as a tool for discussion and navigation on Web Traffic Concentration, Page Views. This template is free to edit as deemed fit for your organization. Therefore download it now.
-
 Social Media Analytics Report By Channel Guide For Boosting Marketing MKT SS V
The following slide depicts key insights of social media analytics summary to determine emerging trends and gather information. It includes elements such as conversions by channel type, impressions, reach, followers, comments, likes, views etc. Present the topic in a bit more detail with this Social Media Analytics Report By Channel Guide For Boosting Marketing MKT SS V. Use it as a tool for discussion and navigation on Impressions, Comments. This template is free to edit as deemed fit for your organization. Therefore download it now.
-
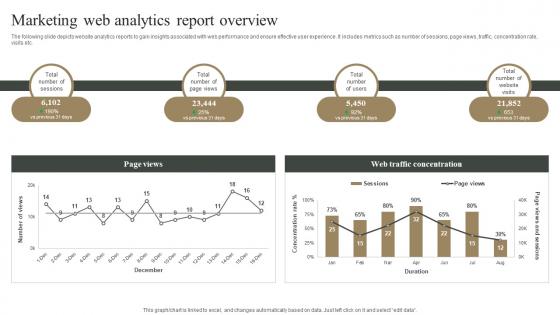 Marketing Web Analytics Report Overview Measuring Marketing Success MKT SS V
The following slide depicts website analytics reports to gain insights associated with web performance and ensure effective user experience. It includes metrics such as number of sessions, page views, traffic, concentration rate, visits etc. Present the topic in a bit more detail with this Marketing Web Analytics Report Overview Measuring Marketing Success MKT SS V Use it as a tool for discussion and navigation on Marketing, Web Analytics, Report Overview This template is free to edit as deemed fit for your organization. Therefore download it now.
-
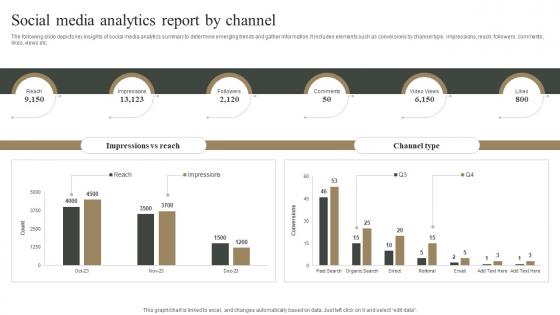 Social Media Analytics Report By Channel Measuring Marketing Success MKT SS V
The following slide depicts key insights of social media analytics summary to determine emerging trends and gather information. It includes elements such as conversions by channel type, impressions, reach, followers, comments, likes, views etc. Present the topic in a bit more detail with this Social Media Analytics Report By Channel Measuring Marketing Success MKT SS V Use it as a tool for discussion and navigation on Social Media, Analytics Report, Channel This template is free to edit as deemed fit for your organization. Therefore download it now.
-
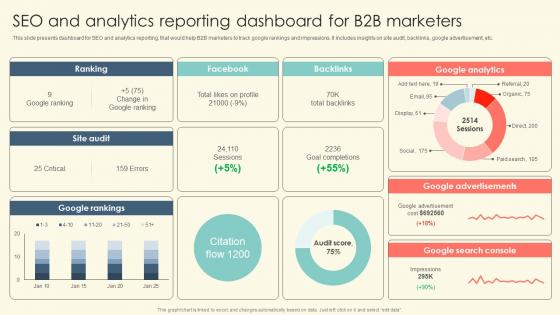 Seo And Analytics Reporting Dashboard For B2B Marketers B2B Online Marketing Strategies
This slide presents dashboard for SEO and analytics reporting, that would help B2B marketers to track google rankings and impressions. It includes insights on site audit, backlinks, google advertisement, etc. Deliver an outstanding presentation on the topic using this Seo And Analytics Reporting Dashboard For B2B Marketers B2B Online Marketing Strategies Dispense information and present a thorough explanation of Google Analytics, Google Advertisements, B2b Marketers using the slides given. This template can be altered and personalized to fit your needs. It is also available for immediate download. So grab it now.
-
 Radio Station Reporting And Analytics Setting Up An Own Internet Radio Station
This slide outlines a dashboard with various elements such as revenue pricing, audience funnel, pageview trends, revenye by medium and engagement trends. Present the topic in a bit more detail with this Radio Station Reporting And Analytics Setting Up An Own Internet Radio Station. Use it as a tool for discussion and navigation on Revenue Pacing, Pageview Trends, Audience Funnel. This template is free to edit as deemed fit for your organization. Therefore download it now.
-
 Ports Industry Report Big Data Analytics Market Statistics IR SS
The slide examines the attributes on the basis of technology used in the port industry. The purpose of this slide is to make readers aware about the big data analytics market in the port sector. Present the topic in a bit more detail with this Ports Industry Report Big Data Analytics Market Statistics IR SS. Use it as a tool for discussion and navigation on Big Data Analytics, Market Statistics, Global Marine Big Data, Market Is Expected To Reach. This template is free to edit as deemed fit for your organization. Therefore download it now.
-
 Organic Seo Report Of Organization Using Google Analytic Software
This slide shows SEO dashboards for organizations using Google Analytics software to track or evaluate website performance metric. The KPIs are total sessions, average sessions, new sessions, bounce rate, goal completion, etc. Introducing our Organic Seo Report Of Organization Using Google Analytic Software set of slides. The topics discussed in these slides are Organization, Analytic, Software. This is an immediately available PowerPoint presentation that can be conveniently customized. Download it and convince your audience.
-
 Analyzing Marketing Attribution Marketing Attribution Software For Accurate Reporting And Analytics
This slide highlights comparison between various tools used for marketing attribution which helps in analyzing customer journey and accurate reporting. It provides information regarding software, features, price, market segment, free trial and user ratings. Present the topic in a bit more detail with this Analyzing Marketing Attribution Marketing Attribution Software For Accurate Reporting And Analytics Use it as a tool for discussion and navigation on Tracked Organic Visits, All Organic Visits, Top 3 Keywords This template is free to edit as deemed fit for your organization. Therefore download it now.
-
 Advanced Analytics Reporting In Powerpoint And Google Slides Cpb
Presenting our Advanced Analytics Reporting In Powerpoint And Google Slides Cpb PowerPoint template design. This PowerPoint slide showcases four stages. It is useful to share insightful information on Advanced Analytics Reporting This PPT slide can be easily accessed in standard screen and widescreen aspect ratios. It is also available in various formats like PDF, PNG, and JPG. Not only this, the PowerPoint slideshow is completely editable and you can effortlessly modify the font size, font type, and shapes according to your wish. Our PPT layout is compatible with Google Slides as well, so download and edit it as per your knowledge.
-
 Reporting Impact Analytics Marketing In Powerpoint And Google Slides Cpb
Presenting our Reporting Impact Analytics Marketing In Powerpoint And Google Slides Cpb PowerPoint template design. This PowerPoint slide showcases Six stages. It is useful to share insightful information on Reporting Impact Analytics Marketing This PPT slide can be easily accessed in standard screen and widescreen aspect ratios. It is also available in various formats like PDF, PNG, and JPG. Not only this, the PowerPoint slideshow is completely editable and you can effortlessly modify the font size, font type, and shapes according to your wish. Our PPT layout is compatible with Google Slides as well, so download and edit it as per your knowledge.
-
 Sales Analytics Reports In Powerpoint And Google Slides Cpb
Presenting Sales Analytics Reports In Powerpoint And Google Slides Cpb slide which is completely adaptable. The graphics in this PowerPoint slide showcase four stages that will help you succinctly convey the information. In addition, you can alternate the color, font size, font type, and shapes of this PPT layout according to your content. This PPT presentation can be accessed with Google Slides and is available in both standard screen and widescreen aspect ratios. It is also a useful set to elucidate topics like Sales Analytics Reports. This well structured design can be downloaded in different formats like PDF, JPG, and PNG. So, without any delay, click on the download button now.
-
 Big Data Analytics Report In Accounting Icon
Presenting our set of slides with Big Data Analytics Report In Accounting Icon. This exhibits information on three stages of the process. This is an easy to edit and innovatively designed PowerPoint template. So download immediately and highlight information on Big Data Analytics Report, Accounting Icon.
-
 Business Intelligence Analytics Virtual Report Icon
Presenting our set of slides with Business Intelligence Analytics Virtual Report Icon. This exhibits information on four stages of the process. This is an easy to edit and innovatively designed PowerPoint template. So download immediately and highlight information on Virtual, Report, Business.
-
 Visual Information Analytics Report Icon
Introducing our premium set of slides with Visual Information Analytics Report Icon. Ellicudate the three stages and present information using this PPT slide. This is a completely adaptable PowerPoint template design that can be used to interpret topics like Information, Analytics, Report Icon. So download instantly and tailor it with your information.
-
 Text Analytics Icon For Statistical Report
Presenting our well structured Text Analytics Icon For Statistical Report. The topics discussed in this slide are Text Analytics Icon, Statistical Report. This is an instantly available PowerPoint presentation that can be edited conveniently. Download it right away and captivate your audience.
-
 Client Data And Analytics Insights Report Icon
Introducing our premium set of slides with Client Data And Analytics Insights Report Icon. Ellicudate the three stages and present information using this PPT slide. This is a completely adaptable PowerPoint template design that can be used to interpret topics like Customer Analytics, Insights Report Icon. So download instantly and tailor it with your information.
-
 Building Effective Report With Linkedin Analytics
This slide highlights stages for creating efficient reportwith LinkedIn analytics. The purpose of this slide is to provide managers with well-defined steps for achieving marketing goals on time. It includes elements such as define objectives, gather data, etc. Introducing our premium set of slides with Building Effective Report With Linkedin Analytics Ellicudate the Five stages and present information using this PPT slide. This is a completely adaptable PowerPoint template design that can be used to interpret topics like Define Objectives, Gather Data, Organize And Analyze. So download instantly and tailor it with your information.
-
 Digital Transformation Erp For Deriving Realtime Analytics And Reporting DT SS
This slide showcases the key features of ERP and how it helps in effective business decision-making through real-time analytics and reporting. It includes data integration, live data connectivity, and interactive reports. Increase audience engagement and knowledge by dispensing information using Digital Transformation Erp For Deriving Realtime Analytics And Reporting DT SS This template helps you present information on Three stages. You can also present information on Smart Manufacturing, Workforce Training, Smart Manufacturing using this PPT design. This layout is completely editable so personaize it now to meet your audiences expectations.
-
 Data Quality Icon For Reporting And Analytics
Presenting our set of slides with Data Quality Icon For Reporting And Analytics. This exhibits information on three stages of the process. This is an easy to edit and innovatively designed PowerPoint template. So download immediately and highlight information on Data Quality Icon, Reporting And Analytics.
-
 Statistic Report Google Data Analytics Icon
Introducing our premium set of slides with Statistic Report Google Data Analytics Icon Ellicudate the three stages and present information using this PPT slide. This is a completely adaptable PowerPoint template design that can be used to interpret topics like Statistic Report, Google Data Analytics Icon So download instantly and tailor it with your information.
-
 Big Data Analytics Report In Finance Icon
Presenting our set of slides with Big Data Analytics Report In Finance Icon. This exhibits information on three stages of the process. This is an easy to edit and innovatively designed PowerPoint template. So download immediately and highlight information on Big Data Analytics Report, Finance Icon.
-
 Big Data Analytics Reporting Tools With Uses And Limitations
This slide showcases uses and drawbacks of big data analytics reporting tools. It aims to make more planned business decision and to verify theories, models, etc. It includes various elements such as tools, uses, limitations, etc. Presenting our well structured Big Data Analytics Reporting Tools With Uses And Limitations. The topics discussed in this slide are Tools, Reporting, Analytics. This is an instantly available PowerPoint presentation that can be edited conveniently. Download it right away and captivate your audience.
-
 Key Features Of Big Data Analytics Tools For Reporting
This slide showcases characteristics for big data reporting tools. It aims to enable businesses to analyze massive data sets with motive to present actionable business insights. It includes different features evaluated such as uploading and examining data, variety of reporting components, etc. Presenting our set of slides with Key Features Of Big Data Analytics Tools For Reporting. This exhibits information on five stages of the process. This is an easy to edit and innovatively designed PowerPoint template. So download immediately and highlight information on Analysis, Examine, Components.
-
 Types Of Big Data Analytics Tools For Reporting
This slide showcases different types of big data analytics tools for reporting. It aims to allow companies in examining large datasets to show hidden patterns, insights and trends. It includes several types such as business analytics, statistical analytics, etc. Presenting our set of slides with Types Of Big Data Analytics Tools For Reporting. This exhibits information on four stages of the process. This is an easy to edit and innovatively designed PowerPoint template. So download immediately and highlight information on Benefits, Reporting, Analytics.
-
 Efficient Sales Processes With CRM Reporting And Analytics With CRM Automation Software CRP DK SS
This slide showcases reporting and analytics dashboard on CRM automation tool including attributes such as deal name, stage, expected revenue, etc. Increase audience engagement and knowledge by dispensing information using Efficient Sales Processes With CRM Reporting And Analytics With CRM Automation Software CRP DK SS. This template helps you present information on eight stages. You can also present information on Reporting And Analytics, CRM Automation Software, Analytics Dashboard, Expected Revenue using this PPT design. This layout is completely editable so personaize it now to meet your audiences expectations.
-
 Big Data Analytics Tools And Platforms For Reporting
This slide highlights platforms and tools of big data analytics for reporting. It aims to assist buyers for adequate analytics tools and software to fit requirements of organization. It includes various tools, platforms, related products and description. Introducing our Big Data Analytics Tools And Platforms For Reporting set of slides. The topics discussed in these slides are Domo Everywhere, Domo Integration Cloud, Pentaho Data Integration. This is an immediately available PowerPoint presentation that can be conveniently customized. Download it and convince your audience.
-
 Key Features Of Data Analytics Tools For Reporting
This slide showcases data analytics tools for reporting features. It aims to enable businesses to analyze massive data sets on cloud. It includes different features evaluated such as uploading and examining data, variety of reporting components, etc. Presenting our set of slides with Key Features Of Data Analytics Tools For Reporting. This exhibits information on five stages of the process. This is an easy to edit and innovatively designed PowerPoint template. So download immediately and highlight information on Update And Examine Data, Anaytics For Big Data, Integrated Analysis And Review.
-
 Digital Marketing Quarterly Analytics Report
This slide showcases digital marketing quarterly report and includes engagement, average visit duration, average new engagement, etc. Introducing our Digital Marketing Quarterly Analytics Report set of slides. The topics discussed in these slides are Engagement, Visit Duration, New Engagement. This is an immediately available PowerPoint presentation that can be conveniently customized. Download it and convince your audience.
-
 Log Data Report Analytics Icon
Presenting our well structured Log Data Report Analytics Icon The topics discussed in this slide are Log Data Report, Analytics Icon This is an instantly available PowerPoint presentation that can be edited conveniently.Download it right away and captivate your audience.
-
 Defining Various Categories Of Data Analytics And Reporting Tools Mastering Digital Project PM SS V
The purpose of the mentioned slide is to showcase different types of data analytics tools that enhance the project-related tasks. It includes Microsoft Excel, Tableau, Business Intelligence, and custom dashboards Increase audience engagement and knowledge by dispensing information using Defining Various Categories Of Data Analytics And Reporting Tools Mastering Digital Project PM SS V This template helps you present information on four stages. You can also present information on Microsoft Excel, Business Intelligence, Custom Dashboards using this PPT design. This layout is completely editable so personaize it now to meet your audiences expectations.
-
 Potential Use Cases Of Incorporating Data Analytics And Reporting Tool Mastering Digital Project PM SS V
The purpose of the mentioned slide is to showcase various applications of data reporting and analytics tools in project management. It helps with risk assessment and mitigation, budget management, quality assurance, and project scheduling Introducing Potential Use Cases Of Incorporating Data Analytics And Reporting Tool Mastering Digital Project PM SS V to increase your presentation threshold. Encompassed with four stages, this template is a great option to educate and entice your audience. Dispence information on Risk Assessment, Quality Assurance, Project Scheduling using this template. Grab it now to reap its full benefits.
-
 Healthcare Bi And Analytics Reporting Framework
This slide covers framework for healthcare BI and analytics reporting to help hospitals gain actionable insights from data including solutions, supporting services, etc. Presenting our set of slides with Healthcare Bi And Analytics Reporting Framework This exhibits information on three stages of the process. This is an easy to edit and innovatively designed PowerPoint template. So download immediately and highlight information on Project Management, Healthcare Business Intelligence, Reporting Framework
-
 Difference Between Operation And Analytical Reporting
This slide showcases the difference between operation and analytical reporting. The purpose of this slide is to help the business utilize suitable reporting measures in order to meet its goals. It includes comparison on the basis of purpose, focus, data, etc. Introducing our Difference Between Operation And Analytical Reporting set of slides. The topics discussed in these slides are Parameters, Operation Reporting, Analytical Reporting. This is an immediately available PowerPoint presentation that can be conveniently customized. Download it and convince your audience.


