Powerpoint Templates and Google slides for Analytics Business
Save Your Time and attract your audience with our fully editable PPT Templates and Slides.
-
 Real Time Budget Analytics Dashboard For Business
This slide highlights real-time operational analytics for business entity. The purpose of this slide is to streamline business operations by improving productivity and reducing expenses. It includes elements such budget revenue total, debt to equity ratio, etc. Introducing our Real Time Budget Analytics Dashboard For Business set of slides. The topics discussed in these slides are Budget, Budget Total. This is an immediately available PowerPoint presentation that can be conveniently customized. Download it and convince your audience.
-
 Real Time Marketing Analytics For Business Growth
This slide highlights real-time marketing analytics for business success. The purpose of this slide is to provide basis for evaluating marketing efforts, measuring effectiveness of marketing techniques. It includes elements such as CPA and CPC by campaigns, etc. along with key insights. Introducing our Real Time Marketing Analytics For Business Growth set of slides. The topics discussed in these slides are Acquisitions By Campaign. This is an immediately available PowerPoint presentation that can be conveniently customized. Download it and convince your audience.
-
 Metaverse Retail Dashboard For Business Insights And Analytics
This slide showcases dashboard of Metaverse retail for insights. The main purpose of this slide is to provide real time data and insights that are essential for retail business. This includes website traffic, website visitors, bounce rate, etc. Introducing our Metaverse Retail Dashboard For Business Insights And Analytics set of slides. The topics discussed in these slides are Website Traffic, Bounce Rate. This is an immediately available PowerPoint presentation that can be conveniently customized. Download it and convince your audience.
-
 Business Intelligence Dashboard Showcasing Website Analytics
This slide showcases the Google analytics and power business intelligence dashboard which helps an organization to provide valuable insights website visits and their growth. It include details such as January, march, may, july, august, October, December. Presenting our well structured Business Intelligence Dashboard Showcasing Website Analytics. The topics discussed in this slide are Intelligence, Website, Analytics. This is an instantly available PowerPoint presentation that can be edited conveniently. Download it right away and captivate your audience.
-
 Transforming From Traditional Dashboard Analytics Business Model Innovation Impact On Customer DT SS
This slide represents an analytics dashboard for measuring impact on customer satisfaction due to adoption of new digital business model. It tracks KPIS such as net promoter score, customer retention and customer effort score. Present the topic in a bit more detail with this Transforming From Traditional Dashboard Analytics Business Model Innovation Impact On Customer DT SS Use it as a tool for discussion and navigation on Net Promoter Score, Customer Retention, Customer Effort Score This template is free to edit as deemed fit for your organization. Therefore download it now.
-
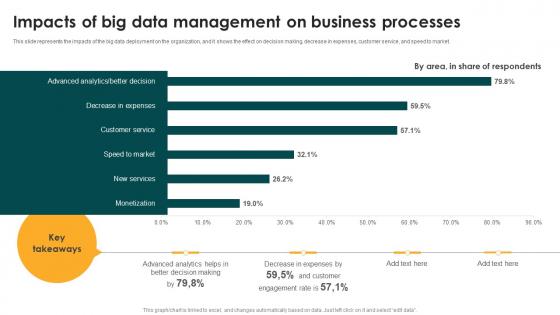 Impacts Of Big Data Management On Business Big Data Analytics And Management
This slide represents the impacts of the big data deployment on the organization, and it shows the effect on decision making, decrease in expenses, customer service, and speed to market. Present the topic in a bit more detail with this Impacts Of Big Data Management On Business Big Data Analytics And Management. Use it as a tool for discussion and navigation on Impacts Of Big Data, Management On Business. This template is free to edit as deemed fit for your organization. Therefore download it now.
-
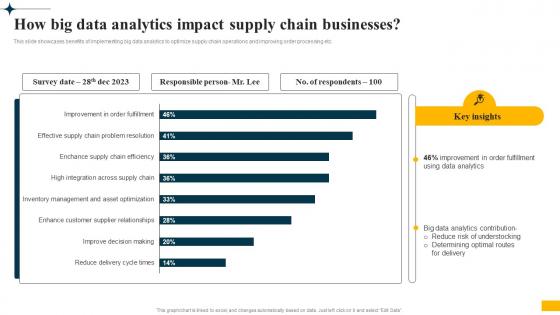 Implementing Big Data Analytics How Big Data Analytics Impact Supply Chain Businesses CRP DK SS
This slide showcases benefits of implementing big data analytics to optimize supply chain operations and improving order processing etc. Deliver an outstanding presentation on the topic using this Implementing Big Data Analytics How Big Data Analytics Impact Supply Chain Businesses CRP DK SS. Dispense information and present a thorough explanation of Big Data Analytics, Supply Chain Operations, Supply Chain Businesses, Reduce Risk Of Understocking using the slides given. This template can be altered and personalized to fit your needs. It is also available for immediate download. So grab it now.
-
 EDR Use Cases For Business Analytics
This slide covers EDR use cases and includes data exfiltration detection, insider threat detection, and incident investigation. Presenting our well structured EDR Use Cases For Business Analytics. The topics discussed in this slide are Data Exfiltration Detection, Insider Threat Detection, Incident Investigation, Business Analytics. This is an instantly available PowerPoint presentation that can be edited conveniently. Download it right away and captivate your audience.
-
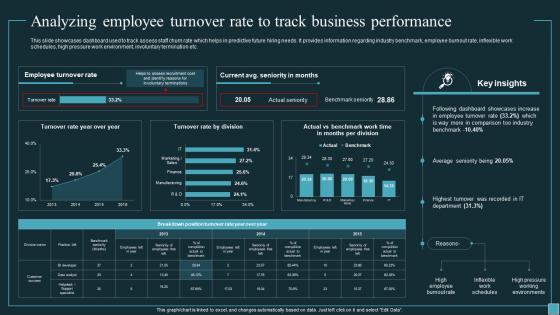 Analyzing Employee Turnover Rate To Track Business Implementing Workforce Analytics Data Analytics SS
This slide showcases dashboard used to track assess staff churn rate which helps in predictive future hiring needs. It provides information regarding industry benchmark, employee burnout rate, inflexible work schedules, high pressure work environment, involuntary termination etc. Present the topic in a bit more detail with this Analyzing Employee Turnover Rate To Track Business Implementing Workforce Analytics Data Analytics SS. Use it as a tool for discussion and navigation on Analyzing Employee Turnover Rate, Track Business Performance, Work Environment, Involuntary Termination. This template is free to edit as deemed fit for your organization. Therefore download it now.
-
 Table Of Contents Implementing Workforce Analytics In Business To Enhance Employee Retention Rates
Increase audience engagement and knowledge by dispensing information using Table Of Contents Implementing Workforce Analytics In Business To Enhance Employee Retention Rates. This template helps you present information on six stages. You can also present information on Workforce Analytics Strategy, Workforce Analytics Techniques, Market Assessment, Trend Analysis using this PPT design. This layout is completely editable so personaize it now to meet your audiences expectations.
-
 Impact Of Big Data Analytics On Retail Business Performance Data Driven Insights Big Data Analytics SS V
This slide showcases key benefits on implementing big data analytics on business performance efficiency. It provides information regarding KPIs such as marketing ROI, resource allocation, operational efficiency and cost management. Deliver an outstanding presentation on the topic using this Impact Of Big Data Analytics On Retail Business Performance Data Driven Insights Big Data Analytics SS V Dispense information and present a thorough explanation of Pre Implementation, Post Implementation, Marketing ROI using the slides given. This template can be altered and personalized to fit your needs. It is also available for immediate download. So grab it now.
-
 Business Model Product Analytics Platform Offering Company Investor Funding Elevator Pitch Deck
This slide shows information about various areas in which company is planning to allocate the funds that will be raised from investors in latest fundraising round. Deliver an outstanding presentation on the topic using this Business Model Product Analytics Platform Offering Company Investor Funding Elevator Pitch Deck Dispense information and present a thorough explanation of Team Expansion, Marketing Initiatives, Product Development using the slides given. This template can be altered and personalized to fit your needs. It is also available for immediate download. So grab it now.
-
 Customer Acquisition Enhancing Business Insights Implementing Product Data Analytics SS V
This slide provides customer data of website ABC aimed at analysing engagement levels. It covers details on visits, pages, churn, bounce rate, device usage, sources of traffic, etc with key insights. Present the topic in a bit more detail with this Customer Acquisition Enhancing Business Insights Implementing Product Data Analytics SS V. Use it as a tool for discussion and navigation on Customer Acquisition, Data Analysis, Ecommerce Website. This template is free to edit as deemed fit for your organization. Therefore download it now.
-
 Global Product Enhancing Business Insights Implementing Product Data Analytics SS V
This slide showcase a graphical representation global product analytics market. It includes present and forecasted values of advanced analytics usage globally with key takeaways on market situation. Present the topic in a bit more detail with this Global Product Enhancing Business Insights Implementing Product Data Analytics SS V. Use it as a tool for discussion and navigation on Key Insights, Global Product Analytics, Reasons. This template is free to edit as deemed fit for your organization. Therefore download it now.
-
 Impact Assessment On Enhancing Business Insights Implementing Product Data Analytics SS V
This slide highlights impact assessment of trend analysis on customer acquisition metrics such as bounce and churn rate. It covers a graph highlighting trend in customer acquisition metrics over four quarters with key insights. Deliver an outstanding presentation on the topic using this Impact Assessment On Enhancing Business Insights Implementing Product Data Analytics SS V. Dispense information and present a thorough explanation of Key Insights, Customer Acquisition, Virtual Assistants using the slides given. This template can be altered and personalized to fit your needs. It is also available for immediate download. So grab it now.
-
 Impact Assessment Enhancing Business Insights Implementing Product Data Analytics SS V
This slide highlights impact of attribution analysis on click through rate aimed at improving effectiveness of call to action button. It covers details on total clicks, impressions, average CTR, position with key insights. Present the topic in a bit more detail with this Impact Assessment Enhancing Business Insights Implementing Product Data Analytics SS V. Use it as a tool for discussion and navigation on Impact Assessment, Click Through Rate. This template is free to edit as deemed fit for your organization. Therefore download it now.
-
 Impact Of Product Analysis Enhancing Business Insights Implementing Product Data Analytics SS V
This slide highlights impact analysis of product analysis on the following product KPIs. It showcases a graph outlining impact on customer acquisition cost, number of active users and churn rate for three successful quarters with key insights. Deliver an outstanding presentation on the topic using this Impact Of Product Analysis Enhancing Business Insights Implementing Product Data Analytics SS V. Dispense information and present a thorough explanation of Key Insights, Customer Acquisition, Churn Rate using the slides given. This template can be altered and personalized to fit your needs. It is also available for immediate download. So grab it now.
-
 Product Analytics Dashboard Enhancing Business Insights Implementing Product Data Analytics SS V
This slide illustrates a dashboard to monitor customer engagement on company website by leveraging product analytics tools aimed at making necessary improvements. It covers insights regarding active monthly users, new users, total completed purchases, screen views, average duration of session, etc. Present the topic in a bit more detail with this Product Analytics Dashboard Enhancing Business Insights Implementing Product Data Analytics SS V. Use it as a tool for discussion and navigation on Product Analytics Dashboard, Track Engagement. This template is free to edit as deemed fit for your organization. Therefore download it now.
-
 Product Analytics Kpi Enhancing Business Insights Implementing Product Data Analytics SS V
This slide illustrates a dashboard to monitor the lead generation on website page using product analytics aimed at making necessary improvements. It covers insights regarding analysis of lead conversions, event retention rate and page views. Deliver an outstanding presentation on the topic using this Product Analytics Kpi Enhancing Business Insights Implementing Product Data Analytics SS V. Dispense information and present a thorough explanation of Product Analytics, KPI Dashboard, Lead Generation using the slides given. This template can be altered and personalized to fit your needs. It is also available for immediate download. So grab it now.
-
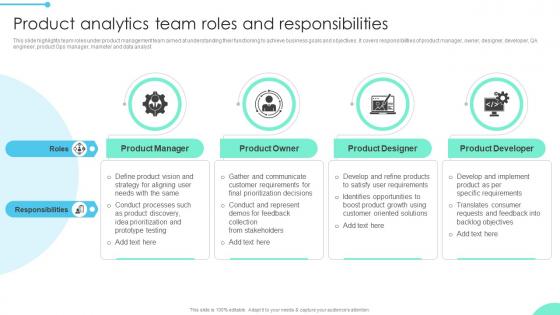 Product Analytics Team Enhancing Business Insights Implementing Product Data Analytics SS V
This slide highlights team roles under product management team aimed at understanding their functioning to achieve business goals and objectives. It covers responsibilities of product manager, owner, designer, developer, QA engineer, product Ops manager, marketer and data analyst. Increase audience engagement and knowledge by dispensing information using Product Analytics Team Enhancing Business Insights Implementing Product Data Analytics SS V. This template helps you present information on four stages. You can also present information on Product Manager, Product Owner, Product Designer using this PPT design. This layout is completely editable so personaize it now to meet your audiences expectations.
-
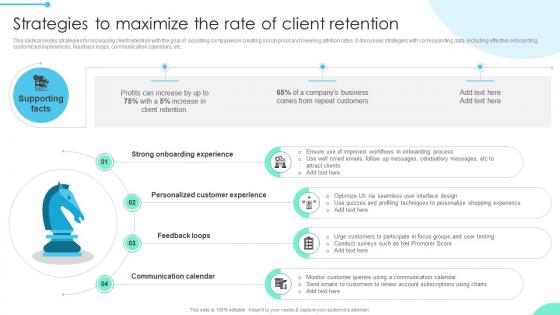 Strategies To Maximize Enhancing Business Insights Implementing Product Data Analytics SS V
This slide provides strategies for increasing client retention with the goal of assisting companies in creating social proof and lowering attrition rates. It discusses strategies with corresponding data, including effective onboarding, customized experiences, feedback loops, communication calendars, etc. Increase audience engagement and knowledge by dispensing information using Strategies To Maximize Enhancing Business Insights Implementing Product Data Analytics SS V. This template helps you present information on four stages. You can also present information on Onboarding Experience, Customer Experience, Feedback Loops using this PPT design. This layout is completely editable so personaize it now to meet your audiences expectations.
-
 Predictive Analytics Methods To Enhance Business Marketing
This slide highlights key methods of predictive analytics which are used in marketing to improve business marketing by predicting future trends. It includes methods such a prediction, segmentation, forecasting etc. Introducing our Predictive Analytics Methods To Enhance Business Marketing set of slides. The topics discussed in these slides are Predication, Association, Segmentation, Forecasting. This is an immediately available PowerPoint presentation that can be conveniently customized. Download it and convince your audience.
-
 Analyzing Company Gross Profit Margin And Order Value Complete Guide To Business Analytics Data Analytics SS
This slide showcases dashboard to evaluate business profit margins which helps in identifying identify revenue streams. It includes elements such as ordered items, average order value, net profit margin, ineffective marketing, competition, pricing, interest rate etc. Deliver an outstanding presentation on the topic using this Analyzing Company Gross Profit Margin And Order Value Complete Guide To Business Analytics Data Analytics SS. Dispense information and present a thorough explanation of Poor Pricing, Increase In Interest Rates, Ineffective Marketing, Ineffective Pricing Strategy, Decrease In Revenue Streams using the slides given. This template can be altered and personalized to fit your needs. It is also available for immediate download. So grab it now.
-
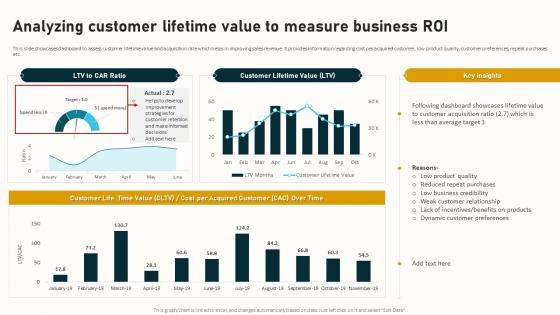 Analyzing Customer Lifetime Value To Measure Complete Guide To Business Analytics Data Analytics SS
This slide showcases dashboard to assess customer lifetime value and acquisition rate which helps in improving sales revenue. It provides information regarding cost per acquired customer, low product quality, customer preferences, repeat purchases etc. Present the topic in a bit more detail with this Analyzing Customer Lifetime Value To Measure Complete Guide To Business Analytics Data Analytics SS. Use it as a tool for discussion and navigation on Analyzing Customer Lifetime, Value To Measure Business, Customer Preferences, Repeat Purchases. This template is free to edit as deemed fit for your organization. Therefore download it now.
-
 Analyzing Customer Repeat Rate To Check Revenue Growth Complete Guide To Business Analytics Data Analytics SS
This slide showcases dashboard for monitoring customer repeat rate which helps in analyzing sales conversion and revenue generation. It includes elements such as customer appreciation, customer service, repeat revenue, customers, lifetime value etc. Deliver an outstanding presentation on the topic using this Analyzing Customer Repeat Rate To Check Revenue Growth Complete Guide To Business Analytics Data Analytics SS. Dispense information and present a thorough explanation of Analyzing Customer Repeat Rate, Check Revenue Growth, Repeat Revenue, Customers using the slides given. This template can be altered and personalized to fit your needs. It is also available for immediate download. So grab it now.
-
 Analyzing Employee Turnover Rate To Check Staffing Levels Complete Guide To Business Analytics Data Analytics SS
This slide showcases dashboard for tracking employee attrition rate which helps in identifying business performance gaps. It provides information regarding KPIs such as average headcount, total departures, annual attrition, total departure cost etc. Present the topic in a bit more detail with this Analyzing Employee Turnover Rate To Check Staffing Levels Complete Guide To Business Analytics Data Analytics SS. Use it as a tool for discussion and navigation on Analyzing Employee Turnover Rate, Total Departures, Annual Attrition, Total Departure Cost. This template is free to edit as deemed fit for your organization. Therefore download it now.
-
 Dashboard To Monitor Employee Performance Complete Guide To Business Analytics Data Analytics SS
This slide showcases dashboard for tracking employee performance at workplace which helps in improving business revenue. It provides information regarding KPIs such as employee productivity, overall labor effectiveness, top employees by attendance, work done, project achievements etc. Deliver an outstanding presentation on the topic using this Dashboard To Monitor Employee Performance Complete Guide To Business Analytics Data Analytics SS. Dispense information and present a thorough explanation of Dashboard To Monitor Employee, Performance Post, Strategy Implementation using the slides given. This template can be altered and personalized to fit your needs. It is also available for immediate download. So grab it now.
-
 Dashboard To Track Business Financial Performance Complete Guide To Business Analytics Data Analytics SS
This slide showcases dashboard illustrating company financial performance which helps in analyzing revenue growth and identifying gaps. It provide information regarding KPIs such as gross profit margin, opex ratio, earning before interest and taxes, vendor payment error rate etc. Present the topic in a bit more detail with this Dashboard To Track Business Financial Performance Complete Guide To Business Analytics Data Analytics SS. Use it as a tool for discussion and navigation on Dashboard To Track Business, Financial Performance, Post Strategy Implementation. This template is free to edit as deemed fit for your organization. Therefore download it now.
-
 Global Business Analytics Market Size Overview Complete Guide To Business Analytics Data Analytics SS
This slide highlights global business analytics market overview which helps in making informed investment decisions. It provides information regarding annual growth rate, key market drivers, major business players and market segmentation. Present the topic in a bit more detail with this Global Business Analytics Market Size Overview Complete Guide To Business Analytics Data Analytics SS. Use it as a tool for discussion and navigation on Global Business Analytics, Market Size Overview, Market Segmentation. This template is free to edit as deemed fit for your organization. Therefore download it now.
-
 Key Statistics Associated With Business Analytics Complete Guide To Business Analytics Data Analytics SS
This slide showcases various teams involved in utilizing business analytics to improve business operations and optimize performance. It provides information regarding sales teams, human resource, finance and senior executives. Deliver an outstanding presentation on the topic using this Key Statistics Associated With Business Analytics Complete Guide To Business Analytics Data Analytics SS. Dispense information and present a thorough explanation of Key Statistics Associated, Business Analytics Market, Data Analytics Influences, Business Operations using the slides given. This template can be altered and personalized to fit your needs. It is also available for immediate download. So grab it now.
-
 Monitoring Inventory Turnover To Check Stock Levels Complete Guide To Business Analytics Data Analytics SS
This slide provides dashboard for tracking inventory or levels which helps in analyzing product demand based on customer needs. It includes elements such as insufficient stocking, bulk orders, lost sales, poor stock management etc. Deliver an outstanding presentation on the topic using this Monitoring Inventory Turnover To Check Stock Levels Complete Guide To Business Analytics Data Analytics SS. Dispense information and present a thorough explanation of Monitoring Inventory Turnover, Insufficient Stocking, Multiple Bulk Orders using the slides given. This template can be altered and personalized to fit your needs. It is also available for immediate download. So grab it now.
-
 Monitoring Staff Absenteeism Rate To Assess Complete Guide To Business Analytics Data Analytics SS
This slide showcases dashboard for analyzing employee absenteeism rate which helps in identifying reasons for high number of leaves. It provides information regarding absenteeism rate, average days on leave by business unit, total leave days, average leave costs , annual leaves balance etc. Present the topic in a bit more detail with this Monitoring Staff Absenteeism Rate To Assess Complete Guide To Business Analytics Data Analytics SS. Use it as a tool for discussion and navigation on Monitoring Staff Absenteeism Rate, Assess Performance Gaps, Work Related Stress, Workplace Harassment. This template is free to edit as deemed fit for your organization. Therefore download it now.
-
 Sales Performance Tracking Dashboard Post Strateg Complete Guide To Business Analytics Data Analytics SS
This slide showcases dashboard for monitoring sales department performance post implementing improvement strategies based on data insights. It provides information regarding revenue generated, current sales pipeline value, sales opportunities, new deals, sales growth by market segment etc. Deliver an outstanding presentation on the topic using this Sales Performance Tracking Dashboard Post Strateg Complete Guide To Business Analytics Data Analytics SS. Dispense information and present a thorough explanation of Sales Performance Tracking, Dashboard Post, Strategy Implementation, Sales Opportunities using the slides given. This template can be altered and personalized to fit your needs. It is also available for immediate download. So grab it now.
-
 Trend 1 Rise In Adoption Of Advanced Analytics Tools Complete Guide To Business Analytics Data Analytics SS
This slide showcases emerging trend of adoption of advanced analytics which helps in real time data processing. It includes elements such as market size, data mining, neural networks, business operations etc. Deliver an outstanding presentation on the topic using this Trend 1 Rise In Adoption Of Advanced Analytics Tools Complete Guide To Business Analytics Data Analytics SS. Dispense information and present a thorough explanation of Rise In Adoption, Advanced Analytics Tools, Market Size, Data Mining, Neural Networks using the slides given. This template can be altered and personalized to fit your needs. It is also available for immediate download. So grab it now.
-
 Trend 2 Rise In Demand For Erp Software Integration Complete Guide To Business Analytics Data Analytics SS
This slide highlights increasing trend of integrating ERP software with other business systems which helps in real time data processing. It provides information regarding market size, streamlining processes, process digitalization, growth rate etc. Deliver an outstanding presentation on the topic using this Trend 2 Rise In Demand For Erp Software Integration Complete Guide To Business Analytics Data Analytics SS. Dispense information and present a thorough explanation of Rise In Demand, Software Integration, Streamlining Processes, Process Digitalization, Growth Rate using the slides given. This template can be altered and personalized to fit your needs. It is also available for immediate download. So grab it now.
-
 Trend 3 Increase In Demand For Cloud Based Complete Guide To Business Analytics Data Analytics SS
This slide showcases rise in usage of cloud based analytics in business which helps in effective data migration and workload management. It provides information regarding market value, expected growth, cloud computing, data enhancement, multi cloud environment, data quality management etc. Present the topic in a bit more detail with this Trend 3 Increase In Demand For Cloud Based Complete Guide To Business Analytics Data Analytics SS. Use it as a tool for discussion and navigation on Increase In Demand, Cloud Based Analytics, Data Enhancement, Multi Cloud Environment. This template is free to edit as deemed fit for your organization. Therefore download it now.
-
 Why Insurance Businesses Require Data Analytics Navigating The Future Of Insurance Data Analytics SS
This slide provides a graph highlighting adoption of data analytics by insurers with the aim of streamlining operations along with key insights and potential impact. Present the topic in a bit more detail with this Why Insurance Businesses Require Data Analytics Navigating The Future Of Insurance Data Analytics SS. Use it as a tool for discussion and navigation on Claims Processing Time, Mainstream Adoption Stage, Data Analytics. This template is free to edit as deemed fit for your organization. Therefore download it now.
-
 Analyzing Business Reach On Various Social Leveraging Digital Analytics To Develop Data Analytics SS
This slide showcases assessment of business reach on Facebook and Instagram channels which helps in tracking customer engagement and brand awareness. It provides information regarding profit visits, reach, lack of connection, marketing campaign, active users etc. Present the topic in a bit more detail with this Analyzing Business Reach On Various Social Leveraging Digital Analytics To Develop Data Analytics SS. Use it as a tool for discussion and navigation on Instagram Profile Visits, Page And Profile Visits, Instagram Reach. This template is free to edit as deemed fit for your organization. Therefore download it now.
-
 Analyzing Customer Bounce Rate For Business Leveraging Digital Analytics To Develop Data Analytics SS
This slide showcases dashboard used to track visitor bounce rate on website which helps in identifying non profitable traffic sources. It provides information regarding KPI metrics such as channels, sessions, new users, bounce rate, pageviews, average session duration etc. Present the topic in a bit more detail with this Analyzing Customer Bounce Rate For Business Leveraging Digital Analytics To Develop Data Analytics SS. Use it as a tool for discussion and navigation on Analyzing Customer Bounce Rate, Business Website. This template is free to edit as deemed fit for your organization. Therefore download it now.
-
 Impact Of Driving Business Insights Using Leveraging Digital Analytics To Develop Data Analytics SS
This slide showcases benefits of informed decision making using digital analytics tools which helps in enhancing business performance. It provides information regarding marketing ROI, customer retention, conversion rates, data security and engagement rates and key takeaways. Present the topic in a bit more detail with this Impact Of Driving Business Insights Using Leveraging Digital Analytics To Develop Data Analytics SS. Use it as a tool for discussion and navigation on Pre Implementation, Post Implementation, Data Security, Engagement Rates. This template is free to edit as deemed fit for your organization. Therefore download it now.
-
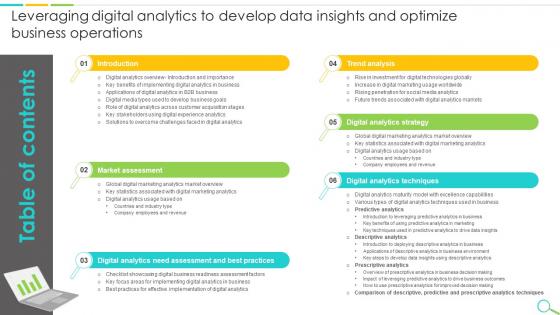 Table Of Contents Leveraging Digital Analytics To Develop Data Insights And Optimize Business Operations
Increase audience engagement and knowledge by dispensing information using Table Of Contents Leveraging Digital Analytics To Develop Data Insights And Optimize Business Operations. This template helps you present information on six stages. You can also present information on Market Assessment, Digital Analytics Strategy, Trend Analysis, Digital Analytics Techniques using this PPT design. This layout is completely editable so personaize it now to meet your audiences expectations.
-
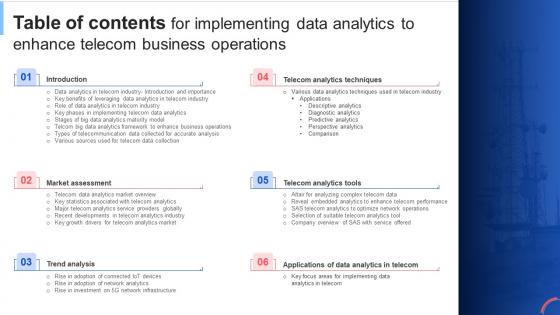 Table Of Contents For Implementing Data Analytics To Enhance Telecom Business Operations Data Analytics SS
Increase audience engagement and knowledge by dispensing information using Table Of Contents For Implementing Data Analytics To Enhance Telecom Business Operations Data Analytics SS. This template helps you present information on six stages. You can also present information on Telecom Analytics Techniques, Telecom Analytics Tools, Applications Of Data Analytics In Telecom using this PPT design. This layout is completely editable so personaize it now to meet your audiences expectations.
-
 Developing Freemium Business Churn Analytics Dashboard For Performance Evaluation
This slide presents churn analytics dashboard highlighting key segments of churn rate evaluation, helpful in making necessary strategic changes in plan and features. It includes churn by product, churn by country, credit scores to churn, churn by age, etc. Present the topic in a bit more detail with this Developing Freemium Business Churn Analytics Dashboard For Performance Evaluation. Use it as a tool for discussion and navigation on Churn Vs No Churn, Salary To Churn, Tenure To Churn, Balance To Churn. This template is free to edit as deemed fit for your organization. Therefore download it now.
-
 Competency Center Business Skills Analytic Skills Technical Backlog Cyclic Deployment
This PPT deck displays ten slides with in depth research. Our topic oriented Competency Center Business Skills Analytic Skills Technical Backlog Cyclic Deployment presentation deck is a helpful tool to plan, prepare, document and analyse the topic with a clear approach. We provide a ready to use deck with all sorts of relevant topics subtopics templates, charts and graphs, overviews, analysis templates. Outline all the important aspects without any hassle. It showcases of all kind of editable templates infographs for an inclusive and comprehensive Competency Center Business Skills Analytic Skills Technical Backlog Cyclic Deployment presentation. Professionals, managers, individual and team involved in any company organization from any field can use them as per requirement.
-
 Real Time Icon Business Analytics Dashboard Processing Operation Monitoring Location
It has PPT slides covering wide range of topics showcasing all the core areas of your business needs. This complete deck focuses on Real Time Icon Business Analytics Dashboard Processing Operation Monitoring Location and consists of professionally designed templates with suitable graphics and appropriate content. This deck has total of ten slides. Our designers have created customizable templates for your convenience. You can make the required changes in the templates like colour, text and font size. Other than this, content can be added or deleted from the slide as per the requirement. Get access to this professionally designed complete deck PPT presentation by clicking the download button below.
-
 Service business analytics ppt powerpoint presentation slides ideas cpb
Presenting our Service Business Analytics Ppt Powerpoint Presentation Slides Ideas Cpb PowerPoint template design. This PowerPoint slide showcases five stages. It is useful to share insightful information on Service Business Analytics This PPT slide can be easily accessed in standard screen and widescreen aspect ratios. It is also available in various formats like PDF, PNG, and JPG. Not only this, the PowerPoint slideshow is completely editable and you can effortlessly modify the font size, font type, and shapes according to your wish. Our PPT layout is compatible with Google Slides as well, so download and edit it as per your knowledge.
-
 Business Analytics Average In Powerpoint And Google Slides Cpb
Presenting our Business Analytics Average In Powerpoint And Google Slides Cpb PowerPoint template design. This PowerPoint slide showcases three stages. It is useful to share insightful information on Business Analytics Average This PPT slide can be easily accessed in standard screen and widescreen aspect ratios. It is also available in various formats like PDF, PNG, and JPG. Not only this, the PowerPoint slideshow is completely editable and you can effortlessly modify the font size, font type, and shapes according to your wish. Our PPT layout is compatible with Google Slides as well, so download and edit it as per your knowledge.
-
 Advanced Data Analytics Checklist For Improving Business Research
This slide highlights the important checklist points to be considered during the advanced data analytics process. The purpose of this template is to help the researcher determine the preparedness of the data set and research team before conducting analysis. It includes evaluation of certain points such as identification of project goal, qualities of the data set, and models to be used.Introducing our Advanced Data Analytics Checklist For Improving Business Research set of slides. The topics discussed in these slides are Business Understanding, Data Understanding, Data Modeling . This is an immediately available PowerPoint presentation that can be conveniently customized. Download it and convince your audience.
-
 Advanced Data Analytics Kpis To Measure Business Growth
This slide highlights the major advanced data analytics KPIs to measure business growth. The purpose of this template is to determine the efficiency of the data analytics team and help improve deficiencies through the adoption of appropriate strategies.Introducing our Advanced Data Analytics Kpis To Measure Business Growth set of slides. The topics discussed in these slides are Improvement Methods, Generated Month, Result Generation. This is an immediately available PowerPoint presentation that can be conveniently customized. Download it and convince your audience.
-
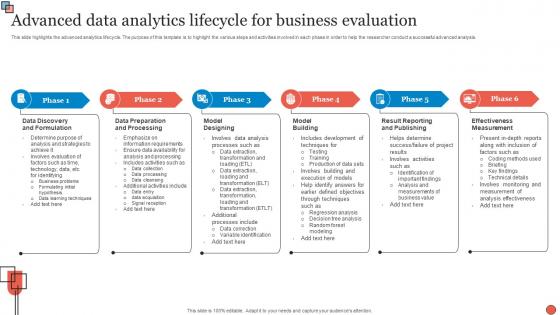 Advanced Data Analytics Lifecycle For Business Evaluation
This slide highlights the advanced analytics lifecycle. The purpose of this template is to highlight the various steps and activities involved in each phase in order to help the researcher conduct a successful advanced analysis.Presenting our well structured Advanced Data Analytics Lifecycle For Business Evaluation. The topics discussed in this slide are Result Reporting, Data Preparation, Data Discovery. This is an instantly available PowerPoint presentation that can be edited conveniently. Download it right away and captivate your audience.
-
 Benefits Of Advanced Data Analytics For Business Growth
This slide highlights the various advantages of integrating advanced data analytics into routine business activities. The purpose of this template is to help business management effectively reduce costs, improve preparedness and facilitate business growth through data analysis.Presenting our well structured Benefits Of Advanced Data Analytics For Business Growth. The topics discussed in this slide are Improved Decision Making, Reduced Business, Increased Business. This is an instantly available PowerPoint presentation that can be edited conveniently. Download it right away and captivate your audience.
-
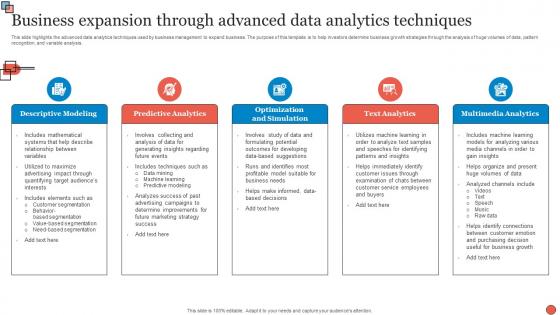 Business Expansion Through Advanced Data Analytics Techniques
This slide highlights the advanced data analytics techniques used by business management to expand business. The purpose of this template is to help investors determine business growth strategies through the analysis of huge volumes of data, pattern recognition, and variable analysis.Introducing our premium set of slides with Business Expansion Through Advanced Data Analytics Techniques. Ellicudate the three stages and present information using this PPT slide. This is a completely adaptable PowerPoint template design that can be used to interpret topics like Descriptive Modeling, Predictive Analytics, Optimization Simulation. So download instantly and tailor it with your information.
-
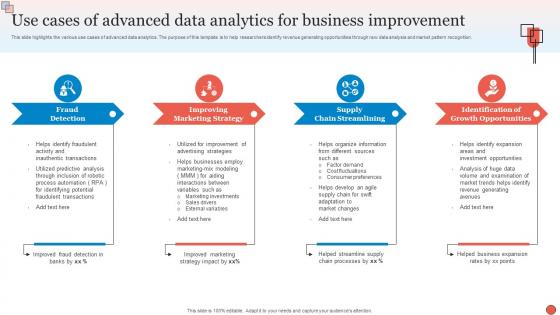 Use Cases Of Advanced Data Analytics For Business Improvement
This slide highlights the various use cases of advanced data analytics. The purpose of this template is to help researchers identify revenue generating opportunities through raw data analysis and market pattern recognition.Presenting our set of slides with Use Cases Of Advanced Data Analytics For Business Improvement. This exhibits information on four stages of the process. This is an easy to edit and innovatively designed PowerPoint template. So download immediately and highlight information on Fraud Detection, Marketing Strategy, Chain Streamlining.
-
 Applications Of CRM Analytics For Business Growth
This slide highlights the various applications of CRM analytics in determining business growth. The purpose of this slide is to help the business managers develop effective strategies in order to help promote business and increase revenue through use of CRM analytics.Introducing our premium set of slides with Applications Of CRM Analytics For Business Growth. Ellicudate the four stages and present information using this PPT slide. This is a completely adaptable PowerPoint template design that can be used to interpret topics like Accurate Customer Data, Customer Service Evaluation, Comprehensive Customer Analytics. So download instantly and tailor it with your information.
-
 CRM Analytics Icon To Determine Effective Business Strategies
Introducing our CRM Analytics Icon To Determine Effective Business Strategies set of slides. The topics discussed in these slides are CRM Analytics Icon, Determine Effective, Business Strategies. This is an immediately available PowerPoint presentation that can be conveniently customized. Download it and convince your audience.
-
 Data Analytics Big Data Business Intelligence Illustration
This colourful PowerPoint icon on Data Analytics is perfect for presentations, reports, and other documents. It features a vibrant blue, green and yellow colour palette and a high-quality design that will bring life to any project. Its the perfect way to illustrate data-driven insights and analytics in a visually appealing way.
-
 Summer Internship Business Analytics In Powerpoint And Google Slides Cpb
Presenting Summer Internship Business Analytics In Powerpoint And Google Slides Cpb slide which is completely adaptable. The graphics in this PowerPoint slide showcase four stages that will help you succinctly convey the information. In addition, you can alternate the color, font size, font type, and shapes of this PPT layout according to your content. This PPT presentation can be accessed with Google Slides and is available in both standard screen and widescreen aspect ratios. It is also a useful set to elucidate topics like Summer Internship Business Analytics. This well-structured design can be downloaded in different formats like PDF, JPG, and PNG. So, without any delay, click on the download button now.
-
 Importance Of Edge Analytics In Business Applications
This slide covers the importance of Edge Analytics in various business applications. The purpose of this template is to highlight the positive impact of edge analytics in terms of time and cost savings, data privacy, reduced latency, and optimized bandwidth usage. It includes examples benefits of implementing edge analytics.Introducing our Importance Of Edge Analytics In Business Applications set of slides. The topics discussed in these slides are Filters Unnecessary, Processing Data, Avoiding Delays. This is an immediately available PowerPoint presentation that can be conveniently customized. Download it and convince your audience.
-
 Analytical Skills Business Consultant In Powerpoint And Google Slides Cpb
Presenting Analytical Skills Business Consultant In Powerpoint And Google Slides Cpb slide which is completely adaptable. The graphics in this PowerPoint slide showcase four stages that will help you succinctly convey the information. In addition, you can alternate the color, font size, font type, and shapes of this PPT layout according to your content. This PPT presentation can be accessed with Google Slides and is available in both standard screen and widescreen aspect ratios. It is also a useful set to elucidate topics like Analytical Skills Business Consultant. This well structured design can be downloaded in different formats like PDF, JPG, and PNG. So, without any delay, click on the download button now.
-
 Big Data Business Analytics In Powerpoint And Google Slides Cpb
Presenting our Big Data Business Analytics In Powerpoint And Google Slides Cpb PowerPoint template design. This PowerPoint slide showcases four stages. It is useful to share insightful information on Big Data Business Analytics This PPT slide can be easily accessed in standard screen and widescreen aspect ratios. It is also available in various formats like PDF, PNG, and JPG. Not only this, the PowerPoint slideshow is completely editable and you can effortlessly modify the font size, font type, and shapes according to your wish. Our PPT layout is compatible with Google Slides as well, so download and edit it as per your knowledge.


