Powerpoint Templates and Google slides for Analytics And Dashboards
Save Your Time and attract your audience with our fully editable PPT Templates and Slides.
-
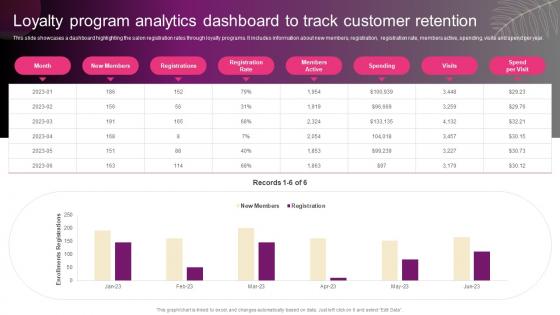 Loyalty Program Analytics Dashboard To Track New Hair And Beauty Salon Marketing Strategy SS
This slide showcases a dashboard highlighting the salon registration rates through loyalty programs. It includes information about new members, registration, registration rate, members active, spending, visits and spend per year. Present the topic in a bit more detail with this Loyalty Program Analytics Dashboard To Track New Hair And Beauty Salon Marketing Strategy SS. Use it as a tool for discussion and navigation on Loyalty Program, Analytics Dashboard, Customer Retention. This template is free to edit as deemed fit for your organization. Therefore download it now.
-
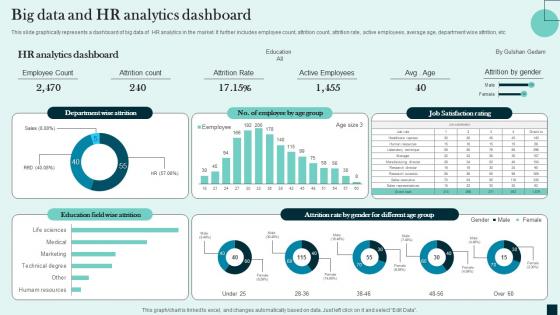 Big Data And HR Analytics Dashboard
This slide graphically represents a dashboard of big data of HR analytics in the market. It further includes employee count, attrition count, attrition rate, active employees, average age, department wise attrition, etc. Presenting our well structured Big Data And HR Analytics Dashboard. The topics discussed in this slide are Data, Analytics, Employee. This is an instantly available PowerPoint presentation that can be edited conveniently. Download it right away and captivate your audience.
-
 KPI Dashboard To Assess M And A Analytics Report Guide Of Business Merger And Acquisition Plan Strategy SS V
This slide covers KPI dashboard to assess MAndA analytics report. It involves key details such as percentage of total number of MAndA, nature of business acquired and digital focused acquisitions. Present the topic in a bit more detail with this KPI Dashboard To Assess M And A Analytics Report Guide Of Business Merger And Acquisition Plan Strategy SS V. Use it as a tool for discussion and navigation on Digital Focused Acquisitions, Nature Of Business Acquired. This template is free to edit as deemed fit for your organization. Therefore download it now.
-
 Metaverse Retail Dashboard For Business Insights And Analytics
This slide showcases dashboard of Metaverse retail for insights. The main purpose of this slide is to provide real time data and insights that are essential for retail business. This includes website traffic, website visitors, bounce rate, etc. Introducing our Metaverse Retail Dashboard For Business Insights And Analytics set of slides. The topics discussed in these slides are Website Traffic, Bounce Rate. This is an immediately available PowerPoint presentation that can be conveniently customized. Download it and convince your audience.
-
 Global Regions Client Data Insights And Analytics Dashboard
This slide shows customer data analytics dashboard that can be used to summarise region wise sales distribution across the globe. It include weekly conversion rate, regional conversion rate and margin ratios, etc.Introducing our Global Regions Client Data Insights And Analytics Dashboard set of slides. The topics discussed in these slides are Regional Conversion, Weekly Conversion, Region Launched. This is an immediately available PowerPoint presentation that can be conveniently customized. Download it and convince your audience.
-
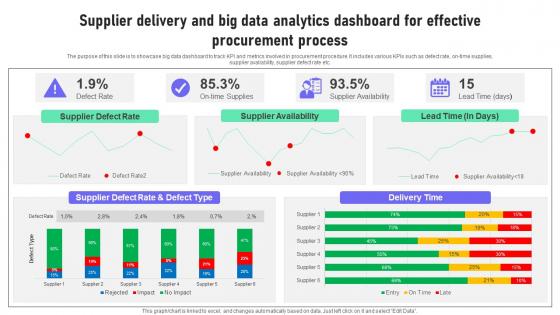 Supplier Delivery And Big Data Analytics Dashboard For Effective Procurement Process
The purpose of this slide is to showcase big data dashboard to track KPI and metrics involved in procurement procedure. It includes various KPIs such as defect rate, on-time supplies, supplier availability, supplier defect rate etc. Presenting our well structured Supplier Delivery And Big Data Analytics Dashboard For Effective Procurement Process. The topics discussed in this slide are Procurement, Process, Dashboard. This is an instantly available PowerPoint presentation that can be edited conveniently. Download it right away and captivate your audience.
-
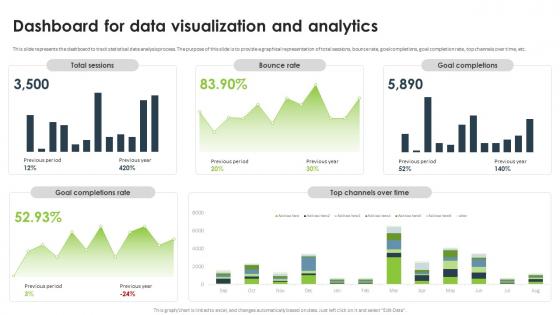 Statistical Analysis For Data Driven Dashboard For Data Visualization And Analytics
This slide represents the dashboard to track statistical data analysis process. The purpose of this slide is to provide a graphical representation of total sessions, bounce rate, goal completions, goal completion rate, top channels over time, etc. Present the topic in a bit more detail with this Statistical Analysis For Data Driven Dashboard For Data Visualization And Analytics. Use it as a tool for discussion and navigation on Data Visualization And Analytics, Bounce Rate, Goal Completions, Goal Completion Rate. This template is free to edit as deemed fit for your organization. Therefore download it now.
-
 Transforming From Traditional Dashboard Analytics Measuring Impact On User Metrics And Revenue DT SS
This slide analyzes the impact od digital business model innovation on user metrics and recurring revenue of business. It tracks KPIs such as monthly recurring revenue, revenue growth, active users, life time value, cost of customer acquisition, churn rate, growth by channel, subscription plan, etc. Present the topic in a bit more detail with this Transforming From Traditional Dashboard Analytics Measuring Impact On User Metrics And Revenue DT SS Use it as a tool for discussion and navigation on Monthly Recurring Revenue, Monthly Revenue Growth, Active Users This template is free to edit as deemed fit for your organization. Therefore download it now.
-
 Social Media Analytics With Tools Dashboards For Social Media Analytics Tracking And Monitoring
This slide depicts the dashboard for Social Media Analytics insights. The purpose of this slide is to highlight insights such as brand awareness, audience growth, post-engagement rate, provider analytics, etc. Present the topic in a bit more detail with this Social Media Analytics With Tools Dashboards For Social Media Analytics Tracking And Monitoring. Use it as a tool for discussion and navigation on Dashboards For Social Media, Analytics Tracking And Monitoring, Brand Awareness, Audience Growth, Post Engagement Rate. This template is free to edit as deemed fit for your organization. Therefore download it now.
-
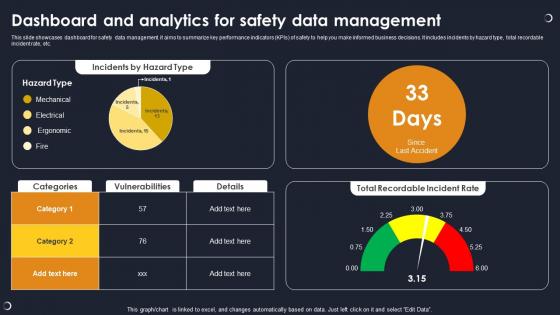 Dashboard And Analytics For Safety Data Management
This slide showcases dashboard for safety data management. it aims to summarize key performance indicators KPIs of safety to help you make informed business decisions. It includes incidents by hazard type, total recordable incident rate, etc. Presenting our well structured Dashboard And Analytics For Safety Data Management. The topics discussed in this slide are Incidents By Hazard Type, Vulnerabilities, Total Recordable Incident Rate. This is an instantly available PowerPoint presentation that can be edited conveniently. Download it right away and captivate your audience.
-
 Dashboard Measuring Key Partner Analytics And Performance Nurturing Relationships
This slide analyzes a dashboard examining various partner pipeline metrics. It tracks KPIs such as, partner opportunity pipeline, leads, demo units, co-brand requests, market development funds requests and budget, new partners, open pipeline, certified partners, e-learnings. Deliver an outstanding presentation on the topic using this Dashboard Measuring Key Partner Analytics And Performance Nurturing Relationships Dispense information and present a thorough explanation of Opportunities, Certified Partners, Performance Indicators using the slides given. This template can be altered and personalized to fit your needs. It is also available for immediate download. So grab it now.
-
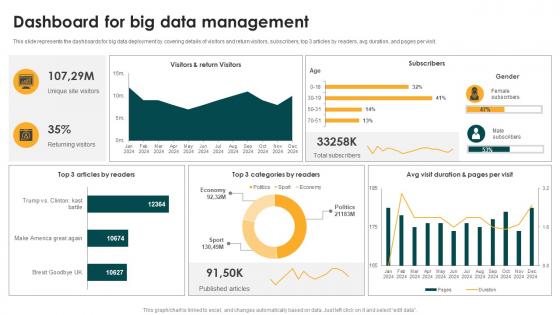 Dashboard For Big Data Management Big Data Analytics And Management
This slide represents the dashboards for big data deployment by covering details of visitors and return visitors, subscribers, top 3 articles by readers, avg duration, and pages per visit. Present the topic in a bit more detail with this Dashboard For Big Data Management Big Data Analytics And Management. Use it as a tool for discussion and navigation on Dashboard For Big Data Management. This template is free to edit as deemed fit for your organization. Therefore download it now.
-
 Dashboard Analytics Measuring Digital Elevating Small And Medium Enterprises Digital Transformation DT SS
This slide presents dashboard that helps in tracking digital vitality score highlighting the success of digital transformation across organization. It tracks KPIs such as strategy, data, organizational alignment and customer experience. Deliver an outstanding presentation on the topic using this Dashboard Analytics Measuring Digital Elevating Small And Medium Enterprises Digital Transformation DT SS. Dispense information and present a thorough explanation of Organizational Alignment, Customer Experience, Dashboard Analytics using the slides given. This template can be altered and personalized to fit your needs. It is also available for immediate download. So grab it now.
-
 Dashboard Analytics Measuring Impact Elevating Small And Medium Enterprises Digital Transformation DT SS
This slide presents an analytics dashboard monitoring the efficiency gained due to integration of RPA in SME. It tracks, money saved, time saved, productivity, money saved per process, etc. Present the topic in a bit more detail with this Dashboard Analytics Measuring Impact Elevating Small And Medium Enterprises Digital Transformation DT SS. Use it as a tool for discussion and navigation on Tax Management, Termination, Travel And Expense. This template is free to edit as deemed fit for your organization. Therefore download it now.
-
 Analytics Dashboard Tracking Effective Energy Monitoring And Enabling Growth Centric DT SS
This slide presents how power companies can utilize analytics-driven insights for monitoring equipment health and performance. It includes predictive analytics, anomaly detection, trend analysis, and prescriptive analytics. Deliver an outstanding presentation on the topic using this Analytics Dashboard Tracking Effective Energy Monitoring And Enabling Growth Centric DT SS Dispense information and present a thorough explanation of Solar Energy, Carbon Savings, Financial Savings using the slides given. This template can be altered and personalized to fit your needs. It is also available for immediate download. So grab it now.
-
 Fulfillment Center Optimization Warehouse Fleet And Transportation Performance Analytics Dashboard
This slide represents a warehouse fleet and transportation management dashboard to visualize and optimize logistics operations through advanced data analyses. It monitors KPIs such as fleet status, delivery status, deliveries by location, average delivery time hours0 And route Km, loading time And weight, and profit by location. Deliver an outstanding presentation on the topic using this Fulfillment Center Optimization Warehouse Fleet And Transportation Performance Analytics Dashboard Dispense information and present a thorough explanation of Course Topics, Course Duration, Course Description using the slides given. This template can be altered and personalized to fit your needs. It is also available for immediate download. So grab it now.
-
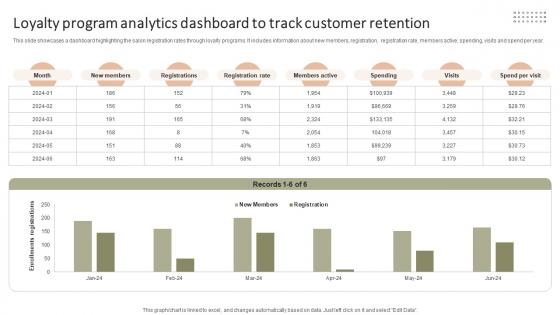 Loyalty Program Analytics Dashboard To Improving Client Experience And Sales Strategy SS V
This slide showcases a dashboard highlighting the salon registration rates through loyalty programs. It includes information about new members, registration, registration rate, members active, spending, visits and spend per year. Present the topic in a bit more detail with this Loyalty Program Analytics Dashboard To Improving Client Experience And Sales Strategy SS V. Use it as a tool for discussion and navigation on Registration Rate, Members Active, Registrations. This template is free to edit as deemed fit for your organization. Therefore download it now.
-
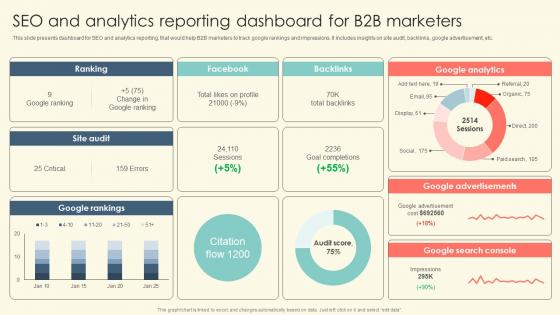 Seo And Analytics Reporting Dashboard For B2B Marketers B2B Online Marketing Strategies
This slide presents dashboard for SEO and analytics reporting, that would help B2B marketers to track google rankings and impressions. It includes insights on site audit, backlinks, google advertisement, etc. Deliver an outstanding presentation on the topic using this Seo And Analytics Reporting Dashboard For B2B Marketers B2B Online Marketing Strategies Dispense information and present a thorough explanation of Google Analytics, Google Advertisements, B2b Marketers using the slides given. This template can be altered and personalized to fit your needs. It is also available for immediate download. So grab it now.
-
 Healthcare Analytics Dashboard Using Iot Role Of Iot And Technology In Healthcare Industry IoT SS V
Following slide exhibits dashboard that provides health care data after deployment of internet of things IoT technology. It includes indicators such as patient satisfaction, total patients, average waiting time etc. Deliver an outstanding presentation on the topic using this Healthcare Analytics Dashboard Using Iot Role Of Iot And Technology In Healthcare Industry IoT SS V. Dispense information and present a thorough explanation of Healthcare, Analytics, Dashboard using the slides given. This template can be altered and personalized to fit your needs. It is also available for immediate download. So grab it now.
-
 Website Analytics Dashboard To Monitor Improving Client Experience And Sales Strategy SS V
This slide represent a website analytics dashboard tracking online traffic and appointments. It includes KPIs such as visitors count, purchasers count, booked appointments, forecasted booking count by month, visitor-to-customer conversion trend, customer acquisition through channels and visitors count by categories reviews on website. Deliver an outstanding presentation on the topic using this Website Analytics Dashboard To Monitor Improving Client Experience And Sales Strategy SS V. Dispense information and present a thorough explanation of Forecast Booking Count By Month, Customer Acquisition Through, Visitors Count By Categories using the slides given. This template can be altered and personalized to fit your needs. It is also available for immediate download. So grab it now.
-
 Lost Sale And Stockout Analytical Dashboard
This slide demonstrates the dashboard to measure the percent of stockout and its impact on the business. Various KPIs included are a percentage of stockout, lost revenue, stockout accountability, and stockout trends based on lost sales. Introducing our Lost Sale And Stockout Analytical Dashboard set of slides. The topics discussed in these slides are Percent Stockout, Stock Out Accountability, Lost Revenue. This is an immediately available PowerPoint presentation that can be conveniently customized. Download it and convince your audience.
-
 Team Trainings And Skills Analytics Dashboard
The purpose of this slide is to showcase a dashboard for team training and skills analytics enabling data driven decisions and performance enhancement. Introducing our Team Trainings And Skills Analytics Dashboard set of slides. The topics discussed in these slides are Training Mode, Training Source, Skill Imparted. This is an immediately available PowerPoint presentation that can be conveniently customized. Download it and convince your audience.
-
 Overview gym health and fitness clubs industry analytics dashboard for gym health and fitness clubs
This slide covers the Key performance indicators for analysing social media platforms, email campaigns and website performance Increase audience engagement and knowledge by dispensing information using Overview Gym Health And Fitness Clubs Industry Analytics Dashboard For Gym Health And Fitness Clubs. This template helps you present information on seven stages. You can also present information on Analytics, Dashboard, Performance using this PPT design. This layout is completely editable so personaize it now to meet your audiences expectations.
-
 Client Data Insights And Analytics Dashboard Icon
Introducing our Client Data Insights And Analytics Dashboard Icon set of slides. The topics discussed in these slides are Customer Analytics, Data Dashboard Icon. This is an immediately available PowerPoint presentation that can be conveniently customized. Download it and convince your audience.
-
 Role of digital twin and iot healthcare dashboard snapshot showing analytical data
This slide shows the healthcare dashboard that presents analytical data such as occupancy, patient turnover, efficiency and costs, satisfaction and service indicators. Deliver an outstanding presentation on the topic using this Role Of Digital Twin And Iot Healthcare Dashboard Snapshot Showing Analytical Data. Dispense information and present a thorough explanation of Healthcare, Dashboard, Analytical using the slides given. This template can be altered and personalized to fit your needs. It is also available for immediate download. So grab it now.
-
 Sap Analytics Cloud Cloud Dashboard For Income Analysis And Forecasting
This slide illustrates the SAP Analytics Cloud dashboard for organization income analysis and forecasting. It provides information regarding multiple incomes such as interest, operating and trading income. It also contains details of operating expenses. Deliver an outstanding presentation on the topic using this Sap Analytics Cloud Cloud Dashboard For Income Analysis And Forecasting. Dispense information and present a thorough explanation of Dashboard, Analytics, Operating Expenses using the slides given. This template can be altered and personalized to fit your needs. It is also available for immediate download. So grab it now.
-
 Social media recruitment trend and analytics dashboard
Introducing our Social Media Recruitment Trend And Analytics Dashboard set of slides. The topics discussed in these slides are Social Media Recruitment Trend And Analytics Dashboard. This is an immediately available PowerPoint presentation that can be conveniently customized. Download it and convince your audience.
-
 Strategic Planning For Industrial Marketing Manufacturing Analytics And Reporting Dashboard
This slide covers the manufacturing analytics and reporting dashboard which focuses on monthly inventory, priority orders, inventory holding costs, market share, turnover trend, etc. Deliver an outstanding presentation on the topic using this Strategic Planning For Industrial Marketing Manufacturing Analytics And Reporting Dashboard. Dispense information and present a thorough explanation of Manufacturing, Analytics, Dashboard using the slides given. This template can be altered and personalized to fit your needs. It is also available for immediate download. So grab it now.
-
 Analytics Dashboard For Effective Monitoring And Management Of Customer Attrition
This slide shows KPI dashboard which can be used by an organization to track and manage customer attrition data. It includes status, gender distribution, age and country. Introducing our Analytics Dashboard For Effective Monitoring And Management Of Customer Attrition set of slides. The topics discussed in these slides are Attrition Status, Country Wise Attrition, Attrition By Age. This is an immediately available PowerPoint presentation that can be conveniently customized. Download it and convince your audience.
-
 Website Leads And Revenue Generation Analytics For User Experience Optimization Dashboard
This slide covers website analytics based on revenue earned. It also included leads generated, bounce rates, customer churn stats, annual and monthly recurring revenue, etc. Introducing our Website Leads And Revenue Generation Analytics For User Experience Optimization Dashboard set of slides. The topics discussed in these slides are Website Leads, Revenue Generation Analytics, User Experience Optimization, Dashboard. This is an immediately available PowerPoint presentation that can be conveniently customized. Download it and convince your audience.
-
 Workforce Data Management And Analytics Dashboard Snapshot
This slide covers general workforce data dashboard snapshot. Its includes average employees details, gender, department wise employees count along with tenure and employment type. Introducing our Workforce Data Management And Analytics Dashboard set of slides. The topics discussed in these slides are Workforce Data Management, Analytics Dashboard. This is an immediately available PowerPoint presentation that can be conveniently customized. Download it and convince your audience.
-
 Product Planning Process Dashboard Depicting Sales And Customer Analytics
This slide focuses on dashboard that depicts sales and customer analytics which covers sales revenue, average transaction rate, out of stock items, sales by division, monthly visitors, etc. Present the topic in a bit more detail with this Product Planning Process Dashboard Depicting Sales And Customer Analytics. Use it as a tool for discussion and navigation on Sales Revenue, Total Customers, Stock Items. This template is free to edit as deemed fit for your organization. Therefore download it now.
-
 Leadership Coaching Analytics And Performance Reporting Dashboard
This slide shows leadership coaching analytics and performance reporting dashboard which can be referred by training managers to review their modules along with trainees abilities. It contains information about trainee types, type of training. levels of change management competency and levels of coaching needed. Introducing our Leadership Coaching Analytics And Performance Reporting Dashboard set of slides. The topics discussed in these slides are Leadership Coaching Analytics, Performance Reporting Dashboard. This is an immediately available PowerPoint presentation that can be conveniently customized. Download it and convince your audience.
-
 Dashboard Depicting Sales And Customer Analytics Retail Merchandising Plan
This slide focuses on dashboard that depicts sales and customer analytics which covers sales revenue, average transaction rate, out of stock items, sales by division, monthly visitors, etc. Deliver an outstanding presentation on the topic using this Dashboard Depicting Sales And Customer Analytics Retail Merchandising Plan. Dispense information and present a thorough explanation of Total Customers, Transaction Price, Sales Revenue using the slides given. This template can be altered and personalized to fit your needs. It is also available for immediate download. So grab it now.
-
 Dashboard Procurement Analysis Purchasing Analytics Tools And Techniques
This slide covers the procurement analysis dashboard including KPIs including total invoices, discount savings, etc. Present the topic in a bit more detail with this Dashboard Procurement Analysis Purchasing Analytics Tools And Techniques. Use it as a tool for discussion and navigation on Dashboard Procurement Analysis. This template is free to edit as deemed fit for your organization. Therefore download it now.
-
 Dashboard For Monthly Recruitment Metrics And Analytics
The slide depicts the dashboard for monthly recruitment metrics and analytics depicting monthly recruitment, recruitment by department and source, candidate feedback and offer acceptance rate. Introducing our Dashboard For Monthly Recruitment Metrics And Analytics set of slides. The topics discussed in these slides are Interview Activity, Monthly Recruitment, Offer Acceptance Rate. This is an immediately available PowerPoint presentation that can be conveniently customized. Download it and convince your audience.
-
 Talent Acquisition And Recruitment Analytics Dashboard
The slide highlights the talent acquisition and recruitment analytics dashboard depicting total application, experience, gender diversity, application type, salary preference, employee details and open positions by department. Introducing our Talent Acquisition And Recruitment Analytics Dashboard set of slides. The topics discussed in these slides are Salary Preference, Application Type, Inexperience Candidates. This is an immediately available PowerPoint presentation that can be conveniently customized. Download it and convince your audience.
-
 Process Of Merchandise Planning In Retail Dashboard Depicting Sales And Customer Analytics
This slide focuses on dashboard that depicts sales and customer analytics which covers sales revenue, average transaction rate, out of stock items, sales by division, monthly visitors, etc. Present the topic in a bit more detail with this Process Of Merchandise Planning In Retail Dashboard Depicting Sales And Customer Analytics. Use it as a tool for discussion and navigation on Customers, Transaction Price, Sales Revenue. This template is free to edit as deemed fit for your organization. Therefore download it now.
-
 Dashboard Depicting Sales And Customer Analytics Approaches To Merchandise Planning
This slide focuses on dashboard that depicts sales and customer analytics which covers sales revenue, average transaction rate, out of stock items, sales by division, monthly visitors, etc. Present the topic in a bit more detail with this Dashboard Depicting Sales And Customer Analytics Approaches To Merchandise Planning. Use it as a tool for discussion and navigation on Sales Revenue, Total Customers, Sales Division. This template is free to edit as deemed fit for your organization. Therefore download it now.
-
 Implement Merchandise Improve Sales Dashboard Depicting Sales And Customer Analytics
This slide focuses on dashboard that depicts sales and customer analytics which covers sales revenue, average transaction rate, out of stock items, sales by division, monthly visitors, etc. Present the topic in a bit more detail with this Implement Merchandise Improve Sales Dashboard Depicting Sales And Customer Analytics. Use it as a tool for discussion and navigation on Dashboard, Customer, Analytics. This template is free to edit as deemed fit for your organization. Therefore download it now.
-
 Revenue And Margin Growth Analytics Dashboard
The following slide highlights the revenue and margin growth analytics dashboard illustrating key headings which includes revenue, gross margin, gross margin growth, monthly revenue, monthly gross margin, monthly gross margin growth, gross margin by supplier and gross margin by channel. Presenting our well-structured Revenue And Margin Growth Analytics Dashboard. The topics discussed in this slide are Revenue, Margin Growth Analytics, Dashboard. This is an instantly available PowerPoint presentation that can be edited conveniently. Download it right away and captivate your audience.
-
 IT Performance Management And Analytics Dashboard
This slide covers analytical summary of IT incidents recorded and managed. It includes elements such as average incident re-assignments, average age of open incidents based on priority, basic indicators, etc. Introducing our IT Performance Management And Analytics Dashboard set of slides. The topics discussed in these slides are IT Performance Management, Analytics, Dashboard. This is an immediately available PowerPoint presentation that can be conveniently customized. Download it and convince your audience.
-
 Project Status And Performance Analytics Dashboard
This slide covers project progress and task status along with timeline. It also includes details such project manager, status, budget allocations for different activities, risks involved, pending actions involved and open change requests. Introducing our Project Status And Performance Analytics Dashboard set of slides. The topics discussed in these slides are Analysis, Design, Development, Testing, Implement. This is an immediately available PowerPoint presentation that can be conveniently customized. Download it and convince your audience.
-
 Analytics Process Dashboard With Start Trend And Summary
This slide showcases a dashboard of analytics process to guide organizations upstream root cause and plan actions to avoid issues in future. It covers essential KPIs such as total and active process, average duration, participants, active tasks, errors, trend and summary. Introducing our Analytics Process Dashboard With Start Trend And Summary set of slides. The topics discussed in these slides are Process Status, Total Processes, Active Processes, Average Duration. This is an immediately available PowerPoint presentation that can be conveniently customized. Download it and convince your audience.
-
 SAP Analytics Cloud Dashboard For Income Analysis And Forecasting Business Intelligence Strategy
This slide illustrates the SAP Analytics Cloud dashboard for organization income analysis and forecasting. It provides information regarding multiple incomes such as interest, operating and trading income. It also contains details of operating expenses. Present the topic in a bit more detail with this SAP Analytics Cloud Dashboard For Income Analysis And Forecasting Business Intelligence Strategy. Use it as a tool for discussion and navigation on Interest Income, Operating Income, Trading Income Trend, Operating Expenses. This template is free to edit as deemed fit for your organization. Therefore download it now.
-
 IT Project Operational Analytics And Performance Dashboard
This slide represents the dashboard showing the operational analysis of an IT project. It includes details related to bugs status, planned vs completed work items, work item type by priority, active bugs by severity, sprint velocity and analysis by assignee. Introducing our IT Project Operational Analytics And Performance Dashboard set of slides. The topics discussed in these slides are Work Item Type, Active Bugs Severity, Sprint Velocity. This is an immediately available PowerPoint presentation that can be conveniently customized. Download it and convince your audience.
-
 Business Revenue And Customer Retention Analytics Dashboard
This slide shows dashboard of service department of firm to make business decisions using customer analytics and covers essential KPIs of customer. It includes request answered, revenue, support cost, customer satisfaction and retention, average time to solve issue. Introducing our Business Revenue And Customer Retention Analytics Dashboard set of slides. The topics discussed in these slides are Revenue, Support Cost, Customer Satisfaction. This is an immediately available PowerPoint presentation that can be conveniently customized. Download it and convince your audience.
-
 Dashboard Depicting Customer Retention Analytics Prevent Customer Attrition And Build
This slide shows the dashboard that depicts customer retention analytics which includes net promoter score, customer loyalty rate, customer lifetime value, customer and revenue churn, monthly recurring revenue growth, etc. Present the topic in a bit more detail with this Dashboard Depicting Customer Retention Analytics Prevent Customer Attrition And Build. Use it as a tool for discussion and navigation on Dashboard, Depicting Customer, Retention Analytics. This template is free to edit as deemed fit for your organization. Therefore download it now.
-
 User Feedback Management And Analytics Dashboard
This slide covers summary report on feedbacks provided by users. It includes analytics based on monthly feedbacks, positive and negative feedbacks, etc. for effective user experience. Presenting our well structured User Feedback Management And Analytics Dashboard. The topics discussed in this slide are Current Feedbacks, Monthly Feedbacks, Top Features. This is an instantly available PowerPoint presentation that can be edited conveniently. Download it right away and captivate your audience.
-
 Hr Analytics Diversity Dashboard Of Enterprise Analyzing And Implementing HR Analytics In Enterprise
This slide shows the key performance metrics dashboard showing data related to HR operations of an organization. It shows key metrics such as gender diversity by business unit, headcount by seniority and age banding etc. Present the topic in a bit more detail with this Hr Analytics Diversity Dashboard Of Enterprise Analyzing And Implementing HR Analytics In Enterprise. Use it as a tool for discussion and navigation on Analytics Diversity, Dashboard Of Enterprise, Business Unit. This template is free to edit as deemed fit for your organization. Therefore download it now.
-
 Hr Analytics Software KPI Dashboard Analyzing And Implementing HR Analytics In Enterprise
This slide shows the dashboard representing data related to human resource operations of the enterprise. It includes key metrics such as vacant positions, YTD personal expenses etc. Deliver an outstanding presentation on the topic using this Hr Analytics Software KPI Dashboard Analyzing And Implementing HR Analytics In Enterprise. Dispense information and present a thorough explanation of Analytics Software, KPI Dashboard using the slides given. This template can be altered and personalized to fit your needs. It is also available for immediate download. So grab it now.
-
 Website Analytics Dashboard For Consumer Data Insights Collecting And Analyzing Customer Data
This slide showcases dashboard for website analytics that can help organization to gather data about visitors and formulate targeted marketing campaigns. It can also help to make individual and group buyer personas. Present the topic in a bit more detail with this Website Analytics Dashboard For Consumer Data Insights Collecting And Analyzing Customer Data. Use it as a tool for discussion and navigation on Social Networks, Devices, Demographics. This template is free to edit as deemed fit for your organization. Therefore download it now.
-
 K35 SAP Analytics Cloud Dashboard For Income Analysis And Forecasting Action Plan For Implementing BI
This slide illustrates the SAP Analytics Cloud dashboard for organization income analysis and forecasting. It provides information regarding multiple incomes such as interest, operating and trading income. It also contains details of operating expenses. Present the topic in a bit more detail with this K35 SAP Analytics Cloud Dashboard For Income Analysis And Forecasting Action Plan For Implementing BI. Use it as a tool for discussion and navigation on Trading Income, Operating Expense, Operating Income, Analysis And Forecasting. This template is free to edit as deemed fit for your organization. Therefore download it now.
-
 BI And Web Analytics Dashboard To Track Marketing KPIS
In this business intelligence dashboard is displayed to help company in real time monitoring and reporting of relevant details. It includes KPIs such as visits, average session duration, bounce rate, page views, traffic sources, etc. Introducing our BI And Web Analytics Dashboard To Track Marketing KPIS set of slides. The topics discussed in these slides are User Type, Channels By Conversion, Campaigns By Conversion. This is an immediately available PowerPoint presentation that can be conveniently customized. Download it and convince your audience.
-
 Procurement Data Analytics And Business Intelligence Dashboard
This slide showcases BI dashboard to help company in real time tracking of procurement KPIs. It includes information such as defect rate, supplier availability, lead time, etc. Introducing our Procurement Data Analytics And Business Intelligence Dashboard set of slides. The topics discussed in these slides are Supplier Defect Rate, Supplier Availability, Lead Time. This is an immediately available PowerPoint presentation that can be conveniently customized. Download it and convince your audience.
-
 Contact Center Reporting And Analytics Metrics Dashboard
This slide covers contact center reporting and analytics metrics dashboard. It involves metrics such as total unsuccessful calls, competence, activity, agent details and quality rate. Introducing our Contact Center Reporting And Analytics Metrics Dashboard set of slides. The topics discussed in these slides are Unsuccessful Inbound, Talk Time Brackets, Answer Time Brackets This is an immediately available PowerPoint presentation that can be conveniently customized. Download it and convince your audience.
-
 Elearning And Development Course Analytics Dashboard
This slide provides glimpse about facts and figures related to progress status of a L and D course taken by an employee of a business corporation. It includes overall engagement, points score, risk score, etc.Introducing our Elearning And Development Course Analytics Dashboard set of slides. The topics discussed in these slides are Overall Engagement, Syllabus Status, Overall Activity. This is an immediately available PowerPoint presentation that can be conveniently customized. Download it and convince your audience.
-
 Website Analytics Dashboard To Monitor Appointments Hair And Beauty Salon Marketing Strategy SS
This slide represent a website analytics dashboard tracking online traffic and appointments. It includes KPIs such as visitors count, purchasers count, booked appointments, forecasted booking count by month, visitor to customer conversion trend, customer acquisition through channels and visitors count by categories. Present the topic in a bit more detail with this Website Analytics Dashboard To Monitor Appointments Hair And Beauty Salon Marketing Strategy SS. Use it as a tool for discussion and navigation on Visitors Count, Purchasers Count, Booked Appointment. This template is free to edit as deemed fit for your organization. Therefore download it now.
-
 Social Media Analytics Dashboard Goviral Social Media Campaigns And Posts For Maximum Engagement
This slides showcases social media analytics dashboard to track viral keywords. It provides details about daily volume, keyword searches, keyword volume, etc. which can effectively guide digital marketers to craft potential campaigns Present the topic in a bit more detail with this Social Media Analytics Dashboard Goviral Social Media Campaigns And Posts For Maximum Engagement. Use it as a tool for discussion and navigation on Analytics, Dashboard, Potential. This template is free to edit as deemed fit for your organization. Therefore download it now.
-
 Financial comparison business chart analytics and dashboard
Presenting this set of slides with name - Financial Comparison Business Chart Analytics And Dashboard. This is a one stage process. The stages in this process are Financial Comparison, Financial Analysis, Financial Statement.


