Powerpoint Templates and Google slides for Analytical.
Save Your Time and attract your audience with our fully editable PPT Templates and Slides.
-
 Mobile analytics showing crm and target icon
Presenting this set of slides with name - Mobile Analytics Showing Crm And Target Icon. This is a three stage process. The stages in this process are Mobile Analytics, Mobile Tracking, Mobile Web Analytics.
-
 Mobile analytics showing magnifying glass and pie chart
Presenting this set of slides with name - Mobile Analytics Showing Magnifying Glass And Pie Chart. This is a four stage process. The stages in this process are Mobile Analytics, Mobile Tracking, Mobile Web Analytics.
-
 Mobile analytics showing social statistics and magnifying glass
Presenting this set of slides with name - Mobile Analytics Showing Social Statistics And Magnifying Glass. This is a three stage process. The stages in this process are Mobile Analytics, Mobile Tracking, Mobile Web Analytics.
-
 Mobile analytics showing target globe and bar graph
Presenting this set of slides with name - Mobile Analytics Showing Target Globe And Bar Graph. This is a seven stage process. The stages in this process are Mobile Analytics, Mobile Tracking, Mobile Web Analytics.
-
 Stock market showing advisory news and analytics
Presenting this set of slides with name - Stock Market Showing Advisory News And Analytics. This is a three stage process. The stages in this process are Bull Market, Financial Market, Stock Market.
-
 Customer insight defines data external analytics
Presenting this set of slides with name - Customer Insight Defines Data External Analytics. This is a two stage process. The stages in this process are Customer Insight, Consumer Insight, Customer Experience.
-
 Customer insight showing market intelligence analytics research information
Presenting this set of slides with name - Customer Insight Showing Market Intelligence Analytics Research Information. This is a four stage process. The stages in this process are Customer Insight, Consumer Insight, Customer Experience.
-
 Data warehousing operational analytical environment
Presenting this set of slides with name - Data Warehousing Operational Analytical Environment. This is a two stage process. The stages in this process are Etl, Extract, Transform And Load, Data Warehousing.
-
 Data warehousing reporting analytics data mining
Presenting this set of slides with name - Data Warehousing Reporting Analytics Data Mining. This is a two stage process. The stages in this process are Etl, Extract, Transform And Load, Data Warehousing.
-
 Predictive model include different statistical technique of analytics
Presenting this set of slides with name - Predictive Model Include Different Statistical Technique Of Analytics. This is a nine stage process. The stages in this process are Predictive Model, Predictive Framework, Predictive Structure.
-
 Predictive model of analytics showing variety of statistical techniques and other approaches
Presenting this set of slides with name - Predictive Model Of Analytics Showing Variety Of Statistical Techniques And Other Approaches. This is a four stage process. The stages in this process are Predictive Model, Predictive Framework, Predictive Structure.
-
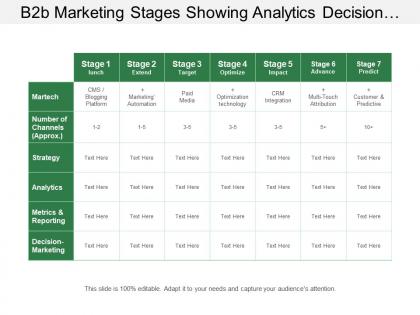 B2b marketing stages showing analytics decision making metrics and reporting
Presenting this set of slides with name - B2b Marketing Stages Showing Analytics Decision Making Metrics And Reporting. This is a seven stage process. The stages in this process are B2b Marketing Strategy, B2b Marketing Plan, B2b Marketing Approach.
-
 Capabilities with insight analytics platforms and activations
Presenting this set of slides with name - Capabilities With Insight Analytics Platforms And Activations. This is a four stage process. The stages in this process are Capabilities, Potential, Ability.
-
 B2b marketing showing number of channels analytics
Presenting this set of slides with name - B2b Marketing Showing Number Of Channels Analytics. This is a seven stage process. The stages in this process are B2b Marketing Strategy, Business 2 Business Marketing Plan, B2B Commerce.
-
 Leadership competencies defining management relationships and analytical
Presenting this set of slides with name - Leadership Competencies Defining Management Relationships And Analytical. This is a four stage process. The stages in this process are Leadership Competencies, Leadership Management, Leadership Skills.
-
 Conceptual application component monitoring analytics framework
Presenting this set of slides with name - Conceptual Application Component Monitoring Analytics Framework. This is a five stage process. The stages in this process are Conceptual Research Project Funding Analysis, Conceptual Input Process Product Impact Framework, Conceptual Qualities Attitudes Common Goals Venn Framework, Conceptual Bulb Icon Circular Tick Framework.
-
 Team chart in bulb and circles with analytics and bulb image
Presenting this set of slides with name - Team Chart In Bulb And Circles With Analytics And Bulb Image. This is a six stage process. The stages in this process are Team Chart, Group Chart, Member Chart.
-
 Service catalog contains password issue analytics hardware software
Presenting this set of slides with name - Service Catalog Contains Password Issue Analytics Hardware Software. This is a eight stage process. The stages in this process are Service Catalog, Service Classify, Service Record.
-
 Digital marketing pyramid analytics reporting social media marketing
Presenting this set of slides with name - Digital Marketing Pyramid Analytics Reporting Social Media Marketing. This is an editable five stages graphic that deals with topics like Digital Marketing Pyramid, Analytics Reporting, Social Media Marketing to help convey your message better graphically. This product is a premium product available for immediate download, and is 100 percent editable in Powerpoint. Download this now and use it in your presentations to impress your audience.
-
 Market analytics talent matching talent acquisition new technology
Presenting this set of slides with name - Market Analytics Talent Matching Talent Acquisition New Technology. This is an editable seven stages graphic that deals with topics like Market Analytics, Talent Matching, Talent Acquisition, New Technology to help convey your message better graphically. This product is a premium product available for immediate download, and is 100 percent editable in Powerpoint. Download this now and use it in your presentations to impress your audience.
-
 Knowledge management system online analytical processing providing quality
Presenting Knowledge Management System Online Analytical Processing Providing Quality Icon. You can make modifications in the font color, font size, and font style of the slide as it is entirely customizable. Its compatibility with Google Slides makes it accessible at once. You can transform and save the slide in PDF and JPG formats as well. Get this high-quality slide to present it in front of thousands of people on a standard screen and widescreen.
-
 Define business transformation roadmap social media presence social analytics
Presenting this set of slides with name - Define Business Transformation Roadmap Social Media Presence Social Analytics. This is an editable three stages graphic that deals with topics like Define Business Transformation Roadmap, Social Media Presence, Social Analytics to help convey your message better graphically. This product is a premium product available for immediate download, and is 100 percent editable in Powerpoint. Download this now and use it in your presentations to impress your audience.
-
 Transportation management service part planning logistic supply chain analytics
Presenting this set of slides with name - Transportation Management Service Part Planning Logistic Supply Chain Analytics. This is an editable five stages graphic that deals with topics like Transportation Management, Service Part Planning Logistic, Supply Chain Analytics to help convey your message better graphically. This product is a premium product available for immediate download, and is 100 percent editable in Powerpoint. Download this now and use it in your presentations to impress your audience.
-
 Collaboration communications data center technology enterprise data analytics
Presenting this set of slides with name - Collaboration Communications Data Center Technology Enterprise Data Analytics. This is an editable two stages graphic that deals with topics like Collaboration Communications, Data Center Technology, Enterprise Data Analytics to help convey your message better graphically. This product is a premium product available for immediate download, and is 100 percent editable in Powerpoint. Download this now and use it in your presentations to impress your audience.
-
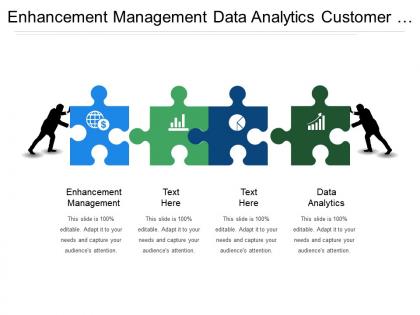 Enhancement management data analytics customer acquisition customer retention
Presenting Enhancement Management Data Analytics Customer Acquisition Customer Retention. Enjoy 100% customizability by downloading our PowerPoint template. Modify the text, font, orientation, patterns, shapes, colors, and background to achieve the desired results. Save and easily convert our PPT file into different formats such as PDF, PNG, and JPG. This professionally designed PowerPoint slide works well with Google Slides. It is also compatible with multiple screen aspect ratios like standard and widescreen.
-
 Enterprise security strategy roadmap data architecture business analytics
Presenting this set of slides with name - Enterprise Security Strategy Roadmap Data Architecture Business Analytics. This is an editable four stages graphic that deals with topics like Enterprise Security, Strategy Roadmap, Data Architecture, Business Analytics to help convey your message better graphically. This product is a premium product available for immediate download, and is 100 percent editable in Powerpoint. Download this now and use it in your presentations to impress your audience.
-
 Deep analytics reporting market analysis marketing planning process
Presenting this set of slides with name - Deep Analytics Reporting Market Analysis Marketing Planning Process. This is an editable four stages graphic that deals with topics like Deep Analytics Reporting, Market Analysis, Marketing Planning Process to help convey your message better graphically. This product is a premium product available for immediate download, and is 100 percent editable in Powerpoint. Download this now and use it in your presentations to impress your audience.
-
 Marketing analytics companies reviews customer experience channel local marketing
Presenting this set of slides with name - Marketing Analytics Companies Reviews Customer Experience Channel Local Marketing. This is an editable six stages graphic that deals with topics like Marketing Analytics, Companies Reviews, Customer Experience, Channel Local Marketing to help convey your message better graphically. This product is a premium product available for immediate download, and is 100 percent editable in Powerpoint. Download this now and use it in your presentations to impress your audience.
-
 Marketing resource management web mobile analytics product planning
Presenting Marketing Resource Management Web Mobile Analytics Product Planning. Design a personalized presentation by gaining access to this 100% customizable PPT template. Edit font, text, background, orientation, shapes, patterns, and colors to achieve the desired results. Change the PPT file format into PDF, PNG, and JPG as per your convenience. Our professionally created PowerPoint slide is accessible using Google Slides. You can also view it easily using standard or widescreen formats.
-
 Workforce analytics resource analysis emergent strategy works intended strategy
Presenting this set of slides with name - Workforce Analytics Resource Analysis Emergent Strategy Works Intended Strategy. This is an editable one stages graphic that deals with topics like Workforce Analytics, Resource Analysis, Emergent Strategy Works, Intended Strategy to help convey your message better graphically. This product is a premium product available for immediate download, and is 100 percent editable in Powerpoint. Download this now and use it in your presentations to impress your audience.
-
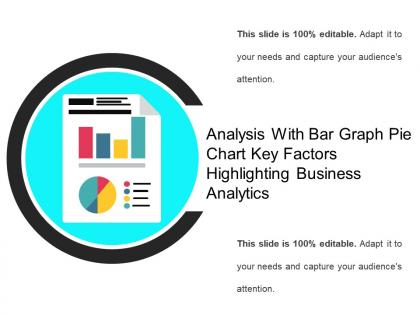 Analysis with bar graph pie chart key factors highlighting business analytics
Presenting analysis with bar graph pie chart key factors highlighting business analytics. This is a analysis with bar graph pie chart key factors highlighting business analytics. This is a two stage process. The stages in this process are analysis, audit, investigation.
-
 Analysis with magnifying glass bar graph chart highlighting business analytics
Presenting analysis with magnifying glass bar graph chart highlighting business analytics. This is a analysis with magnifying glass bar graph chart highlighting business analytics. This is a three stage process. The stages in this process are analysis, audit, investigation.
-
 Green checklist analytics with yellow arrow icons
Presenting green checklist analytics with yellow arrow icons. This is a green checklist analytics with yellow arrow icons. This is a three stage process. The stages in this process are business priorities, business goals, business objectives.
-
 Sales and operations leadership analytics structure execution
Presenting sales and operations leadership analytics structure execution. This is a sales and operations leadership analytics structure execution. This is a five stage process. The stages in this process are sales and operations, sales support, business operations.
-
 Data analytic arrow magnifying glass upward arrow
Presenting data analytic arrow magnifying glass upward arrow. This is a data analytic arrow magnifying glass upward arrow. This is a three stage process. The stages in this process are data analytics icons, information analytics icons, content analytics icons.
-
 Data analytic bar graph magnifying glass
Presenting data analytic bar graph magnifying glass. This is a data analytic bar graph magnifying glass. This is a four stage process. The stages in this process are data analytics icons, information analytics icons, content analytics icons.
-
 Data analytic icon bar graph
Presenting Data Analytic Icon Bar Graph template. The slide is compatible with Google Slides which makes it accessible at once. The slide is completely editable. It can be saved in various document formats such as JPEG, PNG, or PDF. Moreover, both standard screen(4:3) and widescreen(16:9) aspect ratios are supported. High-quality graphics ensure that distortion does not occur.
-
 Data analytic icon computer pie chart
Presenting data analytic icon computer pie chart. This is a data analytic icon computer pie chart. This is a three stage process. The stages in this process are data analytics icons, information analytics icons, content analytics icons.
-
 Data analytic icon computer screen bar graph
Presenting data analytic icon computer screen bar graph. This is a data analytic icon computer screen bar graph. This is a one stage process. The stages in this process are data analytics icons, information analytics icons, content analytics icons.
-
 Data analytic icon improved bar graph
Presenting data analytic icon improved bar graph. This is a data analytic icon improved bar graph. This is a three stage process. The stages in this process are data analytics icons, information analytics icons, content analytics icons.
-
 Data analytic magnifying glass bar graph
Presenting data analytic magnifying glass bar graph. This is a data analytic magnifying glass bar graph. This is a one stage process. The stages in this process are data analytics icons, information analytics icons, content analytics icons.
-
 Data analytic magnifying glass pie chart bar graph
Presenting data analytic magnifying glass pie chart bar graph. This is a data analytic magnifying glass pie chart bar graph. This is a four stage process. The stages in this process are data analytics icons, information analytics icons, content analytics icons.
-
 Data analytic magnifying glass upward arrow
Presenting data analytic magnifying glass upward arrow. This is a data analytic magnifying glass upward arrow. This is a four stage process. The stages in this process are data analytics icons, information analytics icons, content analytics icons.
-
 Data analytic screen growth improvement bar graph
Presenting data analytic screen growth improvement bar graph. This is a data analytic screen growth improvement bar graph. This is a two stage process. The stages in this process are data analytics icons, information analytics icons, content analytics icons.
-
 Consumer insights showing research analytics and experimentation
Presenting consumer insights showing research analytics and experimentation. This is a consumer insights showing research analytics and experimentation. This is a three stage process. The stages in this process are consumer insights, customer insights, client insights.
-
 Artificial intelligence analytics process from data gathering to implementation ppt background
Presenting artificial intelligence analytics process from data gathering to implementation ppt background. This is a artificial intelligence analytics process from data gathering to implementation ppt background. This is a four stage process. The stages in this process are artificial intelligence, machine learning, machine intelligence.
-
 Data landscape analysis infrastructure analytics and visualization
Presenting data landscape analysis infrastructure analytics and visualization. This is a data landscape analysis infrastructure analytics and visualization. This is a four stage process. The stages in this process are data landscape, big data machine learning, artificial intelligence.
-
 Analytics board with dollar sign and magnifying glass
Presenting analytics board with dollar sign and magnifying glass. This is a analytics board with dollar sign and magnifying glass. This is a two stage process. The stages in this process are spend analysis, spend management, procurement analysis, purchase analysis.
-
 Circular arrow with boxes and analytics icon in center
Presenting circular arrow with boxes and analytics icon in center. This is a circular arrow with boxes and analytics icon in center. This is a four stage process. The stages in this process are spend analysis, spend management, procurement analysis, purchase analysis.
-
 Emerging technologies timeline robotics alternate energy data analytics 2
Presenting emerging technologies timeline robotics alternate energy data analytics 2. This is a emerging technologies timeline robotics alternate energy data analytics 2. This is a three stage process. The stages in this process are emerging technologies, educational technology, information technology.
-
 Mobile app monetization strategies app purchase analytics mobile ecommerce
Presenting this set of slides with name - Mobile App Monetization Strategies App Purchase Analytics Mobile Ecommerce. This is a five stage process. The stages in this process are Monetization, Legal Tender, Money.
-
 Seo pitch review planning strategy concept initial web site development initial analytics
Presenting this set of slides with name - Seo Pitch Review Planning Strategy Concept Initial Web Site Development Initial Analytics. This is a six stage process. The stages in this process are Seo Pitch, Seo Proposal, Search Engine Optimization.
-
 Situation analysis icon with monitor and analytics
Presenting this set of slides with name - Situation Analysis Icon With Monitor And Analytics. This is a four stage process. The stages in this process are Situation Analysis Icon, Strategic Management Icon, Marketing Plan Icon.
-
 System transformation data and analytics process and innovation
Presenting this set of slides with name - System Transformation Data And Analytics Process And Innovation. This is a five stage process. The stages in this process are System Transformation, System Change, System Modification.
-
 Marketing campaign showing online marketing analytics with email advertising
Presenting Marketing Campaign Showing Online Marketing Analytics With Email Advertising template. The slide is compatible with Google Slides which makes it accessible at once. The slide is completely editable. It can be saved in various document formats such as JPEG, PNG or PDF. Moreover, both standard screen(4:3) and widescreen(16:9) aspect ratios are supported. High-quality graphics ensure that distortion does not occur.
-
 Robotic process automation showing customer satisfaction analytics and overall benefits
Presenting this set of slides with name - Robotic Process Automation Showing Customer Satisfaction Analytics And Overall Benefits. This is a five stage process. The stages in this process are Business Process Automation, Robotic Process Automation, Software Development.
-
 Quality management system quality assurance analytics and compliance
Presenting Quality Management System Quality Assurance Analytics And Compliance slideshow. The slide is compatible with Google Slides which makes it accessible at once. The slide is completely editable. It can be saved in various document formats such as JPEG, PNG or PDF. Moreover, both standard screen(4:3) and widescreen(16:9) aspect ratios are supported. High-quality graphics ensure that distortion does not occur.
-
 Business development plan icon with pie and analytics sign
Presenting Business Development Plan Icon With Pie And Analytics Sign PPT template. Alteration is available for the font type, size, diagram or background color, etc. This presentation is also compatible with Google Slides and can be converted into JPG, PNG, or PDF. The slideshow supports both standard screen(4:3) and widescreen(16:9) aspect ratios.
-
 Decision support system icon with analytics list and circles
Presenting this set of slides with name - Decision Support System Icon With Analytics List And Circles. This is a three stage process. The stages in this process are Decision Support System, Information System, Decision Making Activities.
-
 Business requirements showing workforce intrinsic analytics platformance
Presenting this set of slides with name - Business Requirements Showing Workforce Intrinsic Analytics Platformance. This is a five stage process. The stages in this process are Business Requirements, Business Needs.


