Powerpoint Templates and Google slides for Analytic
Save Your Time and attract your audience with our fully editable PPT Templates and Slides.
-
 Global Big Data Analytics In Manufacturing Industry Market AI In Manufacturing
This slide describes the global big data analytics in the manufacturing industry market, including CAGR rate, North Americas share in the market, year over year growth, market value in 2020, and growth of the solution category by 2028. Present the topic in a bit more detail with this Global Big Data Analytics In Manufacturing Industry Market AI In Manufacturing. Use it as a tool for discussion and navigation on Market Is Predicted, Several Firms Competing, Industry Market. This template is free to edit as deemed fit for your organization. Therefore download it now.
-
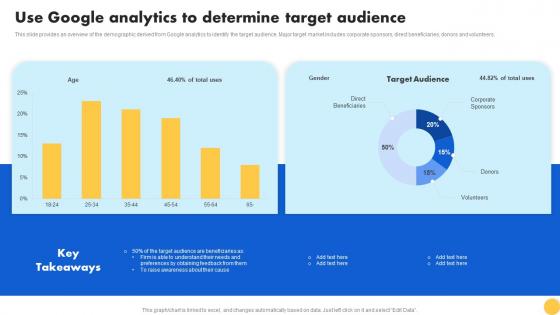 Creating Nonprofit Marketing Strategy Use Google Analytics To Determine Target Audience MKT SS V
This slide provides an overview of the demographic derived from Google analytics to identify the target audience. Major target market includes corporate sponsors, direct beneficiaries, donors and volunteers. Present the topic in a bit more detail with this Creating Nonprofit Marketing Strategy Use Google Analytics To Determine Target Audience MKT SS V. Use it as a tool for discussion and navigation on Target Audience. This template is free to edit as deemed fit for your organization. Therefore download it now.
-
 Dashboard Of Text Analytics For Obtaining Samples Of Sentiments
This slide showcases a dashboard for text analytics. The main purpose of this text analytics dashboard is tracking sentiments by topic and organize key text from large paragraphs. This includes samples by topic, sentiment over time tec. Presenting our well structured Dashboard Of Text Analytics For Obtaining Samples Of Sentiments. The topics discussed in this slide are Samples Sentiment, Representation Topic, Vocabulary Cloud. This is an instantly available PowerPoint presentation that can be edited conveniently. Download it right away and captivate your audience.
-
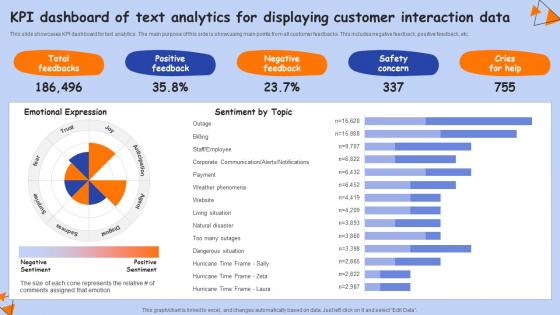 KPI Dashboard Of Text Analytics For Displaying Customer Interaction Data
This slide showcases KPI dashboard for text analytics. The main purpose of this side is showcasing main points from all customer feedbacks. This includes negative feedback, positive feedback, etc.Introducing our KPI Dashboard Of Text Analytics For Displaying Customer Interaction Data set of slides. The topics discussed in these slides are Corporate Communication, Weather Phenomena, Natural Disaster. This is an immediately available PowerPoint presentation that can be conveniently customized. Download it and convince your audience.
-
 KPI Analytics Dashboard For Smart Home Unlocking Potential Of Aiot IoT SS
The purpose of this slide is to showcase key performance indicators KPIs dashboard for smart homes. The metrics mentioned in slide are indoor temperature, humidity, light intensity, etc. Present the topic in a bit more detail with this KPI Analytics Dashboard For Smart Home Unlocking Potential Of Aiot IoT SS. Use it as a tool for discussion and navigation on Living Room, Bedroom. This template is free to edit as deemed fit for your organization. Therefore download it now.
-
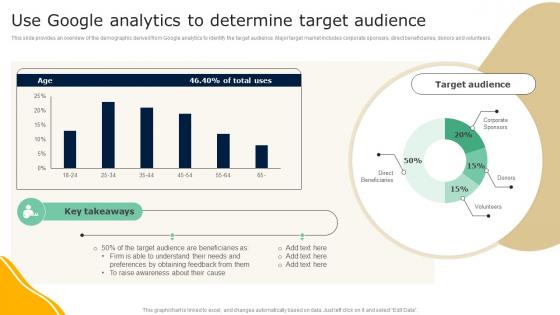 Use Google Analytics To Determine Target Audience Guide To Effective Nonprofit Marketing MKT SS V
This slide provides an overview of the demographic derived from Google analytics to identify the target audience. Major target market includes corporate sponsors, direct beneficiaries, donors and volunteers. Deliver an outstanding presentation on the topic using this Use Google Analytics To Determine Target Audience Guide To Effective Nonprofit Marketing MKT SS V. Dispense information and present a thorough explanation of Analytics, Target, Audience using the slides given. This template can be altered and personalized to fit your needs. It is also available for immediate download. So grab it now.
-
 Client Satisfaction Data Analytics Dashboard
This slide shows customer data analytics dashboard that can be used to summaries annual data for compiling data. It include figures related to requests answered, total requests and satisfaction rate, etc.Introducing our Client Satisfaction Data Analytics Dashboard set of slides. The topics discussed in these slides are Requests Answered, Total Requests, Total Revenue. This is an immediately available PowerPoint presentation that can be conveniently customized. Download it and convince your audience.
-
 Data Analytics Dashboard To Determine Client Behaviour
This slide shows customer patterns related data analytics dashboard that can be used to analyse current customer trends for making policies. It include shopping behavioural insights, customer conversion rate, etc.Presenting our well structured Data Analytics Dashboard To Determine Client Behaviour. The topics discussed in this slide are Customers Conversion, Shopping Behavioural, Shopping Activity This is an instantly available PowerPoint presentation that can be edited conveniently. Download it right away and captivate your audience.
-
 Global Regions Client Data Insights And Analytics Dashboard
This slide shows customer data analytics dashboard that can be used to summarise region wise sales distribution across the globe. It include weekly conversion rate, regional conversion rate and margin ratios, etc.Introducing our Global Regions Client Data Insights And Analytics Dashboard set of slides. The topics discussed in these slides are Regional Conversion, Weekly Conversion, Region Launched. This is an immediately available PowerPoint presentation that can be conveniently customized. Download it and convince your audience.
-
 Marketing Analytics Dashboard To Evaluate Effective Marketing Strategies For Bootstrapped Strategy SS V
The following slide showcases performance key performance indicator KPI dashboard through which marketing team can measure social media campaign performance. The KPIs highlighted are YouTube channel views, Facebook daily reach, LinkedIn clicks and likes, etc. Present the topic in a bit more detail with this Marketing Analytics Dashboard To Evaluate Effective Marketing Strategies For Bootstrapped Strategy SS V. Use it as a tool for discussion and navigation on Analytics, Marketing, Performance. This template is free to edit as deemed fit for your organization. Therefore download it now.
-
 Agile Analytics For Sales Performance
This slide highlights sales performance dashboard for agile analytics. This slide aims to provide insights regarding gross profit, net profits, return on sales, income and expenses for the year. It acts as helpful tool for forecasting future sales and improving overall revenue generation processes. Introducing our Agile Analytics For Sales Performance set of slides. The topics discussed in these slides are Income And Expenses, Net Profit Fulfillment. This is an immediately available PowerPoint presentation that can be conveniently customized. Download it and convince your audience.
-
 Agile Analytics With Power Bi For Hr Department
This slide showcases HR analysis using business intelligence tool. The purpose of this slide is to understand the workforce demographics and effective management of employees to achieve business goals. It includes elements such as hires by organization level, age banding, gender, business units, location, etc. Introducing our Agile Analytics With Power Bi For Hr Department set of slides. The topics discussed in these slides are Hires By Gender, Hires By Age Banding. This is an immediately available PowerPoint presentation that can be conveniently customized. Download it and convince your audience.
-
 Agile Financial Analytics Kpi Dashboard
This slide showcases financial analytics KPI dashboard. This slide aims to provide in depth insights into company financial status to add value to the company. It helps in improving financial performance through proper information about the expenses and revenue of the organization. Presenting our well structured Agile Financial Analytics Kpi Dashboard. The topics discussed in this slide are Current Ratio Mom Trend, Dimension Breakdown.This is an instantly available PowerPoint presentation that can be edited conveniently. Download it right away and captivate your audience.
-
 Agile Risk Analytics Kpi Dashboard
This slide highlights KPI dashboard for agile risk analytics. The purpose of this template is to identify internal and external risk for the business entity and employ techniques for risk mitigation. It includes components such as total risk, initial risk level, risk status, risk trends and top risks of the entity. Presenting our well structured Agile Risk Analytics Kpi Dashboard. The topics discussed in this slide are Identify Goals, Risk Assessment.This is an instantly available PowerPoint presentation that can be edited conveniently. Download it right away and captivate your audience.
-
 Dashboard For Agile Analytics In Retail Sector
This slide showcases agile analytics dashboard for retail sector sales. The purpose of this template is to provide retailers with data analytics for improving inventory management, pricing strategy and allocation of products. It helps business organization to review sales data for identifying changing market trends and patterns. Introducing our Dashboard For Agile Analytics In Retail Sector set of slides. The topics discussed in these slides are Sales Summery, Daily Sales Forecast. This is an immediately available PowerPoint presentation that can be conveniently customized. Download it and convince your audience.
-
 Website Usage Agile Analytics Dashboard
This slide highlights agile analytics dashboard for website usage. This slide aims to provide details regarding usage by various services, number of users on website, number of sales, network traffic, plan level and sales by plan. It helps in improving audience experience and optimizing sites performance. Presenting our well structured Website Usage Agile Analytics Dashboard. The topics discussed in this slide are Product Service Usage, Network Traffic.This is an instantly available PowerPoint presentation that can be edited conveniently. Download it right away and captivate your audience.
-
 Online Product Analytics Management Dashboard
This slide presents the dashboard for online product analytics for enhancing online performance management. This includes data like total sessions, total visitors, avg. requests received, views by browser, etc. Introducing our Online Product Analytics Management Dashboard set of slides. The topics discussed in these slides are Online Product, Analytics Management, Dashboard. This is an immediately available PowerPoint presentation that can be conveniently customized. Download it and convince your audience.
-
 Dashboard Of Marketing Campaign Operational Analytics
This slide showcases the marketing campaign analytics dashboard of an organization. It further includes various elements such as cost per acquisition, total acquisition, total clicks, total impressions, etc.Introducing our Dashboard Of Marketing Campaign Operational Analytics set of slides. The topics discussed in these slides are Cost Per Acquisition, Total Spend, Acquisitions Campaign. This is an immediately available PowerPoint presentation that can be conveniently customized. Download it and convince your audience.
-
 User Analytics Dashboard For Music Streaming Apps
This slide highlights analytical dashboard for music streaming apps to provide valuable insights into user behaviour and interactions. It includes various features such as goal review, listeners and revenue generation.Introducing our User Analytics Dashboard For Music Streaming Apps set of slides. The topics discussed in these slides are User Analytics, Dashboard For Music, Streaming Apps. This is an immediately available PowerPoint presentation that can be conveniently customized. Download it and convince your audience.
-
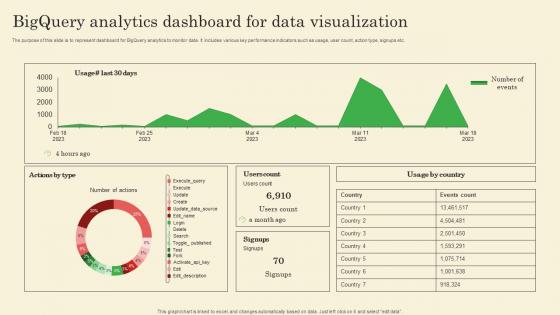 Bigquery Analytics Dashboard For Data Visualization
The purpose of this slide is to represent dashboard for BigQuery analytics to monitor data. It includes various key performance indicators such as usage, user count, action type, signups etc. Introducing our Bigquery Analytics Dashboard For Data Visualization set of slides. The topics discussed in these slides are Users Count, Usage By Country. This is an immediately available PowerPoint presentation that can be conveniently customized. Download it and convince your audience.
-
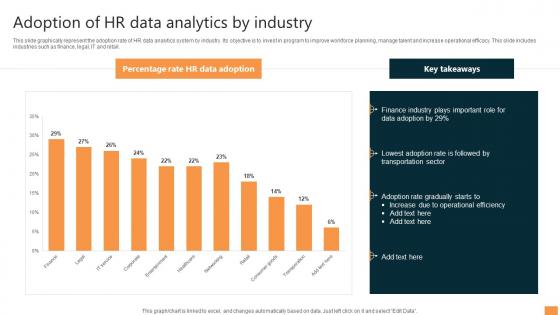 Adoption Of Hr Data Analytics By Industry
This slide graphically represent the adoption rate of HR data analytics system by industry. Its objective is to invest in program to improve workforce planning, manage talent and increase operational efficacy. This slide includes industries such as finance, legal, IT and retail. Introducing our Adoption Of Hr Data Analytics By Industry set of slides. The topics discussed in these slides are Finance, Operational, Transportation. This is an immediately available PowerPoint presentation that can be conveniently customized. Download it and convince your audience.
-
 Credit Risk Management Dashboard For Banking Analytics
This slide illustrates KPI dashboard for credit risk management to understand creditworthiness and know the capacity of paying back on time. It includes metrics such as denied vs authorized loans by product, approved value per location, etc. Introducing our Credit Risk Management Dashboard For Banking Analytics set of slides. The topics discussed in these slides are Management, Dashboard, Analytics. This is an immediately available PowerPoint presentation that can be conveniently customized. Download it and convince your audience.
-
 Analyzing Dynamics Of Linkedin Update Analytics
This slide highlights the assessment of LinkedIn update analytics. The purpose of this template is to assist managers in optimizing their LinkedIn updates for generating higher engagement rates over a period of time. It includes elements such as post date, impressions along with use case. Introducing our Analyzing Dynamics Of Linkedin Update Analytics set of slides. The topics discussed in these slides are Competitor Benchmarking, Impressions, Update Analytics This is an immediately available PowerPoint presentation that can be conveniently customized. Download it and convince your audience.
-
 Linkedin Analytics Dashboard Using Power Bi
This slide highlights power BI dashboard for LinkedIn analytics. The purpose of this template is to provide businesses with at-a-glance visual feedback for comparing various key performance indicators. It includes elements such as connections, companies, reactions, etc. Introducing our This slide highlights power BI dashboard for LinkedIn analytics. The purpose of this template is to provide businesses with at-a-glance visual feedback for comparing various key performance indicators. It includes elements such as connections, companies, reactions, etc. set of slides. The topics discussed in these slides are Invitation Sent, Reaction, Invitation Received This is an immediately available PowerPoint presentation that can be conveniently customized. Download it and convince your audience.
-
 Linkedin Analytics Kpi Dashboard To Gain Strategic Insights
This slide highlights power BI dashboard for LinkedIn analytics. The purpose of this template is to provide businesses with at-a-glance visual feedback for comparing various key performance indicators. It includes elements such as connections, companies, reactions, etc. Presenting our well structured Linkedin Analytics Kpi Dashboard To Gain Strategic Insights The topics discussed in this slide are This slide highlights power BI dashboard for LinkedIn analytics. The purpose of this template is to provide businesses with at-a-glance visual feedback for comparing various key performance indicators. It includes elements such as connections, companies, reactions, etc. This is an instantly available PowerPoint presentation that can be edited conveniently. Download it right away and captivate your audience.
-
 Linkedin Impressions Analytics Kpi Dashboard
This slide highlights the LinkedIn analytics KPI dashboard. The purpose of this slide is to help businesses in analyzing the performance of their content for reaching with target audience. It includes elements such as followers, click-through rate, engagement, etc. Presenting our well structured Linkedin Impressions Analytics Kpi Dashboard The topics discussed in this slide are Company Industry, Job Function, Job Seniority This is an instantly available PowerPoint presentation that can be edited conveniently. Download it right away and captivate your audience.
-
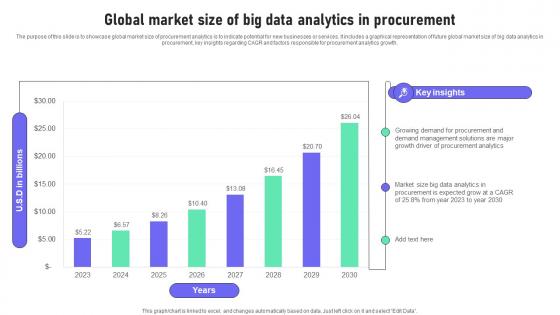 Global Market Size Of Big Data Analytics In Procurement
The purpose of this slide is to showcase global market size of procurement analytics is to indicate potential for new businesses or services. It includes a graphical representation of future global market size of big data analytics in procurement, key insights regarding CAGR and factors responsible for procurement analytics growth. Presenting our well structured Global Market Size Of Big Data Analytics In Procurement. The topics discussed in this slide are Big Data, Analytics, Procurement. This is an instantly available PowerPoint presentation that can be edited conveniently. Download it right away and captivate your audience.
-
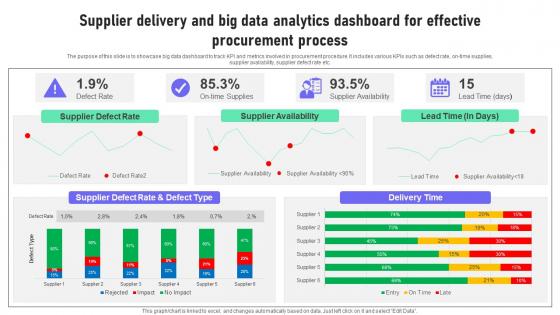 Supplier Delivery And Big Data Analytics Dashboard For Effective Procurement Process
The purpose of this slide is to showcase big data dashboard to track KPI and metrics involved in procurement procedure. It includes various KPIs such as defect rate, on-time supplies, supplier availability, supplier defect rate etc. Presenting our well structured Supplier Delivery And Big Data Analytics Dashboard For Effective Procurement Process. The topics discussed in this slide are Procurement, Process, Dashboard. This is an instantly available PowerPoint presentation that can be edited conveniently. Download it right away and captivate your audience.
-
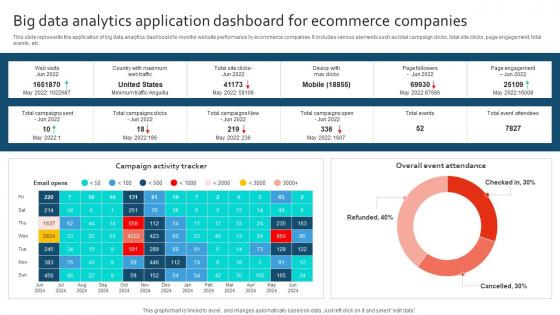 Big Data Analytics Application Dashboard For Ecommerce Companies
This slide represents the application of big data analytics dashboard to monitor website performance by ecommerce companies. It includes various elements such as total campaign clicks, total site clicks, page engagement, total events, etc. Introducing our Big Data Analytics Application Dashboard For Ecommerce Companies set of slides. The topics discussed in these slides are Campaign Activity Tracker, Ecommerce Companies. This is an immediately available PowerPoint presentation that can be conveniently customized. Download it and convince your audience.
-
 Kubler Ross Framework For Managing Visionary And Analytical Thinking Strategy SS V
This slide provides glimpse about Kubler Ross framework that can help business in minimizing resistance to change management. It includes five stages such as denial, anger, bargaining, depression, acceptance, etc. Deliver an outstanding presentation on the topic using this Kubler Ross Framework For Managing Visionary And Analytical Thinking Strategy SS V. Dispense information and present a thorough explanation of Emphasizes, Organizational, Compromise using the slides given. This template can be altered and personalized to fit your needs. It is also available for immediate download. So grab it now.
-
 Statistics Showing Why Women Are Not In Visionary And Analytical Thinking Strategy SS V
Present the topic in a bit more detail with this Statistics Showing Why Women Are Not In Visionary And Analytical Thinking Strategy SS V. Use it as a tool for discussion and navigation on Executive, Positions, Political. This template is free to edit as deemed fit for your organization. Therefore download it now.
-
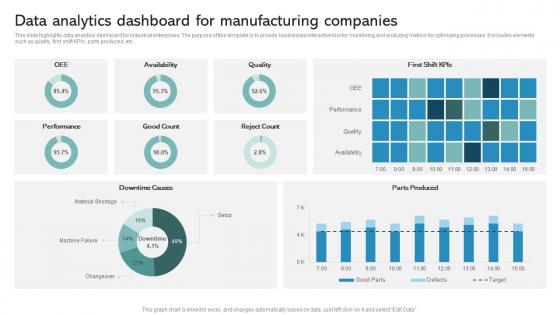 Data Analytics Dashboard For Manufacturing Companies
This slide highlights data analytics dashboard for industrial enterprises. The purpose of this template is to provide businesses interactive tool for monitoring and analyzing metrics for optimizing processes. It includes elements such as quality, first shift KPIs, parts produced, etc. Introducing our Data Analytics Dashboard For Manufacturing Companies set of slides. The topics discussed in these slides are Performance, Good Count, Reject Count, Availability, Quality. This is an immediately available PowerPoint presentation that can be conveniently customized. Download it and convince your audience.
-
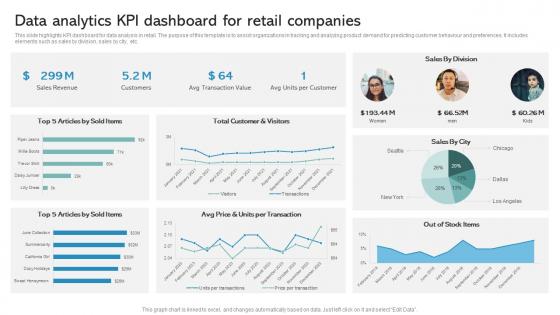 Data Analytics KPI Dashboard For Retail Companies
This slide highlights KPI dashboard for data analysis in retail. The purpose of this template is to assist organizations in tracking and analyzing product demand for predicting customer behaviour and preferences. It includes elements such as sales by division, sales by city, etc. Presenting our well structured Data Analytics KPI Dashboard For Retail Companies. The topics discussed in this slide are Total Customer And Visitors, Units Per Transaction, Articles By Sold Items. This is an instantly available PowerPoint presentation that can be edited conveniently. Download it right away and captivate your audience.
-
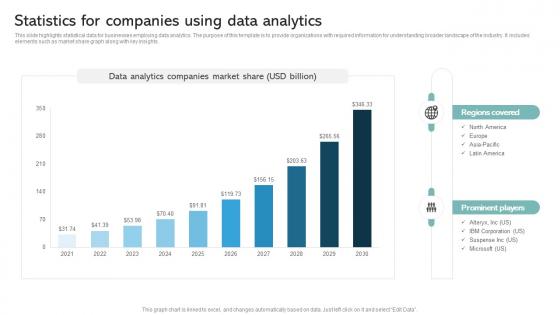 Statistics For Companies Using Data Analytics
This slide highlights statistical data for businesses employing data analytics. The purpose of this template is to provide organizations with required information for understanding broader landscape of the industry. It includes elements such as market share graph along with key insights. Presenting our well structured Statistics For Companies Using Data Analytics. The topics discussed in this slide are Using Data Analytics, Regions Covered, Prominent Players. This is an instantly available PowerPoint presentation that can be edited conveniently. Download it right away and captivate your audience.
-
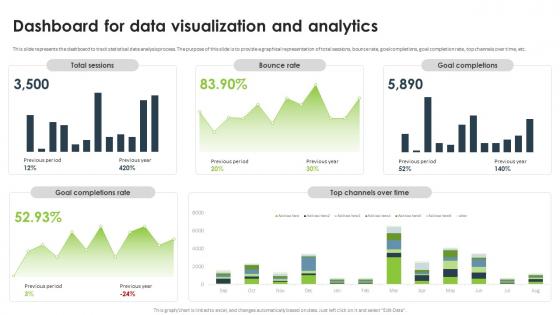 Statistical Analysis For Data Driven Dashboard For Data Visualization And Analytics
This slide represents the dashboard to track statistical data analysis process. The purpose of this slide is to provide a graphical representation of total sessions, bounce rate, goal completions, goal completion rate, top channels over time, etc. Present the topic in a bit more detail with this Statistical Analysis For Data Driven Dashboard For Data Visualization And Analytics. Use it as a tool for discussion and navigation on Data Visualization And Analytics, Bounce Rate, Goal Completions, Goal Completion Rate. This template is free to edit as deemed fit for your organization. Therefore download it now.
-
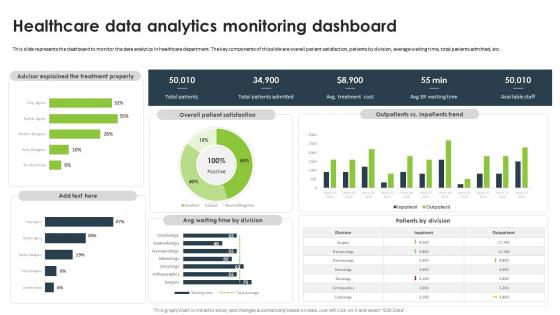 Statistical Analysis For Data Driven Healthcare Data Analytics Monitoring Dashboard
This slide represents the dashboard to monitor the data analytics in healthcare department. The key components of this slide are overall patient satisfaction, patients by division, average waiting time, total patients admitted, etc. Present the topic in a bit more detail with this Statistical Analysis For Data Driven Healthcare Data Analytics Monitoring Dashboard. Use it as a tool for discussion and navigation on Healthcare Data Analytics, Monitoring Dashboard, Healthcare Department. This template is free to edit as deemed fit for your organization. Therefore download it now.
-
 Digital Marketing Analytics Dashboard For E Commerce Brands
This slide displays dashboard for digital marketing analytics that helps to track campaign performance. It evaluates on the basis of KPIs such as conversion rate, cost per conversion, cost per click, etc. Presenting our well structured Digital Marketing Analytics Dashboard For E Commerce Brands The topics discussed in this slide are Digital Marketing, Analytics Dashboard, E Commerce Brands This is an instantly available PowerPoint presentation that can be edited conveniently. Download it right away and captivate your audience.
-
 Transforming From Traditional Dashboard Analytics Business Model Innovation Impact On Customer DT SS
This slide represents an analytics dashboard for measuring impact on customer satisfaction due to adoption of new digital business model. It tracks KPIS such as net promoter score, customer retention and customer effort score. Present the topic in a bit more detail with this Transforming From Traditional Dashboard Analytics Business Model Innovation Impact On Customer DT SS Use it as a tool for discussion and navigation on Net Promoter Score, Customer Retention, Customer Effort Score This template is free to edit as deemed fit for your organization. Therefore download it now.
-
 Transforming From Traditional Dashboard Analytics Measuring Impact On User Metrics And Revenue DT SS
This slide analyzes the impact od digital business model innovation on user metrics and recurring revenue of business. It tracks KPIs such as monthly recurring revenue, revenue growth, active users, life time value, cost of customer acquisition, churn rate, growth by channel, subscription plan, etc. Present the topic in a bit more detail with this Transforming From Traditional Dashboard Analytics Measuring Impact On User Metrics And Revenue DT SS Use it as a tool for discussion and navigation on Monthly Recurring Revenue, Monthly Revenue Growth, Active Users This template is free to edit as deemed fit for your organization. Therefore download it now.
-
 Social Media Analytics Market Outlook Social Media Analytics With Tools
This slide represents the Social Media Analytics of the market outlook. The purpose of this slide is to outline the year-over-year growth rate, CAGR rate, growth momentum, market size growth of the market, etc. Present the topic in a bit more detail with this Social Media Analytics Market Outlook Social Media Analytics With Tools. Use it as a tool for discussion and navigation on Social Media Analytics Market, Growth Momentum, Market Size Growth, Growth Of Social Media. This template is free to edit as deemed fit for your organization. Therefore download it now.
-
 Social Media Analytics With Tools Audience And Influencer Analysis Of Social Media Analytics
This slide showcases the different types of Social Media Analytics performed in the market. The purpose of this slide is to outline the types of analysis of social media such as performance analysis, audience analysis, competitor analysis, etc. Deliver an outstanding presentation on the topic using this Social Media Analytics With Tools Audience And Influencer Analysis Of Social Media Analytics. Dispense information and present a thorough explanation of Audience And Influencer Analysis, Social Media Analytics, Audience Analysis, Competitor Analysis using the slides given. This template can be altered and personalized to fit your needs. It is also available for immediate download. So grab it now.
-
 Social Media Analytics With Tools Budget For Social Media Analytics Tools Training
This slide shows the cost breakup of a social media analytics awareness and mitigation training program. The purpose of this slide is to highlight the estimated cost of various training components, such as instructors cost, training material cost, etc. Deliver an outstanding presentation on the topic using this Social Media Analytics With Tools Budget For Social Media Analytics Tools Training. Dispense information and present a thorough explanation of Cost Breakup, Social Media Analytics Awareness, Mitigation Training Program, Training Material Cost using the slides given. This template can be altered and personalized to fit your needs. It is also available for immediate download. So grab it now.
-
 Social Media Analytics With Tools Crucial Social Media Metrics For Success
This slide showcases the crucial social media metrics for success. The purpose of this slide is to outline the social media metrics such as follower growth, customer satisfaction, impressions, customer retention, brand sentiment, click-through rates, etc. Deliver an outstanding presentation on the topic using this Social Media Analytics With Tools Crucial Social Media Metrics For Success. Dispense information and present a thorough explanation of Customer Satisfaction, Customer Retention, Engagement Metrics, Conversion Rates, Brand Sentimental using the slides given. This template can be altered and personalized to fit your needs. It is also available for immediate download. So grab it now.
-
 Social Media Analytics With Tools Dashboards For Social Media Analytics Tracking And Monitoring
This slide depicts the dashboard for Social Media Analytics insights. The purpose of this slide is to highlight insights such as brand awareness, audience growth, post-engagement rate, provider analytics, etc. Present the topic in a bit more detail with this Social Media Analytics With Tools Dashboards For Social Media Analytics Tracking And Monitoring. Use it as a tool for discussion and navigation on Dashboards For Social Media, Analytics Tracking And Monitoring, Brand Awareness, Audience Growth, Post Engagement Rate. This template is free to edit as deemed fit for your organization. Therefore download it now.
-
 Social Media Analytics With Tools Diverse Tools For Social Media Platform
This slide represents diverse tools for social media data analytics. The purpose of this slide is to outline the different tools for social media data analytics such as facebook page insight, audience insight, account home, tweet activity dashboard, etc. Present the topic in a bit more detail with this Social Media Analytics With Tools Diverse Tools For Social Media Platform. Use it as a tool for discussion and navigation on Social Media Platform, Tweet Activity Dashboard, Social Media Data Analytics, Tweet Activity Dashboard. This template is free to edit as deemed fit for your organization. Therefore download it now.
-
 Social Media Analytics With Tools Global Social Media Analytics Market
This slide depicts the global Social Media Analytics of the market from 2020 to 2024. the purpose of this slide is to highlight incremental growth, market fragments, and impact on the information technology industry, etc. Deliver an outstanding presentation on the topic using this Social Media Analytics With Tools Global Social Media Analytics Market. Dispense information and present a thorough explanation of Global Social Media Analytics Market, Incremental Growth, Market Fragments, Information Technology Industry using the slides given. This template can be altered and personalized to fit your needs. It is also available for immediate download. So grab it now.
-
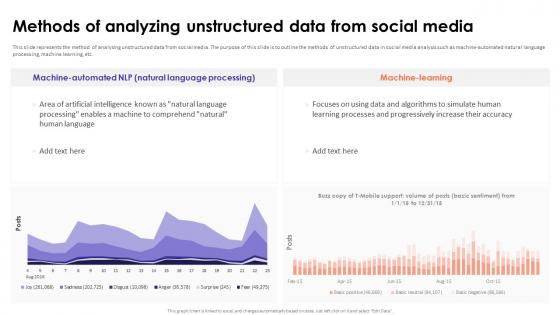 Social Media Analytics With Tools Methods Of Analyzing Unstructured Data From Social Media
This slide represents the method of analysing unstructured data from social media. The purpose of this slide is to outline the methods of unstructured data in social media analysis such as machine-automated natural language processing, machine learning, etc. Present the topic in a bit more detail with this Social Media Analytics With Tools Methods Of Analyzing Unstructured Data From Social Media. Use it as a tool for discussion and navigation on Analyzing Unstructured Data, Social Media, Natural Language Processing. This template is free to edit as deemed fit for your organization. Therefore download it now.
-
 Social Media Analytics With Tools Paid Ads And Sentiment Analysis Of Social Media Analytics
This slide showcases the different types of Social Media Analytics performed in the market. The purpose of this slide is to outline the types of analysis of social media such as performance analysis, audience analysis, competitor analysis, etc. Deliver an outstanding presentation on the topic using this Social Media Analytics With Tools Paid Ads And Sentiment Analysis Of Social Media Analytics. Dispense information and present a thorough explanation of Paid Ads And Sentiment Analysis, Social Media Analytics, Audience Analysis, Competitor Analysis using the slides given. This template can be altered and personalized to fit your needs. It is also available for immediate download. So grab it now.
-
 Social Media Analytics With Tools Performance And Competitor Analysis Of Social Media Analytics
This slide showcases the different types of Social Media Analytics performed in the market. The purpose of this slide is to outline the types of analysis of social media such as performance analysis, audience analysis, competitor analysis, etc. Present the topic in a bit more detail with this Social Media Analytics With Tools Performance And Competitor Analysis Of Social Media Analytics. Use it as a tool for discussion and navigation on Performance And Competitor Analysis, Social Media Analytics, Audience Analysis, Competitor Analysis. This template is free to edit as deemed fit for your organization. Therefore download it now.
-
 Social Media Analytics With Tools Social Media Analytics Market Summary
This slide depicts the market summary of Social Media Analytics. The purpose of this slide is to outline the market revenue and component types of social media. There are a lot of companies for social media such as Oracle, cision, IBM, etc. Present the topic in a bit more detail with this Social Media Analytics With Tools Social Media Analytics Market Summary. Use it as a tool for discussion and navigation on Social Media Analytics Market, Consistent Rate, Revenue From The Services Segment. This template is free to edit as deemed fit for your organization. Therefore download it now.
-
 Dashboard Analytics Measuring Supply Chain Efficiency Digital Transformation Of Retail DT SS
This slide represents a supply chain management dashboard measuring the efficiency of supply chain operations after effective digital transformation of retail operations. It includes inventory to sales, inventory turnover, carrying cost of inventory, inventory accuracy, and percentage out of stock items. Deliver an outstanding presentation on the topic using this Dashboard Analytics Measuring Supply Chain Efficiency Digital Transformation Of Retail DT SS Dispense information and present a thorough explanation of Dashboard Analytics, Carrying Cost Of Inventory, Supply Chain Efficiency using the slides given. This template can be altered and personalized to fit your needs. It is also available for immediate download. So grab it now.
-
 Dashboard Analytics Monitoring Retail Store Performance Digital Transformation Of Retail DT SS
This slide represents a retail KPI dashboard measuring the performance of retail store. It tracks KPIs such as sales revenue, customers, average transaction price, average units per customer, top five articles by sold items, total customers and visitors, collections by revenue , average price and units per transaction, etc. Present the topic in a bit more detail with this Dashboard Analytics Monitoring Retail Store Performance Digital Transformation Of Retail DT SS Use it as a tool for discussion and navigation on Sales Revenue, Customers, Transaction Price This template is free to edit as deemed fit for your organization. Therefore download it now.
-
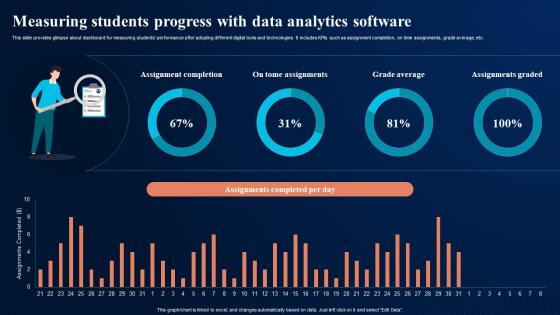 Measuring Students Progress With Data Analytics Digital Transformation In Education DT SS
This slide provides glimpse about dashboard for measuring students performance after adopting different digital tools and technologies. It includes KPIs such as assignment completion, on time assignments, grade average, etc. Deliver an outstanding presentation on the topic using this Measuring Students Progress With Data Analytics Digital Transformation In Education DT SS. Dispense information and present a thorough explanation of Progress, Analytics, Software using the slides given. This template can be altered and personalized to fit your needs. It is also available for immediate download. So grab it now.
-
 HR Analytics To Track Employees Information
The slide highlights key aspects such as employee overview, monthly analysis, performance metrics, historical trends, occupancy rates, and headcount. These HR analytics tools assist in precise employee information tracking, enabling data driven HR management decisions. Introducing our HR Analytics To Track Employees Information set of slides. The topics discussed in these slides are Headcount By Office, Headcount By Tenure Range, Headcount By Department. This is an immediately available PowerPoint presentation that can be conveniently customized. Download it and convince your audience.
-
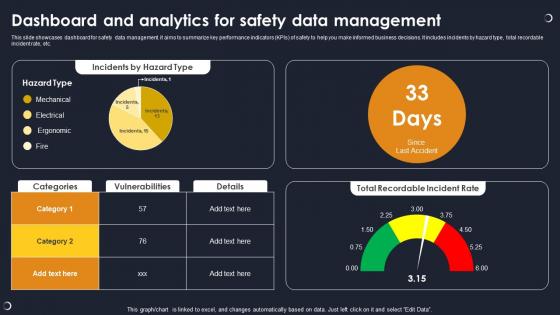 Dashboard And Analytics For Safety Data Management
This slide showcases dashboard for safety data management. it aims to summarize key performance indicators KPIs of safety to help you make informed business decisions. It includes incidents by hazard type, total recordable incident rate, etc. Presenting our well structured Dashboard And Analytics For Safety Data Management. The topics discussed in this slide are Incidents By Hazard Type, Vulnerabilities, Total Recordable Incident Rate. This is an instantly available PowerPoint presentation that can be edited conveniently. Download it right away and captivate your audience.
-
 Healthcare Analytics Dashboard Using Iot How Iomt Is Transforming Medical Industry IoT SS V
Following slide exhibits dashboard that provides health care data after deployment of internet of things IoT technology. It includes indicators such as patient satisfaction, total patients, average waiting time etc. Deliver an outstanding presentation on the topic using this Healthcare Analytics Dashboard Using Iot How Iomt Is Transforming Medical Industry IoT SS V. Dispense information and present a thorough explanation of Healthcare, Analytics, Dashboard using the slides given. This template can be altered and personalized to fit your needs. It is also available for immediate download. So grab it now.
-
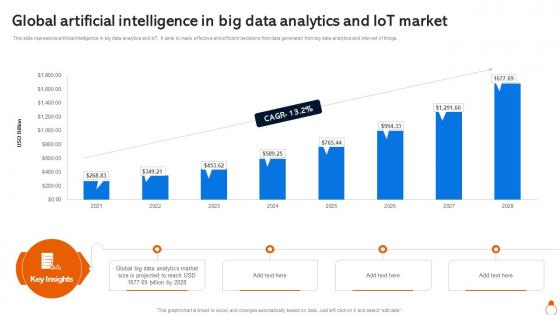 Global Artificial Intelligence In Big Data Analytics And IOT Market
This slide represents artificial intelligence in big data analytics and IoT. It aims to make effective and efficient decisions from data generated from big data analytics and internet of things. Introducing our Global Artificial Intelligence In Big Data Analytics And IOT Market set of slides. The topics discussed in these slides are Global Artificial Intelligence, Big Data Analytics This is an immediately available PowerPoint presentation that can be conveniently customized. Download it and convince your audience.
-
 Healthcare Analytics Dashboard Using IoT Technology Guide To Networks For IoT Healthcare IoT SS V
Following slide exhibits dashboard that provides health care data after deployment of internet of things IoT technology. It includes indicators such as patient satisfaction, total patients, average waiting time etc. Present the topic in a bit more detail with this Healthcare Analytics Dashboard Using IoT Technology Guide To Networks For IoT Healthcare IoT SS V. Use it as a tool for discussion and navigation on Healthcare Analytics, Dashboard Using Iot Technology. This template is free to edit as deemed fit for your organization. Therefore download it now.
-
 Dashboard Measuring Key Partner Analytics And Performance Nurturing Relationships
This slide analyzes a dashboard examining various partner pipeline metrics. It tracks KPIs such as, partner opportunity pipeline, leads, demo units, co-brand requests, market development funds requests and budget, new partners, open pipeline, certified partners, e-learnings. Deliver an outstanding presentation on the topic using this Dashboard Measuring Key Partner Analytics And Performance Nurturing Relationships Dispense information and present a thorough explanation of Opportunities, Certified Partners, Performance Indicators using the slides given. This template can be altered and personalized to fit your needs. It is also available for immediate download. So grab it now.
-
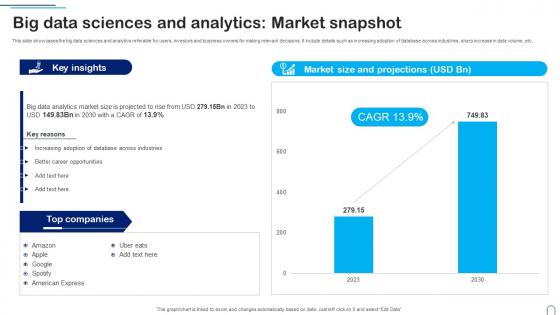 Big Data Sciences And Analytics Market Snapshot
This slide showcases the big data sciences and analytics referable for users, investors and business owners for making relevant decisions. It include details such as increasing adoption of database across industries, sharp increase in data volume, etc. Introducing our Big Data Sciences And Analytics Market Snapshot set of slides. The topics discussed in these slides are Increasing Adoption, Database Across Industries, Better Career Opportunities. This is an immediately available PowerPoint presentation that can be conveniently customized. Download it and convince your audience.


