Powerpoint Templates and Google slides for Analysis Illustration
Save Your Time and attract your audience with our fully editable PPT Templates and Slides.
-
 Business flowchart illustration of 6 stages strategic analysis powerpoint slides
We are proud to present our business flowchart illustration of 6 stages strategic analysis powerpoint slides. Create visually stunning and define your PPT Presentations in a unique and inspiring manner using our above template. This PowerPoint Diagram displays recurring processes and cycles. Use this diagram for presentations related to business processes and strategic management.
-
 Discover Icon Business Illustrating Location Analysis Individual Evaluation
Engage buyer personas and boost brand awareness by pitching yourself using this prefabricated set. This Discover Icon Business Illustrating Location Analysis Individual Evaluation is a great tool to connect with your audience as it contains high-quality content and graphics. This helps in conveying your thoughts in a well-structured manner. It also helps you attain a competitive advantage because of its unique design and aesthetics. In addition to this, you can use this PPT design to portray information and educate your audience on various topics. With twelve slides, this is a great design to use for your upcoming presentations. Not only is it cost-effective but also easily pliable depending on your needs and requirements. As such color, font, or any other design component can be altered. It is also available for immediate download in different formats such as PNG, JPG, etc. So, without any further ado, download it now.
-
 Business analysis diagrams illustration of 6 layers stacked structure powerpoint slides
We are proud to present our business analysis diagrams illustration of 6 layers stacked structure powerpoint slides. The above PowerPoint diagram displays an image of 3d stacked process. Stacked diagram is created of multiple layers and displays structures, relationships, processes or different levels. Our PPTs are specially created by a professional team with vast experience. They diligently strive to come up with the right vehicle for your brilliant Ideas.
-
 Percentage circle illustration for product profitability analysis infographic template
This is a single slide titled Percentage Circle Illustration For Product Profitability Analysis Infographic Template. It is crafted using high quality vector based visuals that are 100 percent editable and available for immediate download in standard and widescreen aspect ratios.
-
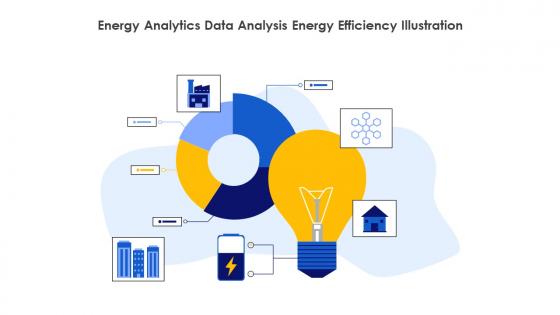 Energy Analytics Data Analysis Energy Efficiency Illustration
This colourful PowerPoint icon is perfect for presentations on energy analytics. It features a graph with a green and yellow background, representing the rise and fall of energy consumption. Its a great visual aid for any energy-related discussion.
-
 Market Analysis And Survey For Electric Cars Illustration
This coloured PowerPoint icon is perfect for presentations on market analysis and survey for electric cars. It features a modern design with a car silhouette and a chart of data points. Use it to illustrate your research and analysis of the electric car market.
-
 Research Project Data Analysis Research Methodology Illustration
This coloured PowerPoint Illustration is perfect for representing a research project. It features a magnifying glass over a stack of books, symbolizing exploration and knowledge. The vibrant colours will make your slides stand out and draw attention to your research.
-
 Scout Search Engine Optimization Metadata Analysis Illustration
This colourful PowerPoint Illustration is perfect for presentations. It features a vibrant yellow background and a blue arrow pointing up. It is a great way to add a splash of colour to your presentation and draw attention to important points.
-
 Business Growth Strategic Planning Market Analysis Illustration
This coloured powerpoint icon is a great visual aid to illustrate your business growth roadmap. It features a modern design with vibrant colours and a clear roadmap structure, making it easy to understand and present. Its perfect for business presentations and reports, and can help you communicate your plans for growth.
-
 Comprehensive Analysis Of Different Data Lineage Illustration
This coloured PowerPoint icon is a visual representation of a comprehensive analysis of different data lineage classification. It is a helpful tool for understanding the complexities of data lineage and how it affects data processing. It is an ideal resource for data scientists and professionals alike.
-
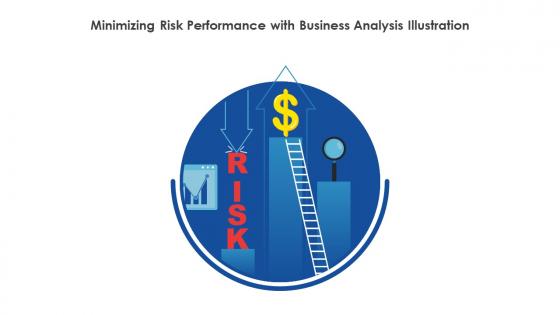 Minimizing Risk Performance With Business Analysis Illustration
This coloured PowerPoint icon is a visual representation of a comprehensive analysis of different data lineage classification. It is a helpful tool for understanding the complexities of data lineage and how it affects data processing. It is an ideal resource for data scientists and professionals alike.
-
 Data Research Analysis Collection Illustration
This coloured PowerPoint icon is perfect for presentations on data research. It features a magnifying glass and a graph, symbolizing the process of data collection and analysis. The vibrant colours make it stand out and help to convey the message quickly and effectively.
-
 Global Cloud Kitchen Platform Market Analysis Illustration
This colourful PowerPoint icon provides a comprehensive analysis of the global cloud kitchen platform market. It includes data on market size, segmentation, trends, growth drivers, and competitive landscape. Perfect for business presentations.
-
 Learning Process Knowledge Acquisition Data Analysis Illustration
This coloured powerpoint icon is the perfect visual aid to illustrate the learning process. It is vibrant and eye-catching, making it ideal for presentations or educational materials. It can be easily resized and edited to fit any project. Perfect for teachers, students, and professionals alike.
-
 CV Review Resume Analysis Job Application Illustration
This coloured powerpoint icon is perfect for CV review. It is easy to use and provides a visual representation of your CVs content. It is a great way to ensure your CV is up to date and accurate, helping you to stand out from the crowd.
-
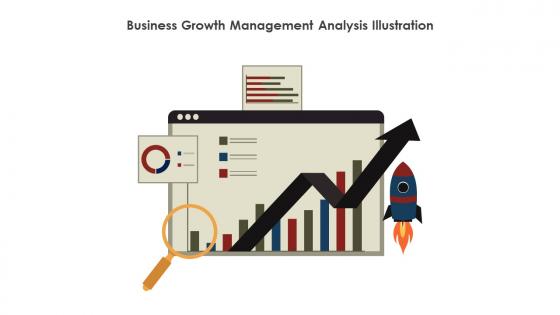 Business Growth Management Analysis Illustration
This coloured PowerPoint icon is the perfect visual representation of business growth management analysis. It is bright and eye-catching, making it an ideal addition to any presentation. The icon is easy to use and can help to illustrate the importance of business growth and management analysis.
-
 Man Sends Statistics Data Analysis Statistical Analysis Illustration
This coloured powerpoint icon is perfect for presentations on data analysis. It features a man in a suit holding a graph, representing the transmission of statistical information. It is a great visual aid to demonstrate the importance of data in decision making.
-
 Spectral Scanning Light Analysis Illustration
This coloured powerpoint Illustration depicts Spectral Scanning in Hyperspectral Imaging, a process that captures and analyses multiple wavelengths of light to identify and classify objects in an image.
-
 Competitor Analysis 3D Illustrations Investor Funding Elevator Pitch Deck
Following slide includes comparative assessment of icon designing company with its competitors. It includes key attributes such as features, founded year, location, company type, etc. Present the topic in a bit more detail with this Competitor Analysis 3D Illustrations Investor Funding Elevator Pitch Deck. Use it as a tool for discussion and navigation on Competitor Analysis. This template is free to edit as deemed fit for your organization. Therefore download it now.
-
 Working On Data Analysis Statistical Illustration
This colourful PowerPoint icon is perfect for presentations on working on analysis. It features a magnifying glass, a chart, and a pen, representing the process of researching and analysing data. Its a great visual aid to help explain your ideas.
-
 Stock Market Analysis Graph Illustration
This brightly coloured PowerPoint icon features a bold design that represents the fast-paced and dynamic world of the stock market. Perfect for presentations and reports related to finance, investments, and economics, this icon will add a professional touch to your slides and help your audience visualize complex concepts with ease.
-
 Artificial Intelligence Customer Behavior Analysis Illustration
This brightly coloured PowerPoint icon represents the implementation of machine learning in marketing. With its eye-catching design, it symbolizes the use of advanced technology to optimize marketing strategies and drive business success. Use this icon to showcase the integration of machine learning in your marketing presentations and materials
-
 Construction Data Analysis Illustration
This brightly coloured PowerPoint icon features a group of engineers hard at work on a construction site. With vibrant hues and detailed graphics, this icon is perfect for presentations related to engineering, construction, and teamwork. Add a pop of colour and professionalism to your slides with this eye-catching icon.
-
 Smart Shelves Consumer Behavior Analysis Illustration
Enhance your retail presentations with our vibrant IOT Smart Retail Supermarket PowerPoint icon. Featuring a modern design and eye-catching colours, this icon represents the integration of technology and retail for a more efficient and streamlined shopping experience. Perfect for showcasing the future of retail in your presentations.
-
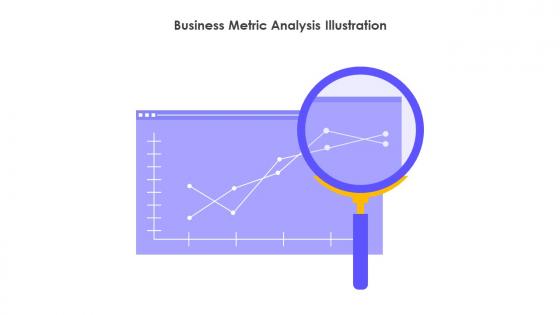 Business Metric Analysis Illustration
This vibrant PowerPoint icon features a magnifying glass and bar graph, representing data analysis. The bright colors and sleek design make it perfect for presentations on data analysis, statistics, and research. Add a professional touch to your slides with this eye-catching icon.
-
 One social marketing analysis illustration ppt sample
Presenting one social marketing analysis illustration ppt sample. This is a social marketing analysis illustration ppt sample. This is a four stage process. The stages in this process are research, strategize, implement, modify.
-
 Analyze Data Data Analysis Data Mining Illustration
This colourful PowerPoint icon depicts a person analyzing data. It is perfect for presentations about data analysis, data science, and data visualization. It can be used to illustrate the importance of data analysis and its impact on decision-making.
-
 Company Performance Gap Analysis Illustration
This colourful PowerPoint Illustration is an eye-catching visual representation of company performance. Its perfect for presentations and reports, and can be used to illustrate key performance indicators.
-
 Data Analysis Visualization Graphs Illustration
Brightly powerpoint Illustration with a bar graph to represent data visualization. Perfect for presentations, reports, and other documents to illustrate data points and trends.
-
 Magnifier Glass Analysis Illustration
This colourful PowerPoint Illustration is a perfect visual representation of the concept of analysis. It features a magnifying glass with a colourful background, making it a great addition to any presentation. Use it to emphasize the importance of research and data-driven decisions.
-
 AI Data Checking Machine Learning Automated Analysis Illustration
This coloured PowerPoint Illustration on Artificial Intelligence Data Checking is a perfect visual aid to help explain the concept of AI data verification. It is a great resource for presentations, lectures, and other educational materials. It is a simple yet powerful way to illustrate the importance of AI data checking.
-
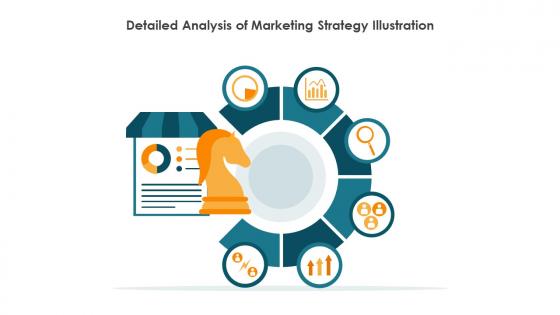 Detailed Analysis Of Marketing Strategy Illustration
This coloured PowerPoint Illustration is perfect for illustrating detailed analysis of marketing strategy. It features a graph with multiple bars of different colours to represent data and a magnifying glass to represent close examination of the data. It is a great visual tool to help explain complex marketing concepts.
-
 Guide For Situation Analysis To Develop Marketing Program Illustration
This coloured PowerPoint Illustration is an essential guide to help you analyze the current situation and develop a comprehensive marketing program. It provides an easy-to-follow process with visuals to help you assess the market, identify key stakeholders, and develop a strategy to reach your business goals.
-
 Detailed Analysis Of Marketing Research Market Segmentation Illustration
This coloured powerpoint Illustration is perfect for illustrating detailed analysis of marketing. It features a colourful graph, bar chart and pie chart, making it easy to understand complex marketing data. Its a great way to visually present your marketing analysis and make an impact.
-
 Market Analysis Research And Trends Illustration
This colourful PowerPoint Illustration is perfect for representing market analysis. It features a chart with an upward arrow and a dollar sign, illustrating growth and success. Use it to add a visual element to your presentations and documents.
-
 Target Audience Analysis Guide To Develop Marketing Strategies Illustration
This colourful PowerPoint Illustration provides a comprehensive guide to target audience analysis to help develop effective marketing strategies. It includes detailed information on how to identify target audiences, analyse their behaviour, and use insights to develop effective marketing plans.
-
 Customer Research Market Analysis Consumer Behavior Illustration
This coloured powerpoint Illustration is perfect for presentations on customer research. It features a magnifying glass and a chart, representing the process of gathering customer feedback. Its a great visual aid to help explain the importance of customer research.
-
 Effective Product Strategy Market Planning Analysis Illustration
This colourful PowerPoint Illustration is perfect for illustrating the importance of effective product strategy. It is a great visual aid to help explain the concept and can be used to highlight key points in a presentation.
-
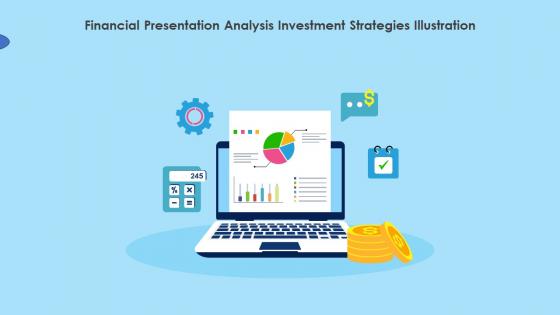 Financial Presentation Analysis Investment Strategies Illustration
This professionally designed PowerPoint Illustration is perfect for any Financial Presentation. It features a colourful design with a dollar sign, making it ideal for illustrating financial concepts. It is easy to use and can be quickly inserted into any presentation.
-
 Financial Statistics Economic Data Investment Analysis Illustration
This coloured PowerPoint Illustration is a visual representation of financial statistics. It features a graph with a blue line, a green bar, and a red arrow. The Illustration is ideal for presentations and reports related to financial data.
-
 Blood Test Slide Medical Diagnosis Laboratory Analysis Illustration
This coloured PowerPoint Illustration depicts a blood test slide, with a clear background and a red drop of blood in the centre. It is a great visual aid for presentations on medical topics, such as blood tests, blood donation, or diseases.
-
 Business Analysis Financials Report Illustration
This coloured powerpoint Illustration is perfect for business report presentations. It is eye catching and professional, and will help to bring your report to life. It is suitable for all types of business presentations, and is sure to make a lasting impression.
-
 Business Strategies Target Analysis Illustration
This vibrant coloured PowerPoint Illustration is perfect for representing business targets in presentations. It features a bullseye design with a bright yellow background and a red arrow pointing to the centre. Its a great visual aid for conveying your message in an engaging and memorable way.
-
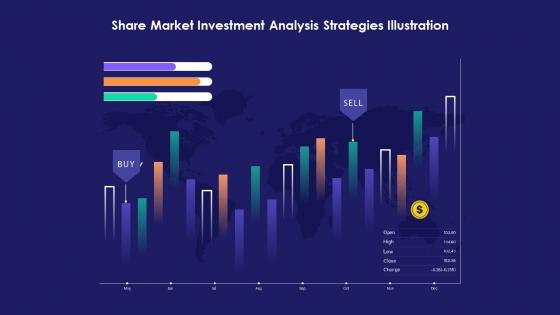 Share Market Investment Analysis Strategies Illustration
This coloured PowerPoint Illustration is perfect for creating professional presentations on Share Market Analysis. It features a vibrant design with a graph and a chart to illustrate the performance of the market. Its an ideal choice for business professionals and investors.
-
 Social Media Monitoring Web Traffic Analysis Illustration
This colourful PowerPoint Illustration is perfect for presentations on social media traffic analytics. It features a graph chart with multiple bars and a magnifying glass, representing the analysis of data. Ideal for business and marketing presentations.
-
 Marketing Research Consumer Insights Market Analysis Illustration
This coloured PowerPoint Illustration is perfect for presentations on marketing research. It features a magnifying glass and a graph, representing the process of gathering and analyzing data to make informed business decisions.
-
 Business Idea Analysis Plan Financial Modeling Illustration
This coloured PowerPoint Illustration is perfect for business idea analysis. It features a lightbulb, a graph and a magnifying glass, representing the process of brainstorming, researching and analyzing ideas. It is a great visual aid to help you present your business ideas.
-
 Business Strategy Corporate Planning Market Analysis Illustration
This PowerPoint Illustration features a colorful graphic of a lightbulb with a business strategy concept. It is perfect for presentations on business planning, goal setting, and strategic decision-making. Use it to bring life to your slides and make your message stand out.
-
 Creative Analysis Creative Thinking Ideation Illustration
This Creative Analysis PowerPoint Illustration is a vibrant, colourful representation of the creative process. It features a lightbulb, a magnifying glass, and a pencil, all in a bright, cheerful colour palette. Perfect for any creative project.
-
 Business Report Financial Analysis Market Research Illustration
This coloured PowerPoint Illustration is perfect for your business report. It is a bright and professional Illustration that will help to make your report stand out. It is easy to use and will add a touch of colour to your presentation.
-
 Data Analysis Data Mining Machine Learning Illustration
This colourful Illustration is perfect for data analysis presentations. It is a visual representation of data analysis, with a graph and magnifying glass to show the process of collecting and analyzing information. It is a great way to illustrate the importance of data analysis in business.
-
 Data Analytical Research Analysis Statistical Illustration
This colourful PowerPoint Illustration is perfect for illustrating data analytical research. It features a magnifying glass and a graph, representing the process of collecting and analyzing data. Its ideal for presentations, reports, and other documents.
-
 Graph Analysis Network Analysis Data Visualization Illustration
This coloured powerpoint Illustration is perfect for visualizing the results of your graph analysis. It features a graph with a colourful background, making it easy to interpret and understand. Perfect for presentations, reports and other documents.
-
 Icon illustrating decision tree analysis for user flow operations
Presenting this set of slides with name Icon Illustrating Decision Tree Analysis For User Flow Operations. This is a one stage process. The stage in this process is Icon Illustrating Decision Tree Analysis For User Flow Operations. This is a completely editable PowerPoint presentation and is available for immediate download. Download now and impress your audience.
-
 5c analysis illustrating organizational factors
Presenting this set of slides with name 5C Analysis Illustrating Organizational Factors. This is a five stage process. The stages in this process are Company, Customers, Competitors, Collaborators, Climate. This is a completely editable PowerPoint presentation and is available for immediate download. Download now and impress your audience.
-
 Icon illustrating result of stakeholder impact analysis
Presenting this set of slides with name Icon Illustrating Result Of Stakeholder Impact Analysis. This is a three stage process. The stages in this process are Icon Illustrating Result Of Stakeholder Impact Analysis. This is a completely editable PowerPoint presentation and is available for immediate download. Download now and impress your audience.
-
 Competitor matrix illustrating financial business analysis components
Presenting this set of slides with name Competitor Matrix Illustrating Financial Business Analysis Components. The topics discussed in these slides are Companies, Sales Revenue, Operating Income, Employee Count, Competitor. This is a completely editable PowerPoint presentation and is available for immediate download. Download now and impress your audience.
-
 2 ways arrows illustrating economy analysis
Presenting this set of slides with name 2 Ways Arrows Illustrating Economy Analysis. This is a two stage process. The stages in this process are 2 Ways Arrows Illustrating Economy Analysis. This is a completely editable PowerPoint presentation and is available for immediate download. Download now and impress your audience.
-
 Powerpoint templates with illustration project management button according swot analysis
If you are looking for an attention-grabbing template to amaze your audience, we present to you this Powerpoint Templates With Illustration Project Management Button According Swot Analysis. This pre-built PPT theme is all you require to keep your audience interested till the end. Highlight the presentations agenda and bring the focus points to be addressed by utilizing this unique layout. With this contemporary PowerPoint slide and technical expertise, you can highlight your creative side and stay ahead of your competitors. Deliver your content impactfully with the help of our Powerpoint Templates With Illustration Project Management Button According Swot Analysis. As this PPT is editable, various industries can take advantage of it and present them for productive brainstorming sessions with colleagues. You do not need to design the template from scratch, which saves a lot of time and increases productivity. Download this visually appealing PowerPoint theme for delivering the presentation impressively and gaining the confidence of the clients. Demonstrate your ideas with this well-crafted PPT template and amplify your success rate.
-
 Price comparison illustration for asset analysis infographic template
This is our Price Comparison Illustration For Asset Analysis Infographic Template designed in PowerPoint, however, you can also access it in Google Slides. It comes in two aspect ratios standard and widescreen, with fully editable visual content.


