Powerpoint Templates and Google slides for Analysis chart
Save Your Time and attract your audience with our fully editable PPT Templates and Slides.
-
 Cross functional flow charts kaizen implementation steps feasibility analysis cpb
Presenting this set of slides with name - Cross Functional Flow Charts Kaizen Implementation Steps Feasibility Analysis Cpb. This is an editable four graphic that deals with topics like Cross Functional Flow Charts, Kaizen Implementation Steps, Feasibility Analysis to help convey your message better graphically. This product is a premium product available for immediate download, and is 100 percent editable in Powerpoint. Download this now and use it in your presentations to impress your audience.
-
 Column chart economic analysis ppt diagram templates
Presenting this set of slides with name - Column Chart Economic Analysis Ppt Diagram Templates. This is two stage process. The stages in this process are Business, Column Chart, Analysis, Investment, Marketing.
-
 Our team percentage skills analysis chart
Presenting this set of slides with name - Our Team Percentage Skills Analysis Chart. This is a four stage process. The stages in this process are Our Team, Our Group, Our Members.
-
 Cost benefit analysis chart ppt infographic template example introduction
Presenting this set of slides with name - Cost Benefit Analysis Chart Ppt Infographic Template Example Introduction. This is a two stage process. The stages in this process are Benefits, Cost, Operating Cost, Marketing, Management.
-
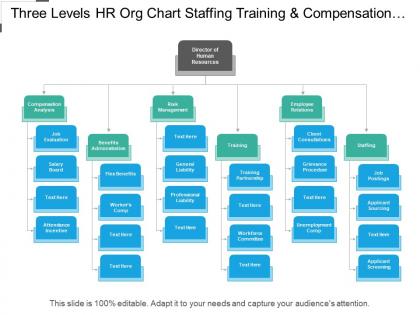 Three levels hr org chart staffing training and compensation analysis
Presenting this set of slides with name - Three Levels Hr Org Chart Staffing Training And Compensation Analysis. This is a three stage process. The stages in this process are Org Chart, Organization Chart, Project Team Structure.
-
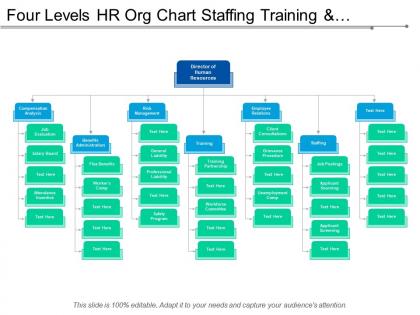 Four levels hr org chart staffing training and compensation analysis
Presenting this set of slides with name - Four Levels Hr Org Chart Staffing Training And Compensation Analysis. This is a seven stage process. The stages in this process are Org Chart, Organization Chart, Project Team Structure.
-
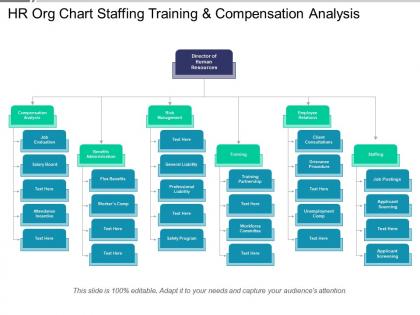 Hr org chart staffing training and compensation analysis
Presenting HR org chart staffing training and compensation analysis PPT template. User-friendly PowerPoint slides. Helps in saving your valuable time and effort. Easy to download and merge with your presentations. Makes sure to deliver a correct organizational and presentation motive. Enough space available to enter text and its related points in the PPT slide. Pictures do not pixelate when projected on Widescreen. Compatible with multiple formats like JPEG, PDF and Google slides. Perfect for sales management team, leaders, executives, managers, researchers, analysts, etc.
-
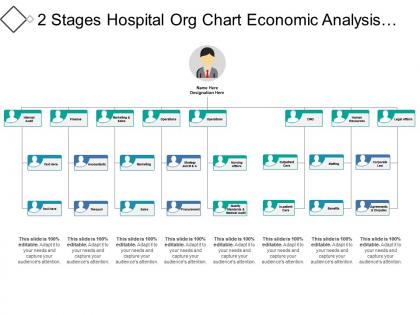 2 stages hospital org chart economic analysis budgeting and controlling
Presenting 2 stages hospital org chart economic analysis budgeting and controlling presentation slide. This PPT slide offers you plenty of space to put in titles and sub titles. High resolution based presentation layout, does not change the image even after resizing. This presentation icon is fully compatible with Google slides. Quick downloading speed and simple editing options in color text and fonts.PPT icons can easily be changed into JPEG and PDF applications. This diagram has been designed for entrepreneurs, corporate and business managers.
-
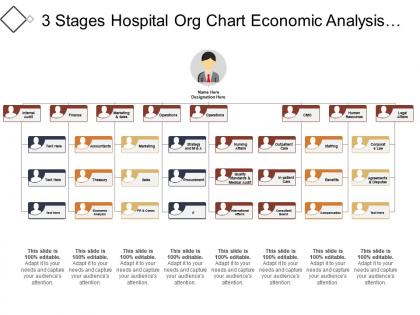 3 stages hospital org chart economic analysis budgeting and controlling
Presenting 3 stages hospital org chart economic analysis budgeting and controlling PPT slide. This PPT slide offers you plenty of space to put in titles and sub titles. High resolution based presentation layout, does not change the image even after resizing. This presentation icon is fully compatible with Google slides. Quick downloading speed and simple editing options in color text and fonts.PPT icons can easily be changed into JPEG and PDF applications. This diagram has been designed for entrepreneurs, corporate and business managers.
-
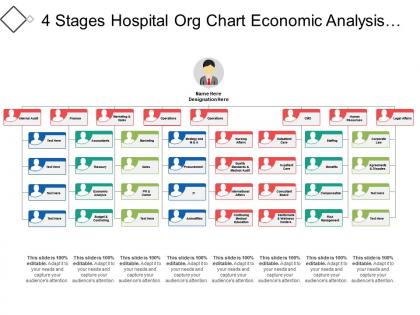 4 stages hospital org chart economic analysis budgeting and controlling
Presenting 4 Stages hospital org chart economic analysis budgeting and controlling PowerPoint slide. This PPT slide offers you plenty of space to put in titles and sub titles. High resolution based presentation layout, does not change the image even after resizing. This presentation icon is fully compatible with Google slides. Quick downloading speed and simple editing options in color text and fonts.PPT icons can easily be changed into JPEG and PDF applications. This diagram has been designed for entrepreneurs, corporate and business managers.
-
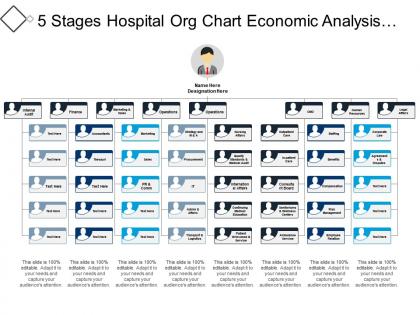 5 stages hospital org chart economic analysis budgeting and controlling
Presenting 5 stages hospital org chart economic analysis budgeting and controlling PPT slide. This PPT slide offers you plenty of space to put in titles and sub titles. High resolution based presentation layout, does not change the image even after resizing. This presentation icon is fully compatible with Google slides. Quick downloading speed and simple editing options in color text and fonts.PPT icons can easily be changed into JPEG and PDF applications. This diagram has been designed for entrepreneurs, corporate and business managers.
-
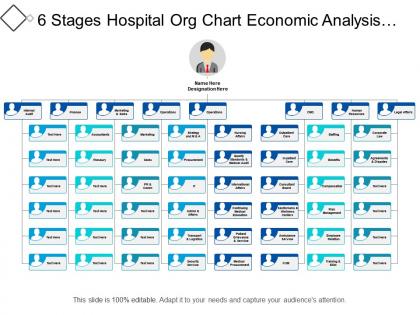 6 stages hospital org chart economic analysis budgeting and controlling
Presenting 6 Stages hospital org chart economic analysis budgeting and controlling PPT slide. Simple data input like company logo, name or trademark. This PowerPoint theme is fully supported by Google slides. Picture quality of these slides does not change even when project on large screen. Fast downloading speed and formats can be easily changed to JPEG and PDF applications. This template is suitable for marketing, sales persons, business managers and entrepreneurs. Adjust PPT layout, font, text and color as per your necessity
-
 8 levels hr org chart staffing training and compensation analysis
Presenting our 8 levels hr org chart staffing training and compensation analysis PowerPoint slide. Change PowerPoint slide structure, font, text, color and design as per your requirements. Easy data entry options to put in company logo, brand or name .Ideal for marketing professionals, business managers, entrepreneurs and big organizations. This presentation theme is totally in sync with Google slides. Easy conversion to other software’s like JPG and PDF formats. Image quality remains the unchanged even when resize the image or portray on large screens.
-
 Area chart finance marketing management investment analysis
Presenting this set of slides with name - Area Chart Finance Marketing Management Investment Analysis. This is a two stage process. The stages in this process are Finance, Marketing, Management, Investment, Analysis.
-
 Bar chart finance marketing management investment analysis
Presenting this set of slides with name - Bar Chart Finance Marketing Management Investment Analysis. This is a two stage process. The stages in this process are Finance, Marketing, Management, Investment, Analysis.
-
 Line chart finance marketing management investment analysis
Presenting this set of slides with name - Line Chart Finance Marketing Management Investment Analysis. This is a two stage process. The stages in this process are Finance, Marketing, Management, Investment, Analysis.
-
 Pie chart finance marketing management investment analysis
Presenting this set of slides with name - Pie Chart Finance Marketing Management Investment Analysis. This is a four stage process. The stages in this process are Post It, Notes, Marketing, Business, Management.
-
 Combo chart finance marketing management investment analysis
Presenting this set of slides with name - Combo Chart Finance Marketing Management Investment Analysis. This is a three stage process. The stages in this process are Finance, Marketing, Management, Investment, Analysis.
-
 Competitive analysis chart ppt powerpoint presentation infographic template inspiration cpb
Presenting this set of slides with name - Competitive Analysis Chart Ppt Powerpoint Presentation Infographic Template Inspiration Cpb. This is an editable six stages graphic that deals with topics like Competitive Analysis Chart to help convey your message better graphically. This product is a premium product available for immediate download, and is 100 percent editable in Powerpoint. Download this now and use it in your presentations to impress your audience.
-
 Analysis report pie chart line graph icon
Presenting this set of slides with name - Analysis Report Pie Chart Line Graph Icon. This is a three stage process. The stages in this process are Analysis Icon, Investigation Icon, Survey Icon.
-
 Column chart finance marketing management investment analysis
Presenting this set of slides with name - Column Chart Finance Marketing Management Investment Analysis. This is a two stage process. The stages in this process are Finance, Marketing, Management, Investment, Analysis.
-
 Stacked chart analysis ppt infographics design inspiration
Presenting this set of slides with name - Stacked Chart Analysis Ppt Infographics Design Inspiration. This is a three stage process. The stages in this process are Stacked Chart, Finance, Marketing, Analysis, Business.
-
 Detailed disaster impact analysis chart for it sector ppt powerpoint presentation file graphics download
Presenting this set of slides with name - Detailed Disaster Impact Analysis Chart For It Sector Ppt Powerpoint Presentation File Graphics Download. This is a four stages process. The stages in this process are Business, Management, Planning, Strategy, Marketing.
-
 Analysis chart ppt powerpoint presentation diagram graph charts cpb
Presenting this set of slides with name - Analysis Chart Ppt Powerpoint Presentation Diagram Graph Charts Cpb. This is an editable four stages graphic that deals with topics like Analysis Chart to help convey your message better graphically. This product is a premium product available for immediate download, and is 100 percent editable in Powerpoint. Download this now and use it in your presentations to impress your audience.
-
 Data collection and analysis control chart ppt styles icon
Presenting this set of slides with name - Data Collection And Analysis Control Chart Ppt Styles Icon. This is a three stage process. The stages in this process are Business, Management, Strategy, Analysis, Marketing.
-
 Data collection and analysis flow chart ppt styles gallery
Presenting this set of slides with name - Data Collection And Analysis Flow Chart Ppt Styles Gallery. This is a two stage process. The stages in this process are Business, Management, Strategy, Analysis, Marketing.
-
 Competitors analysis charts graphs to display data company profiles
Presenting this set of slides with name - Competitors Analysis Charts Graphs To Display Data Company Profiles. This is a five stage process. The stages in this process are Revenue, Sales Development, Performance Indicators, Finance, Marketing.
-
 Clustered bar chart analysis ppt powerpoint presentation summary
Presenting this set of slides with name - Clustered Bar Chart Analysis Ppt Powerpoint Presentation Summary. This is a three stages process. The stages in this process are Clustered Bar Chart, Finance, Marketing, Management, Investment.
-
 Cost benefit analysis chart profit increase ppt powerpoint presentation outline structure
Presenting this set of slides with name Cost Benefit Analysis Chart Profit Increase Ppt Powerpoint Presentation Outline Structure . The topics discussed in these slides are Marketing, Business, Management, Planning, Strategy. This is a completely editable PowerPoint presentation and is available for immediate download. Download now and impress your audience.
-
 Pie chart icon for employee analysis
Presenting this set of slides with name Pie Chart Icon For Employee Analysis. This is a three stage process. The stages in this process are Pie Chart Icon, Employee Analysis, Financial Analysis. This is a completely editable PowerPoint presentation and is available for immediate download. Download now and impress your audience.
-
 Pie chart icon for financial analysis
Presenting this set of slides with name Pie Chart Icon For Financial Analysis. This is a one stage process. The stages in this process are Pie Chart Icon, Employee Analysis, Financial Analysis. This is a completely editable PowerPoint presentation and is available for immediate download. Download now and impress your audience.
-
 Pie chart icon for growth analysis
Presenting this set of slides with name Pie Chart Icon For Growth Analysis. This is a one stage process. The stages in this process are Pie Chart Icon, Employee Analysis, Financial Analysis. This is a completely editable PowerPoint presentation and is available for immediate download. Download now and impress your audience.
-
 Pie chart icon of project analysis
Presenting this set of slides with name Pie Chart Icon Of Project Analysis. This is a three stage process. The stages in this process are Pie Chart Icon, Employee Analysis, Financial Analysis. This is a completely editable PowerPoint presentation and is available for immediate download. Download now and impress your audience.
-
 Analysis chart ppt powerpoint presentation outline mockup cpb
Presenting this set of slides with name Analysis Chart Ppt Powerpoint Presentation Outline Mockup Cpb. This is an editable Powerpoint four stages graphic that deals with topics like Analysis Chart to help convey your message better graphically. This product is a premium product available for immediate download and is 100 percent editable in Powerpoint. Download this now and use it in your presentations to impress your audience.
-
 Manufacturing chart analysis ppt powerpoint presentation show layout cpb
Presenting this set of slides with name Manufacturing Chart Analysis Ppt Powerpoint Presentation Show Layout Cpb. This is an editable Powerpoint four stages graphic that deals with topics like Manufacturing Chart Analysis to help convey your message better graphically. This product is a premium product available for immediate download, and is 100 percent editable in Powerpoint. Download this now and use it in your presentations to impress your audience.
-
 Detailed disaster impact analysis chart for it sector business goals ppt slides
Presenting this set of slides with name Detailed Disaster Impact Analysis Chart For It Sector Business Goals Ppt Slides. The topics discussed in these slides are Business Goals, Scenarios, database, Sensitive data, Server. This is a completely editable PowerPoint presentation and is available for immediate download. Download now and impress your audience.
-
 Detailed disaster impact analysis chart for it sector a630 ppt powerpoint presentation inspiration portrait
Presenting this set of slides with name Detailed Disaster Impact Analysis Chart For It Sector A630 Ppt Powerpoint Presentation Inspiration Portrait. The topics discussed in these slides are Business, Planning, Strategy, Marketing, Management. This is a completely editable PowerPoint presentation and is available for immediate download. Download now and impress your audience.
-
 Cost benefit analysis chart ppt powerpoint presentation file mockup
Presenting this set of slides with name Cost Benefit Analysis Chart Ppt Powerpoint Presentation File Mockup. The topics discussed in these slides are Business, Management, Planning, Strategy, Marketing. This is a completely editable PowerPoint presentation and is available for immediate download. Download now and impress your audience.
-
 Cost benefit analysis chart increase salary ppt powerpoint slides
Presenting this set of slides with name Cost Benefit Analysis Chart Increase Salary Ppt Powerpoint Slides. The topics discussed in these slides are Analysis Chart, Cost Benefit, Sales, Salary, Reduced Costs. This is a completely editable PowerPoint presentation and is available for immediate download. Download now and impress your audience.
-
 Cost benefit analysis chart ppt powerpoint presentation pictures shapes
Presenting this set of slides with name Cost Benefit Analysis Chart Ppt Powerpoint Presentation Pictures Shapes. The topics discussed in these slides are Marketing, Business, Management, Planning, Strategy. This is a completely editable PowerPoint presentation and is available for immediate download. Download now and impress your audience.
-
 Cost benefit analysis chart reduced costs ppt powerpoint presentation portfolio
Presenting this set of slides with name Cost Benefit Analysis Chart Reduced Costs Ppt Powerpoint Presentation Portfolio. The topics discussed in these slides are Marketing, Business, Management, Planning, Strategy. This is a completely editable PowerPoint presentation and is available for immediate download. Download now and impress your audience.
-
 Business bar graph financial analysis curve pie chart ppt icons graphics
Presenting business bar graph financial analysis curve pie chart ppt icons graphics. This Power Point icon template has been crafted with graphic of business bar graph , pie chart and business icons. This PPT diagram contains the concept of financial analysis. Use this icon template for business and finance related presentations.
-
 En pie chart inside the gear financial analysis flat powerpoint design
Presenting en pie chart inside the gear financial analysis flat powerpoint design. This Power Point template diagram has been crafted with graphic of pie chart and gear. This PPT diagram contains the concept of financial analysis representation .Use this PPT diagram for business and finance related presentations.
-
 Six colored tags with line chart analysis representation flat powerpoint design
PPT slide runs jitter free on all related software. PPT design slides can be downloaded very easily. Extra customization power by inserting your company’s logo, trademark. Zero space constraints. Graphics never pixelate once projected on widescreen. Add title and sub-title with ease. Slides compatible with Google slides. Convert to JPG/PDF formats in moments. Useful for businesses, startups and education institutes.
-
 Analytical curve chart for year based analysis flat powerpoint design
We are proud to present our analytical curve chart for year based analysis flat powerpoint design. This PPT diagram contains the graphic of analytical curve. This PPT diagram can be used for year based analysis for business and marketing results. Use this PPT diagram and build a professional presentation.
-
 Year based topic analysis chart business agenda flat powerpoint design
Performance and result oriented PPT presentation slides. Capable of displaying vast information under a single screen view. Non-pixelation of the graphics even after viewing on wide screens. Allows ungrouping and orientation of the objects. Enables easy processing and modification without any hassles. Can be conveniently merged with your reports to provide outstanding performance.
-
 Six staged pie chart for financial analysis flat powerpoint design
We are proud to present our six staged pie chart for financial analysis flat powerpoint design. Graphic of six staged pie chart has been used to design this power point template diagram. This PPT diagram contains the concept of financial analysis representation .Use this PPT diagram for business and finance related presentations.
-
 Bar chart with result analysis variation flat powerpoint design
High quality visual PowerPoint graphics, Rework able contents, symbols, formats and PowerPoint Image etc., 100% accuracy with an enough space availability to replace dummy statistics and add company emblem ,trademark or name, Well adaptable with all Google slides and relevant software’s, Can be diversified into divergent layouts like PDF or JPG, Quite handy for business experts, managers, students etc.
-
 Stopwatch with pie chart for data and result analysis flat powerpoint design
Basic theme yet it can modified with respect to font, color and layout. Attractive and professional color scheme. PPT graphic offers font size which can be read from a distance. High resolution is offered by the presentation slide show. Easy to download and instant use of pre designed PPT layout adds to its advantage. High color resolution offered by PPT. PPT layout is beneficial for businessmen, project managers for business and managerial purposes.
-
 Flow chart with process analysis diagram flat powerpoint design
We are proud to present our flow chart with process analysis diagram flat powerpoint design. Graphic of low chart has been used to design this power point template diagram. This PPT diagram contains the concept of process analysis. Use this PPT diagram for business and marketing related presentations.
-
 Kd checklist star quality analysis chart flat powerpoint design
Easy and fast hassle free download. Totally editable color scheme, contrast, orientation and sizes of PPT icons. Undiminished original resolution of PPT infographics on editing. Absolutely editable text without length constraint to suit the context. Insert your brand name, logo, tagline, trademark etc. Images do not pixelate when projected on wide screen. Perfectly suited for sales and marketing professionals, managers, designers etc.
-
 Qe circular chart financial analysis with team management flat powerpoint design
Presenting qe circular chart financial analysis with team management flat powerpoint design. This Point Point template diagram has been crafted with graphic of circular chart. This PPT diagram contains the concept of financial analysis and team management. This PPT diagram can be used for business and finance related presentations.
-
 Qm financial analysis chart with icons flat powerpoint design
Presenting qm financial analysis chart with icons flat powerpoint design. This Point template diagram has been crafted with graphic of financial chart and icons. This PPT diagram contains the concept of financial result analysis. This PPT diagram can be used for business and finance related presentations.
-
 Bd multilevel management chart for analysis flat powerpoint design
Use of high-resolution images in the slide icons. Compatible with the Google Slides or MS Office PowerPoint programs. Easy to edit and download. Trouble-free replacement of your company’s logo. Access to open on a big screen display. Provided instructions to edit and modify the slide icon. Beneficial for the marketing professionals and the business managers.
-
 Business partnership profit sharing analysis pie chart ppt icons graphics
Operate this slide in any software smoothly. Uncomplicated download and use of slide. Company logo, trademark or name can be added for more specificity. Widescreen projection of slides doesn’t let PPT graphics get pixelated. compatible with google slides. Mention titles and sub titles without feeling constrained in terms of space. High resolution PPT slides. Useful in businesses, small and large.
-
 Top of mountain success growth chart information data analysis ppt icons graphics
Presenting top of mountain success growth chart information data analysis ppt icons graphics. This Power Point icon template diagram has been crafted with graphic of growth chart and mountain icons. This icon template contains the concept of success and data analysis .Use this icon template for business and marketing related presentations.
-
 Bar graph pie chart growth arrow analysis ppt icons graphics
This slide is created for executives looking for growth and strategies analysis through bar and pie chart designs. This template contains, modifiable background, color layout, font. Relevant content with flexible data. Easily converted into PDF and JPG format. Alluring graphs for comparison as well as to illustrate the various figure. Availed for corporate people, students, and researchers.
-
 Data analysis resume pie chart customer support ppt icons graphics
We are proud to present our data analysis resume pie chart customer support ppt icons graphics. Concept of data analysis and customer support has been displayed in this power point icon template diagram. This icon template contains the graphic of resume, pie chart and customer support icons. Use this icon template for business and data related presentations.
-
 Growth analysis dollar money pie chart shop ppt icons graphics
We are proud to present our growth analysis dollar money pie chart shop ppt icons graphics. Concept of growth analysis can be defined with this power point icon template diagram. This PPT diagram contains the graphic of growth, dollar and money with pie chart icons. Use this icon template for business and finance related presentations.
-
 Growth bar graph chart business data analysis ppt icons graphics
We are proud to present our growth bar graph chart business data analysis ppt icons graphics. Concept of data analysis can be defined with this power point icon template diagram. This PPT diagram contains the graphic of bar graph, money and chart icons. Use this icon template for business and finance related presentations.


