Powerpoint Templates and Google slides for Analysis And Data
Save Your Time and attract your audience with our fully editable PPT Templates and Slides.
-
 Data landscape analysis infrastructure analytics and visualization
Presenting data landscape analysis infrastructure analytics and visualization. This is a data landscape analysis infrastructure analytics and visualization. This is a four stage process. The stages in this process are data landscape, big data machine learning, artificial intelligence.
-
 Data preparation sourcing mapping output and analysis
Presenting this set of slides with name - Data Preparation Sourcing Mapping Output And Analysis. This is a three stage process. The stages in this process are Data Preparation, Data Management, Data Mapping.
-
 Portfolio analysis covering physical data simulate and perform
Presenting this set of slides with name - Portfolio Analysis Covering Physical Data Simulate And Perform. This is a four stage process. The stages in this process are Portfolio Analysis, Portfolio Management, Portfolio Review.
-
 Data and analysis powerpoint slide images
Presenting this set of slides with name - Data And Analysis Powerpoint Slide Images. This is a six stage process. The stages in this process are Root Cause Analysis, Opportunity Analysis, Timeline Analysis, Force Field Analysis, Sipoc Analysis.
-
 Technology layers showing process application and data analysis
Presenting this set of slides with name - Technology Layers Showing Process Application And Data Analysis. This is a seven stage process. The stages in this process are Technology Layers, Osi Model, Internetworking Layer.
-
 1114 colored graph for business and finance data analysis powerpoint template
We are proud to present our 1114 colored graph for business and finance data analysis powerpoint template. This Power Point template slide has been crafted with graphic of colored bar graph. This PPT slide contains the concept of data analysis. This PPT slide can be used for business and finance data analysis.
-
 0115 tip of iceberg big data problems and analysis ppt slide
Creative and Innovative PowerPoint presentation design. Equipped with numerous beneficial qualities required for a successful presentation. The quality is well appreciated by the high-profile businesses. These can be easily tailored without putting much effort. Presentation slide comes in standard and widescreen view. Easily transformable into JPEG and PDF document.
-
 0115 understand big data metrics and analysis showing by magnifying glass ppt slide
Results and data oriented slides. PowerPoint template has extraordinary quality to impose a long-lasting impression. PPT comes with easy instructions for any modifications. Slide can be easily inserted in an ongoing presentation. These are compatible with google framework. These do not need much time and effort for their operation.
-
 0115 3 vs of big data showing challenges and complexity of analysis ppt slide
Runs evenly on all slide compatible software. Straightforward and simple conversion to JPG and PDF formats. Graphics pixelation does not occur when projected on widescreen. Compatible with google slides for better visibility over other media. High resolution PPT graphics. Append company logo, trademark, name with no issues. No space constraints when adding titles and sub titles. Useful in businesses, startups.
-
 0115 big data analysis from feed of zeros and ones 0s and 1s magnifying glass ppt slide
We are proud to present our 0115 big data analysis from feed of zeros and ones 0s and 1s magnifying glass ppt slide. This power point template slide has been crafted with graphic of magnifier and data encryption. This magnifier is magnifying the data for data analysis. This PPT can be used for data technology related presentations.
-
 Four business and management data analysis flat powerpoint design
We are proud to present our four business and management data analysis flat powerpoint design. Graphic of four colored tags has been used to design this power point template diagram. This diagram PPT contains the concept of business and management analysis. Use this professional PPT and make quality presentation for your viewers.
-
 Science data calculation and analysis flat powerpoint design
We are proud to present our science data calculation and analysis flat powerpoint design. Three glass beakers has been used to craft this power point template diagram. This PPT diagram contains the concept of science data calculation and analysis. Use this PPT diagram for science related presentations.
-
 Data and result analysis chart flat powerpoint design
Visually appealing PPT presentation layouts. Compatible with google slides. Offers easy and instant downloading. Allows orientation of objects to alter the appearance. Can be utilized by investors, entrepreneurs, clients, students and customers. Capable of easily grabbing the viewers’ attention. Delivers an accurate and precise message.
-
 Financial data analysis and management flat powerpoint design
We are proud to present our financial data analysis and management flat powerpoint design. This power point template has been crafted with graphic of triangular bar graph. This PPT diagram contains the concept of financial data analysis and management. Use this PPT diagram for finance related topics.
-
 Overlapping timeline showing planning data analysis design implement and release
Presenting overlapping timeline showing planning data analysis design implement and release presentation slide design layout. Astounding utilization of symbols, pictures, and plans. Customize the content, symbols, hues design according to the need. Appropriate for use by chiefs, representatives, and associations for the master understanding. This PPT deck is totally perfect with Google Slides and can be spared in JPG or PDF arrange with no trouble. Great illustrations and symbols guarantee that there is no devaluing plan while anticipating to a widescreen. Brisk download right away. You can access the template with various nodes.
-
 Overlapping timeline showing planning data analysis governance and release
Presenting our overlapping timeline showing planning data analysis governance and release PPT deck. This is a five-stage process, fit for use by managers, employees, and organizations. This PPT design is readily editable with attractive color, layout, font type, font size, and text. Quickly convertible into PDF and JPG format. Content is ready to apply and is flexible and fit to be projected on a wide screen. This pattern is available in 4:3 and full-screen version 16:9. Use with Google Slides fo ease of use.
-
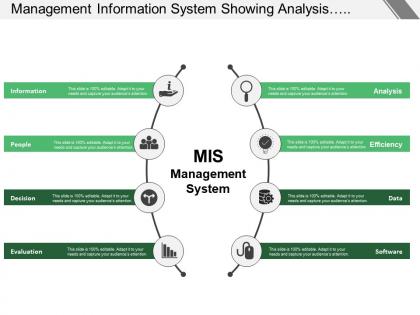 Management information system showing analysis efficiency and data
Presenting this set of slides with name - Management Information System Showing Analysis Efficiency And Data. This is a eight stage process. The stages in this process are Management Information System, Mis, Decision Making System.
-
 Data mine data analysis process explore and visualize data
Presenting this set of slides with name - Data Mine Data Analysis Process Explore And Visualize Data. This is a five stage process. The stages in this process are Build Model, Generate Results And Optimize, Validate Results, Process And Clean Data, Data Mine.
-
 Predictive analytics steps with data collection and analysis
Presenting Predictive Analytics Steps With Data Collection And Analysis PPT slide. The editable business Data Collection PowerPoint template designed to illustrate the data that collected to perform some activity. The partition slide is compatible with Google Slide which helps you to share it with others via the internet easily. You can do modification in the font size, font type, and you can change the color, size, and shapes of the icon of analytic steps slide. SlideTeam offers you editable text business data collection analysis template.
-
 Qualitative data analysis with aim techniques and size
SlideTeam presents its new PowerPoint template named Qualitative Data Analysis with Aim Techniques and Size. This slideshow can be viewed in 4:3 standard screen size and 16:9 widescreen size. These slides are fully compatible with Google Slides. This slideshow is entirely customizable according to your liking. You can resize the shapes or change the color, size and orientation of any graphic. Adapt it to your needs and capture your audience’s attention. You can download this template in JPEG and PDF format.
-
 Knowledge management proposal demand and supply analysis data management functions cpb
Presenting this set of slides with name - Knowledge Management Proposal Demand And Supply Analysis Data Management Functions Cpb. This is an editable two stages graphic that deals with topics like Knowledge Management Proposal, Demand And Supply Analysis, Data Management Functions to help convey your message better graphically. This product is a premium product available for immediate download, and is 100 percent editable in Powerpoint. Download this now and use it in your presentations to impress your audience.
-
 Business intelligence data analysis and strategy process pyramid
Presenting this set of slides with name - Business Intelligence Data Analysis And Strategy Process Pyramid. This is a five stage process. The stages in this process are Business Intelligence Process, Business Development Process, BI Procedure.
-
 Data collection and analysis control chart ppt styles icon
Presenting this set of slides with name - Data Collection And Analysis Control Chart Ppt Styles Icon. This is a three stage process. The stages in this process are Business, Management, Strategy, Analysis, Marketing.
-
 Data collection and analysis flow chart ppt styles gallery
Presenting this set of slides with name - Data Collection And Analysis Flow Chart Ppt Styles Gallery. This is a two stage process. The stages in this process are Business, Management, Strategy, Analysis, Marketing.
-
 Jidoka line stop and big data analysis ppt powerpoint presentation file model
Presenting this set of slides with name Jidoka Line Stop And Big Data Analysis Ppt Powerpoint Presentation File Model. This is a three stage process. The stages in this process are Opportunity, Business, Management, Planning, Strategy. This is a completely editable PowerPoint presentation and is available for immediate download. Download now and impress your audience.
-
 Data migration powerpoint template and data analysis ppt powerpoint slides
Presenting this set of slides with name Data Migration Powerpoint Template And Data Analysis Ppt Powerpoint Slides. This is a six stage process. The stages in this process are Marketing, Business, Management, Planning, Strategy. This is a completely editable PowerPoint presentation and is available for immediate download. Download now and impress your audience.
-
 Organization effectiveness model and services data analysis ppt slides
Presenting this set of slides with name Organization Effectiveness Model And Services Data Analysis Ppt Slides. This is a four stage process. The stages in this process are Organization Effectiveness Model Services, Strategy Development, Action Planning, Data Analysis, Icons. This is a completely editable PowerPoint presentation and is available for immediate download. Download now and impress your audience.
-
 Data collection and analysis market ppt powerpoint presentation tips
Presenting this set of slides with name Data Collection And Analysis Market Ppt Powerpoint Presentation Tips. This is a four stage process. The stages in this process are Data Collection, Analysis, Market, Business, Management. This is a completely editable PowerPoint presentation and is available for immediate download. Download now and impress your audience.
-
 Four staged colored ribbons for data and analysis flat powerpoint design
We are proud to present our four staged colored ribbons for data and analysis flat powerpoint design. This power point template diagram has been crafted with graphic of four staged colored ribbons. This PPT diagram contains the concept of business data analysis representation. Use this PPT diagram for business and marketing related presentations.
-
 Stopwatch with pie chart for data and result analysis flat powerpoint design
Basic theme yet it can modified with respect to font, color and layout. Attractive and professional color scheme. PPT graphic offers font size which can be read from a distance. High resolution is offered by the presentation slide show. Easy to download and instant use of pre designed PPT layout adds to its advantage. High color resolution offered by PPT. PPT layout is beneficial for businessmen, project managers for business and managerial purposes.
-
 Ups and downs of business time management data analysis ppt icons graphics
We are proud to present our ups and downs of business time management data analysis ppt icons graphics. Concept of time management and data analysis can been defined with this power point icon template. This power point icon template contains the graphic of ups, downs and data icons. Use this icon template for business and marketing related presentations.
-
 New four arrows data and process analysis diagram flat powerpoint design
Presenting new four arrows data and process analysis diagram flat powerpoint design. Presenting new four arrows data and process analysis diagram flat powerpoint design. This Power Point template diagram has been crafted with graphic of four arrows diagram. This PPT diagram contains the concept of data and process analysis. Use this PPT diagram for business and finance related presentations.
-
 Apt four tags for data specific study and analysis flat powerpoint design
Presenting apt four tags for data specific study and analysis flat powerpoint design. This Power Point template diagram has been crafted with graphic of four tags diagram. This PPT diagram contains the concept of data specific study and analysis. Use this PPT diagram for business and marketing related presentations.
-
 Pptx five staged tags for data compare and analysis flat powerpoint design
Presenting pptx five staged tags for data compare and analysis flat powerpoint design. Presenting pptx five staged tags for data compare and analysis flat powerpoint design. This Power Point template diagram has been crafted with graphic of five staged tags and icons. This PPT diagram contains the concept of data comparison and analysis. Use this PPT diagram can be used for business and technology related presentations.
-
 Business data and result analysis chart powerpoint slides
Presenting business data and result analysis chart powerpoint slides. This Power Point template slide has been crafted with graphic of business data chart. This PPT diagram slide contains the concept of business result analysis. Use this PPT slide for business and marketing related presentations.
-
 Card swap financial data and statistics analysis ppt icons graphics
Presenting card swap financial data and statistics analysis ppt icons graphics. This Power Point template icons slide has been crafted with graphic of card swap and finance icons. This icon PPT contains the concept of financial data analysis. Use this icon PPT for business and finance related presentations.
-
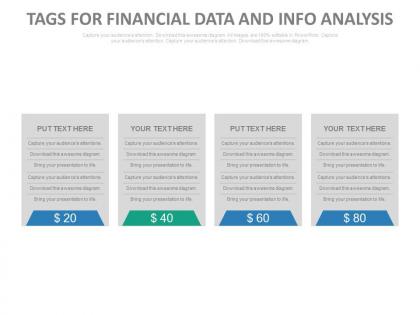 Four tags for financial data and info analysis powerpoint slides
Presenting four tags for financial data and info analysis powerpoint slides. This Power Point template slide has been crafted with graphic of four tags. This PPT slide contains the concept of financial data and info analysis. Use this PPT slide for business and finance related presentations.
-
 Business team for data analysis and support powerpoint slides
Unique presentation of business concept. Adjustable with multiple topics related to sales and marketing. Compatible with numerous format options. Harmonious with big set of software. High resolution. No issue of pixilation when projected on wide screen. 100 percent editable. Modify the slide content as per individual preference. Personalize the presentation with company name and logo. Used by marketers, financiers, HR professionals, sales people, students and teachers.
-
 Data collection and analysis control chart powerpoint templates
Presenting data collection and analysis control chart powerpoint templates. This is a data collection and analysis control chart powerpoint templates. This is a one stage process. The stages in this process are upper limit, plotted points, lower limit, centerline, plot scale, point labels.
-
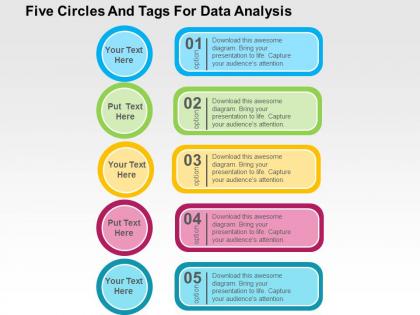 Five circles and tags for data analysis flat powerpoint design
We are proud to present our five circles and tags for data analysis flat powerpoint design. This power point template diagram has been crafted with graphic of five circles and tags. This PPT diagram contains the concept of data analysis. Use this PPT diagram for business and data related presentations for your viewers.
-
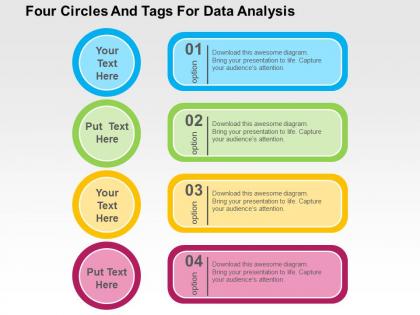 Four circles and tags for data analysis flat powerpoint design
We are proud to present our four circles and tags for data analysis flat powerpoint design. Graphic of four circles and tags has been used to decorate this power point template diagram. This PPT diagram contains the concept of data analysis. Use this PPT diagram for business and data related presentations.
-
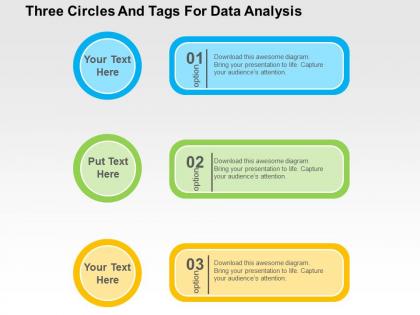 Three circles and tags for data analysis flat powerpoint design
We are proud to present our three circles and tags for data analysis flat powerpoint design. Graphic of three circles and tags has been used to craft this power point template diagram. This PPT diagram contains the concept of data analysis. Use this PPT diagram for data and business related presentations.
-
 Data driven pie chart and donuts for analysis powerpoint slides
Presenting data driven pie chart and donuts for analysis PowerPoint template. High-resolution PowerPoint presentation backgrounds for better clarity of the information displayed. Offers wide variety of options and colors to alter the appearance. Allows adding of enterprise personal details such as brand name, logo and much more. Enough space available to enter text and its related points in the PPT table. This PPT Slide is available in both Standard and Widescreen slide size. Compatible with multiple formats like JPEG, PDF and Google slides.
-
 Pie chart and line chart data driven analysis powerpoint slides
PowerPoint Template for professionals for pie chart and line chart data driven analysis. Highly beneficial for professionals from diverse companies. Editable charts, colors and text. Adequate space available in each PowerPoint slide to insert text as desired. Manual option available to alter color or PowerPoint image. Simply click to add company logo, trademark or name.
-
 Statistical data analysis marketing powerpoint templates ppt themes and graphics 0313
We are proud to present our statistical data analysis marketing powerpoint templates ppt themes and graphics 0313. Channelise the thoughts of your team with our Success Powerpoint Templates. Urge them to focus on the goals you have set. Give impetus to the hopes of your colleagues. Our Design Powerpoint Templates will aid you in winning their trust.
-
 Data driven 3d business intelligence and data analysis powerpoint slides
We are proud to present our data driven 3d business intelligence and data analysis powerpoint slides. A bar graph is composed of discrete bars that represent different categories of data. The length or height of the bar is equal to the quantity within that category of data. Bar graphs are best used to compare values across categories.
-
 1013 statistical data analysis in marketing powerpoint templates ppt themes and graphics
We are proud to present our 1013 statistical data analysis in marketing powerpoint templates ppt themes and graphics. You Are An Avid Believer In Ethical Practices. Highlight The Benefits That Accrue With Our Finance Power Point Templates. Set Your Controls For The Heart Of The Sun. Our Marketing Power Point Templates Will Be The Propellant To Get You There.
-
 Statistical data analysis in marketing powerpoint templates ppt themes and graphics 0313
We are proud to present our statistical data analysis in marketing powerpoint templates ppt themes and graphics 0313. You are an avid believer in ethical practices. Highlight the benefits that accrue with our Statistical Data Analysis In Marketing PowerPoint Templates PPT Themes And Graphics 0313 Set your controls for the heart of the sun.
-
 1214 data driven bar graph and pie chart for analysis powerpoint slide
We are proud to present our 1214 data driven bar graph and pie chart for analysis powerpoint slide. This Power point template slide has been crafted with graphic of bar graph and pie chart . These graph and charts are data driven. Display any analysis with this exclusive PPT slide and build professional presentation.
-
 1114 globe and bar graph for data analysis image graphics for powerpoint
We are proud to present our 1114 globe and bar graph for data analysis image graphics for powerpoint. Graphic of globe and bar graph has been used to decorate this power point template. This PPT contains the concept of data analysis. Use this PPt for your global business and data related topics to get good remarks from your viewers.
-
 Client Testimonials Qualitative And Quantitative Research Data Analysis One Pager Sample Example Document
This is a One Pager designed in Powerpoint titled Client Testimonials Qualitative And Quantitative Research Data Analysis One Pager Sample Example Document. It is crafted using high-quality visuals that can be readjusted in PowerPoint and Google Slides. This template comes in an editable format and is available in A4 size format for immediate download.
-
 Qualitative And Quantitative Research Data Analysis Cost Structure One Pager Sample Example Document
This is a One Pager designed in Powerpoint titled Qualitative And Quantitative Research Data Analysis Cost Structure One Pager Sample Example Document. It is crafted using high-quality visuals that can be readjusted in PowerPoint and Google Slides. This template comes in an editable format and is available in A4 size format for immediate download.
-
 Qualitative And Quantitative Research Data Analysis Team Structure One Pager Sample Example Document
This is a One Pager designed in Powerpoint titled Qualitative And Quantitative Research Data Analysis Team Structure One Pager Sample Example Document. It is crafted using high-quality visuals that can be readjusted in PowerPoint and Google Slides. This template comes in an editable format and is available in A4 size format for immediate download.
-
 Competitive analysis by operational and financial data ppt powerpoint presentation infographics file
The slide provides the Competitive landscape of the company on the basis of companys size i.e. number of users, revenue, app downloads, user traffic, social media followers etc. Presenting this set of slides with name Competitive Analysis By Operational And Financial Data Ppt Powerpoint Presentation Infographics File. The topics discussed in these slides are Competitive Factor, Year Of Existence, Locations, Major Product Service, Quality Consumer Feedback, Interest Rate, Sales, Profit. This is a completely editable PowerPoint presentation and is available for immediate download. Download now and impress your audience.
-
 Competitive analysis by financial and operational data ppt powerpoint presentation slides samples
The slide provides the Competitive landscape of the company on the basis of financial data sales and profit and operational data employee count, locations, year of existence etc. Presenting this set of slides with name Competitive Analysis By Financial And Operational Data Ppt Powerpoint Presentation Slides Samples. The topics discussed in these slides are Year Of Ecxistene, Locations Number Of Outlets, Major Product Service, Quality Consumer Feedback, Sales, Profit Margin, Employee Count. This is a completely editable PowerPoint presentation and is available for immediate download. Download now and impress your audience.
-
 Data contract and analysis lifecycle process
Presenting this set of slides with name Data Contract And Analysis Lifecycle Process. This is a nine stage process. The stages in this process are Secured Central Repository, Track Important Data Fields, Attach And Search Files, Draft Language From Templates, Permission Based Tasks And Workflow. This is a completely editable PowerPoint presentation and is available for immediate download. Download now and impress your audience.
-
 Data manipulation and analysis toolkit for ba
Presenting this set of slides with name Data Manipulation And Analysis Toolkit For BA. This is a four stage process. The stages in this process are MS Excel, SWOT, R Data Manipulation, Microsoft Word. This is a completely editable PowerPoint presentation and is available for immediate download. Download now and impress your audience.
-
 Test and learn process with data analysis
Presenting this set of slides with name Test And Learn Process With Data Analysis. This is a five stage process. The stages in this process are Data Analysis, Hypothesis, Develop Test Content, Test, Evaluate. This is a completely editable PowerPoint presentation and is available for immediate download. Download now and impress your audience.
-
 Information lifecycle model with data acquisition and analysis
Presenting this set of slides with name Information Lifecycle Model With Data Acquisition And Analysis. The topics discussed in these slides are Business, Data Source, Environment, Deployment, Customer, Performance, Model Evaluation. This is a completely editable PowerPoint presentation and is available for immediate download. Download now and impress your audience.
-
 Competitive analysis by operational and financial data quality consumer feedback sales ppt slides
The slide provides the Competitive landscape of the company on the basis of financial data sales and profit and operational data employee count, locations, year of existence etc. Presenting this set of slides with name Competitive Analysis By Operational And Financial Data Quality Consumer Feedback Sales Ppt Slides. The topics discussed in these slides are Profit, Sales, Interest Rate, Quality, Locations. This is a completely editable PowerPoint presentation and is available for immediate download. Download now and impress your audience


