Powerpoint Templates and Google slides for Analysis And Charts
Save Your Time and attract your audience with our fully editable PPT Templates and Slides.
-
 Business diagram chart flow of market analysis for growth and success powerpoint slides
We are proud to present our business diagram chart flow of market analysis for growth and success powerpoint slides. Visually support your Microsoft office PPT Presentation with our above template illustrating a flow diagram. Use this diagram to show a progression or sequential steps in a task, process, or workflow easily. Embellish your thoughts by using our PPTs. They will help you illustrate the brilliance of your ideas.
-
 Earned Value Analysis Chart In Powerpoint And Google Slides Cpb
Presenting Earned Value Analysis Chart In Powerpoint And Google Slides Cpb slide which is completely adaptable. The graphics in this PowerPoint slide showcase three stages that will help you succinctly convey the information. In addition, you can alternate the color, font size, font type, and shapes of this PPT layout according to your content. This PPT presentation can be accessed with Google Slides and is available in both standard screen and widescreen aspect ratios. It is also a useful set to elucidate topics like Earned Value Analysis Chart. This well-structured design can be downloaded in different formats like PDF, JPG, and PNG. So, without any delay, click on the download button now.
-
 Stock Chart Patterns Analysis In Powerpoint And Google Slides Cpb
Presenting Stock Chart Patterns Analysis In Powerpoint And Google Slides Cpb slide which is completely adaptable. The graphics in this PowerPoint slide showcase three stages that will help you succinctly convey the information. In addition, you can alternate the color, font size, font type, and shapes of this PPT layout according to your content. This PPT presentation can be accessed with Google Slides and is available in both standard screen and widescreen aspect ratios. It is also a useful set to elucidate topics like Stock Chart Patterns Analysis. This well structured design can be downloaded in different formats like PDF, JPG, and PNG. So, without any delay, click on the download button now.
-
 Crypto Analysis Chart In Powerpoint And Google Slides Cpb
Presenting our Crypto Analysis Chart In Powerpoint And Google Slides Cpb PowerPoint template design. This PowerPoint slide showcases four stages. It is useful to share insightful information on Crypto Analysis Chart. This PPT slide can be easily accessed in standard screen and widescreen aspect ratios. It is also available in various formats like PDF, PNG, and JPG. Not only this, the PowerPoint slideshow is completely editable and you can effortlessly modify the font size, font type, and shapes according to your wish. Our PPT layout is compatible with Google Slides as well, so download and edit it as per your knowledge.
-
 Live Stock Charts Technical Analysis In Powerpoint And Google Slides Cpb
Presenting Live Stock Charts Technical Analysis In Powerpoint And Google Slides Cpb slide which is completely adaptable. The graphics in this PowerPoint slide showcase four stages that will help you succinctly convey the information. In addition, you can alternate the color, font size, font type, and shapes of this PPT layout according to your content. This PPT presentation can be accessed with Google Slides and is available in both standard screen and widescreen aspect ratios. It is also a useful set to elucidate topics like Live Stock Charts Technical Analysis. This well-structured design can be downloaded in different formats like PDF, JPG, and PNG. So, without any delay, click on the download button now.
-
 Charting Technical Analysis In Powerpoint And Google Slides Cpb
Presenting our Charting Technical Analysis In Powerpoint And Google Slides Cpb PowerPoint template design. This PowerPoint slide showcases four stages. It is useful to share insightful information on Charting Technical Analysis This PPT slide can be easily accessed in standard screen and widescreen aspect ratios. It is also available in various formats like PDF, PNG, and JPG. Not only this, the PowerPoint slideshow is completely editable and you can effortlessly modify the font size, font type, and shapes according to your wish. Our PPT layout is compatible with Google Slides as well, so download and edit it as per your knowledge.
-
 Analysis Investment Chart Colored Icon In Powerpoint Pptx Png And Editable Eps Format
This coloured PowerPoint icon is designed for portfolio construction and investment risk assessment. It features a modern design with vibrant colours, making it eye catching and easy to use. Perfect for financial professionals and investors, this icon is a must have for creating visually appealing presentations on portfolio management and risk assessment strategies.
-
 Analysis Investment Chart Monotone Icon In Powerpoint Pptx Png And Editable Eps Format
This Monotone powerpoint icon is the perfect addition to any portfolio construction or investment risk assessment presentation. With its sleek and modern design, it will enhance the overall visual appeal of your slides. It symbolizes professionalism and expertise, making it a must have for any financial presentation.
-
 Analysis Of Wind Turbine And Geothermal Renewable Energy Flow Chart
This slide showcases the analysis of wind turbine and geothermal renewable energy. Its aim is to understand both the technologies by studying data, values, environmental, system design, temperature, fluids, heat pump, etc. Introducing our premium set of slides with Analysis Of Wind Turbine And Geothermal Renewable Energy Flow Chart. Ellicudate the seven stages and present information using this PPT slide. This is a completely adaptable PowerPoint template design that can be used to interpret topics like Wind Turbine, System Design, Heat Pump. So download instantly and tailor it with your information.
-
 Matrix Chart For Failure Mode And Effect Analysis Interpretation
This slide showcases failure mode and effect analysis interpretation matrix chart to identify opportunities with high cost such as severity, occurance, etc. Presenting our well structured Matrix Chart For Failure Mode And Effect Analysis Interpretation. The topics discussed in this slide are Analysis, Interpretation, Occurance. This is an instantly available PowerPoint presentation that can be edited conveniently. Download it right away and captivate your audience.
-
 Mh column chart for result analysis and icons powerpoint temptate
Presenting mh column chart for result analysis and icons powerpoint temptate. This Power Point template diagram has been crafted with graphic of column chart diagram. This PPT diagram contains the concept of business result analysis representation. Use this PPT diagram for business and marketing related presentations.
-
 Data collection and analysis flow chart good ppt example
Presenting data collection and analysis flow chart good ppt example. This is a data collection and analysis flow chart good ppt example. This is a five stage process. The stages in this process are analysis, business, marketing, success, strategy, management.
-
 Complaint Analysis Chart With Frequency And Bottlenecks
This slide showcase Complaint Analysis Chart with Frequency and Bottlenecks. It includes major bottlenecks occurred in the process such as error in downloading the file, background replacement error etc. Introducing our Complaint Analysis Chart With Frequency And Bottlenecks set of slides. The topics discussed in these slides are Complaint Analysis Chart, Frequency, Bottlenecks. This is an immediately available PowerPoint presentation that can be conveniently customized. Download it and convince your audience.
-
 Project Scope And Success Factors Analysis Chart
The following slide highlights the rate of success and failure of project to monitor and control project scope. It includes the percentage of goals achieved, timeliness, changing requirements, risk management etc. Introducing our Project Scope And Success Factors Analysis Chart set of slides. The topics discussed in these slides are Changing Requirements, Failure, Success, Goals Achieved. This is an immediately available PowerPoint presentation that can be conveniently customized. Download it and convince your audience.
-
 Line Chart Sales Risk Analysis To Improve Revenues And Team Performance
Deliver an outstanding presentation on the topic using this Line Chart Sales Risk Analysis To Improve Revenues And Team Performance. Dispense information and present a thorough explanation of Line Chart using the slides given. This template can be altered and personalized to fit your needs. It is also available for immediate download. So grab it now.
-
 Pie Chart Sales Risk Analysis To Improve Revenues And Team Performance
Present the topic in a bit more detail with this Pie Chart Sales Risk Analysis To Improve Revenues And Team Performance. Use it as a tool for discussion and navigation on Pie Chart. This template is free to edit as deemed fit for your organization. Therefore download it now.
-
 Column Chart Analysis And Deployment Of Efficient Ecommerce Management Software
Present the topic in a bit more detail with this Column Chart Analysis And Deployment Of Efficient Ecommerce Management Software. Use it as a tool for discussion and navigation on Column Chart . This template is free to edit as deemed fit for your organization. Therefore download it now.
-
 Line Chart Target Market Definition Examples Strategies And Analysis
Deliver an outstanding presentation on the topic using this Line Chart Target Market Definition Examples Strategies And Analysis. Dispense information and present a thorough explanation of Line Chart using the slides given. This template can be altered and personalized to fit your needs. It is also available for immediate download. So grab it now.
-
 Sales And Price Analysis Chart Of Competitor Price Differentiation Strategy SS
The following slide helps organization in analyzing the sales volume of competitor. It also helps organization in understanding the relationship between sales and price. Present the topic in a bit more detail with this Sales And Price Analysis Chart Of Competitor Price Differentiation Strategy SS. Use it as a tool for discussion and navigation on Lowest Sales, Product Quality Issues. This template is free to edit as deemed fit for your organization. Therefore download it now.
-
 Six staged business vision chart with idea generation and target analysis powerpoint slides
Six staged business vision chart with idea generation and target analysis PPT Slide. Proper balance of colors, shapes and icons in relation to presentation topic. High resolution and fine quality PowerPoint slides. Easy and quick downloading. Compatible with multiple software options available both online and offline. Widely used by business owners, strategists, marketers, investors, financial executives, professors and students. Guidance for executing the changes has been provided for assistance. Modify and personalize the presentation by including the company name and logo.
-
 Spend analysis evaluation of business reports and charts
Presenting this set of slides with name - Spend Analysis Evaluation Of Business Reports And Charts. This is a three stage process. The stages in this process are Spend Analysis, Spend Management, Procurement.
-
 Facts chart graph report writing and analysis
Presenting this set of slides with name - Facts Chart Graph Report Writing And Analysis. This is a one stage process. The stages in this process are Facts, Factual, Reality.
-
 Data visualization online business reports charts and analysis
Presenting this set of slides with name - Data Visualization Online Business Reports Charts And Analysis. This is a two stage process. The stages in this process are Data Visualization, Data Management, Data Representation.
-
 Failure mode and effects analysis fmea matrix chart for fmea interpretation
This slide provides the matrix chart of potential severity and probability of occurrence to determine the high, medium and low priorities in order to take required actions. Introducing Failure Mode And Effects Analysis FMEA Matrix Chart For FMEA Interpretation to increase your presentation threshold. Encompassed with one stages, this template is a great option to educate and entice your audience. Dispence information on High Priority, Medium, Severity, Low, Occurrence, Highest Priority, Low Priority, using this template. Grab it now to reap its full benefits.
-
 Hr Planning And Requirements Analysis Chart
This slide illustrates requirements in human resources management. It includes functions, availabilities, requirements, priorities. Presenting our well-structured Hr Planning And Requirements Analysis Chart. The topics discussed in this slide are Resources, Management, Functions, Availabilities, Requirements. This is an instantly available PowerPoint presentation that can be edited conveniently. Download it right away and captivate your audience.
-
 Human Resource Planning And Analysis Gantt Chart
This slide illustrates timeline and statistics of human resource department tasks. It includes tasks, responsible manager, start and end dates, no. of days taken and timeline. Presenting our well-structured Human Resource Planning And Analysis Gantt Chart. The topics discussed in this slide are Resource, Planning, Analysis, Responsible. This is an instantly available PowerPoint presentation that can be edited conveniently. Download it right away and captivate your audience.
-
 Environmental Analysis Icon With Chart And Magnifying Glass
Introducing our premium set of slides with Environmental Analysis Icon With Chart And Magnifying Glass. Ellicudate the four stages and present information using this PPT slide. This is a completely adaptable PowerPoint template design that can be used to interpret topics like Environmental Analysis Icon With Chart And Magnifying Glass. So download instantly and tailor it with your information.
-
 Qualitative Analysis Chemistry Flow Chart In Powerpoint And Google Slides Cpb
Presenting our Qualitative Analysis Chemistry Flow Chart In Powerpoint And Google Slides Cpb PowerPoint template design. This PowerPoint slide showcases four stages. It is useful to share insightful information on Qualitative Analysis Chemistry Flow Chart. This PPT slide can be easily accessed in standard screen and widescreen aspect ratios. It is also available in various formats like PDF, PNG, and JPG. Not only this, the PowerPoint slideshow is completely editable and you can effortlessly modify the font size, font type, and shapes according to your wish. Our PPT layout is compatible with Google Slides as well, so download and edit it as per your knowledge.
-
 Data Analysis With Magnifier And Charts Colored Icon In Powerpoint Pptx Png And Editable Eps Format
Give your next presentation a sophisticated, yet modern look with this 100 percent editable Data analysis with magnifier and charts colored icon in powerpoint pptx png and editable eps format. Choose from a variety of customizable formats such as PPTx, png, eps. You can use these icons for your presentations, banners, templates, One-pagers that suit your business needs.
-
 Data Analysis With Magnifier And Charts Monotone Icon In Powerpoint Pptx Png And Editable Eps Format
Make your presentation profoundly eye-catching leveraging our easily customizable Data analysis with magnifier and charts monotone icon in powerpoint pptx png and editable eps format. It is designed to draw the attention of your audience. Available in all editable formats, including PPTx, png, and eps, you can tweak it to deliver your message with ease.
-
 Icon For Companys Key Stakeholders Analysis And Charts
Introducing our premium set of slides with Icon For Companys Key Stakeholders Analysis And Charts. Ellicudate the three stages and present information using this PPT slide. This is a completely adaptable PowerPoint template design that can be used to interpret topics like Icon For Companys, Key Stakeholders, Analysis And Charts. So download instantly and tailor it with your information.
-
 Graphical Analysis Charts Colored Icon In Powerpoint Pptx Png And Editable Eps Format
Give your next presentation a sophisticated, yet modern look with this 100 percent editable Graphical analysis charts colored icon in powerpoint pptx png and editable eps format. Choose from a variety of customizable formats such as PPTx, png, eps. You can use these icons for your presentations, banners, templates, One-pagers that suit your business needs.
-
 Graphical Analysis Charts Monotone Icon In Powerpoint Pptx Png And Editable Eps Format
Make your presentation profoundly eye-catching leveraging our easily customizable Graphical analysis charts monotone icon in powerpoint pptx png and editable eps format. It is designed to draw the attention of your audience. Available in all editable formats, including PPTx, png, and eps, you can tweak it to deliver your message with ease.
-
 Critical Path Analysis Chart In Powerpoint And Google Slides Cpb
Presenting Critical Path Analysis Chart In Powerpoint And Google Slides Cpb slide which is completely adaptable. The graphics in this PowerPoint slide showcase five stages that will help you succinctly convey the information. In addition, you can alternate the color, font size, font type, and shapes of this PPT layout according to your content. This PPT presentation can be accessed with Google Slides and is available in both standard screen and widescreen aspect ratios. It is also a useful set to elucidate topics like Critical Path Analysis Chart. This well structured design can be downloaded in different formats like PDF, JPG, and PNG. So, without any delay, click on the download button now.
-
 Agenda For Food Production Sector Trends And Analysis Summary Ppt Diagram Graph Charts
Present the topic in a bit more detail with this Agenda For Food Production Sector Trends And Analysis Summary Ppt Diagram Graph Charts. Use it as a tool for discussion and navigation on Food Production, Sector Trends, Analysis Summary. This template is free to edit as deemed fit for your organization. Therefore download it now.
-
 Pre And Post Analysis Bar Chart Icon
Introducing our Pre And Post Analysis Bar Chart Icon set of slides. The topics discussed in these slides are Pre Post Analysis Bar Chart, Icon. This is an immediately available PowerPoint presentation that can be conveniently customized. Download it and convince your audience.
-
 Competitive Analysis Chart In Powerpoint And Google Slides Cpb
Presenting our Competitive Analysis Chart In Powerpoint And Google Slides Cpb PowerPoint template design. This PowerPoint slide showcases four stages. It is useful to share insightful information on Competitive Analysis Chart. This PPT slide can be easily accessed in standard screen and widescreen aspect ratios. It is also available in various formats like PDF, PNG, and JPG. Not only this, the PowerPoint slideshow is completely editable and you can effortlessly modify the font size, font type, and shapes according to your wish. Our PPT layout is compatible with Google Slides as well, so download and edit it as per your knowledge.
-
 Two Years Gantt Chart For Project Analysis And Evaluation
Plan, track and synchronize the most important tasks of any project with this exemplary Two Years Gantt Chart For Project Analysis And Evaluation. This lucrative template can be used to manage the project efficiently. You can enter all the vital components of the project like the start date, duration, and status of each task to keep the owners accountability in check. Create a highly proficient scheduling plan and measure its progress with this elaborative layout. In addition, you can add your activities in the taskbar included in this template and edit it to handle your project effectively. This template is ideal for project management, business plans, student projects, and assignments. So download and captivate your audience.
-
 Marketing And Sales Risk Analysis Icon With Pie Chart
Presenting our set of slides with name Marketing And Sales Risk Analysis Icon With Pie Chart. This exhibits information on three stages of the process. This is an easy-to-edit and innovatively designed PowerPoint template. So download immediately and highlight information on Marketing, Sales Risk Analysis, Icon, Pie Chart.
-
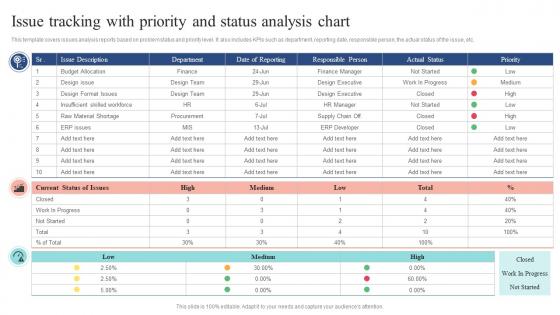 Issue Tracking With Priority And Status Analysis Chart
This template covers issues analysis reports based on problem status and priority level. It also includes KPIs such as department, reporting date, responsible person, the actual status of the issue, etc. Presenting our well structured Issue Tracking With Priority And Status Analysis Chart. The topics discussed in this slide are Issue Description, Responsible Person, Actual Status. This is an instantly available PowerPoint presentation that can be edited conveniently. Download it right away and captivate your audience.
-
 Statistical Analysis Icon With Pie Chart And Graphs
Presenting our set of slides with Statistical Analysis Icon With Pie Chart And Graphs. This exhibits information on four stages of the process. This is an easy to edit and innovatively designed PowerPoint template. So download immediately and highlight information on Statistical Analysis, Pie Chart Graphs.
-
 Change Analysis Chart In Powerpoint And Google Slides Cpb
Presenting our Change Analysis Chart In Powerpoint And Google Slides Cpb PowerPoint template design. This PowerPoint slide showcases five stages. It is useful to share insightful information on Change Analysis Chart This PPT slide can be easily accessed in standard screen and widescreen aspect ratios. It is also available in various formats like PDF, PNG, and JPG. Not only this, the PowerPoint slideshow is completely editable and you can effortlessly modify the font size, font type, and shapes according to your wish. Our PPT layout is compatible with Google Slides as well, so download and edit it as per your knowledge.
-
 Project Portfolio Risk Analysis And Management Process Gantt Chart
This slide presents a Gantt chart that enables managers to execute identity risk and mitigate risk. It includes tasks such as prepare list of potential risks, conduct review meeting, determine riskiest aspect of project, estimate impact on cost, etc. Introducing our Project Portfolio Risk Analysis And Management Process Gantt Chart set of slides. The topics discussed in these slides are Portfolio, Project, Analysis. This is an immediately available PowerPoint presentation that can be conveniently customized. Download it and convince your audience.
-
 Pie chart for market research and analysis powerpoint ideas
Presenting pie chart for market research and analysis powerpoint ideas. This is a pie chart for market research and analysis powerpoint ideas. This is a seven stage process. The stages in this process are pie chart, percentage, analysis, marketing, strategy, business, success.
-
 Financial reporting and analysis pie chart ppt slide
Presenting financial reporting and analysis pie chart ppt slide. This is a financial reporting and analysis pie chart ppt slide. This is a four stage process. The stages in this process are finance, marketing, percentage, process, success.
-
 Gap analysis competency and skills chart powerpoint layout
Presenting gap analysis competency and skills chart PowerPoint layout. This PPT slide offers you plenty of space to put in titles and subtitles. High resolution based presentation layout, does not change the image even after resizing. This presentation icon is fully compatible with Google Slides. Quick downloading speed and simple editing options in color text and fonts.PPT icons can easily be changed into JPEG and PDF applications.
-
 Executive coaching icons with persons and analysis chart
Presenting executive coaching icons with persons and analysis chart. This is a executive coaching icons with persons and analysis chart. This is a two stage process. The stages in this process are executive coaching, executive training, leader coaching.
-
 Multiple work instructions with person and analysis chart
Presenting this set of slides with name - Multiple Work Instructions With Person And Analysis Chart. This is a three stage process. The stages in this process are Work Instructions, Task Instructions, Work Guidance.
-
 Break even analysis chart showing fixed and total costs
Presenting this set of slides with name - Break Even Analysis Chart Showing Fixed And Total Costs. This is a four stage process. The stages in this process are Break Even Analysis, Break Even Point, Break Even Level.
-
 Break even analysis chart showing total cost and revenue
Presenting this set of slides with name - Break Even Analysis Chart Showing Total Cost And Revenue. This is a three stage process. The stages in this process are Break Even Analysis, Break Even Point, Break Even Level.
-
 Program charter showing team work plan solution analysis and vision
Presenting this set of slides with name - Program Charter Showing Team Work Plan Solution Analysis And Vision. This is a three stage process. The stages in this process are Program Charter, Project Charter, Project Management.
-
 Financial markets analysis with pie chart and bar graphs
Presenting this set of slides with name - Financial Markets Analysis With Pie Chart And Bar Graphs. This is a three stage process. The stages in this process are Bull Market, Financial Markets, Stock Market.
-
 Gantt chart for 3 years with proposal research analysis and project design
Presenting this set of slides with name - Gantt Chart For 3 Years With Proposal Research Analysis And Project Design. This is a three stage process. The stages in this process are Gantt Chart For 3 Years, Gantt Chart Time Scale, Gantt Chart Timeline.
-
 Data and result analysis chart flat powerpoint design
Visually appealing PPT presentation layouts. Compatible with google slides. Offers easy and instant downloading. Allows orientation of objects to alter the appearance. Can be utilized by investors, entrepreneurs, clients, students and customers. Capable of easily grabbing the viewers’ attention. Delivers an accurate and precise message.
-
 Milestone chart with tasks planning building execution and analysis
Presenting this set of slides with name - Milestone Chart With Tasks Planning Building Execution And Analysis. This is a tweleve stage process. The stages in this process are Milestone Chart, Milestone Graph, Milestone Grid.
-
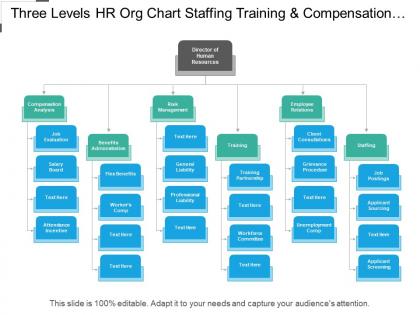 Three levels hr org chart staffing training and compensation analysis
Presenting this set of slides with name - Three Levels Hr Org Chart Staffing Training And Compensation Analysis. This is a three stage process. The stages in this process are Org Chart, Organization Chart, Project Team Structure.
-
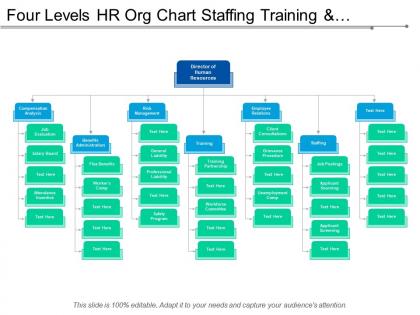 Four levels hr org chart staffing training and compensation analysis
Presenting this set of slides with name - Four Levels Hr Org Chart Staffing Training And Compensation Analysis. This is a seven stage process. The stages in this process are Org Chart, Organization Chart, Project Team Structure.
-
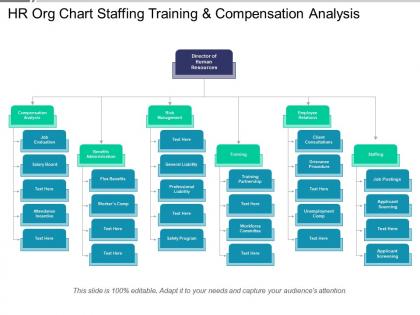 Hr org chart staffing training and compensation analysis
Presenting HR org chart staffing training and compensation analysis PPT template. User-friendly PowerPoint slides. Helps in saving your valuable time and effort. Easy to download and merge with your presentations. Makes sure to deliver a correct organizational and presentation motive. Enough space available to enter text and its related points in the PPT slide. Pictures do not pixelate when projected on Widescreen. Compatible with multiple formats like JPEG, PDF and Google slides. Perfect for sales management team, leaders, executives, managers, researchers, analysts, etc.
-
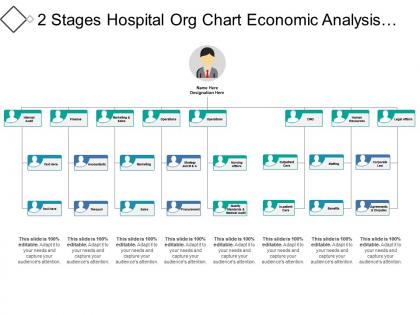 2 stages hospital org chart economic analysis budgeting and controlling
Presenting 2 stages hospital org chart economic analysis budgeting and controlling presentation slide. This PPT slide offers you plenty of space to put in titles and sub titles. High resolution based presentation layout, does not change the image even after resizing. This presentation icon is fully compatible with Google slides. Quick downloading speed and simple editing options in color text and fonts.PPT icons can easily be changed into JPEG and PDF applications. This diagram has been designed for entrepreneurs, corporate and business managers.
-
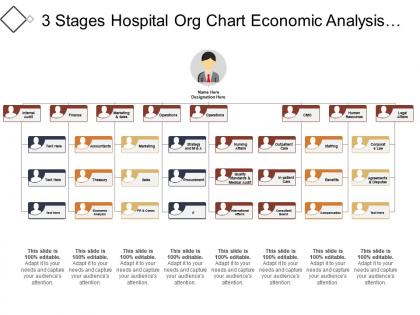 3 stages hospital org chart economic analysis budgeting and controlling
Presenting 3 stages hospital org chart economic analysis budgeting and controlling PPT slide. This PPT slide offers you plenty of space to put in titles and sub titles. High resolution based presentation layout, does not change the image even after resizing. This presentation icon is fully compatible with Google slides. Quick downloading speed and simple editing options in color text and fonts.PPT icons can easily be changed into JPEG and PDF applications. This diagram has been designed for entrepreneurs, corporate and business managers.


