Powerpoint Templates and Google slides for Aging
Save Your Time and attract your audience with our fully editable PPT Templates and Slides.
-
 Gw three staged business agenda hexagon diagram powerpoint template
Presenting gw three staged business agenda hexagon diagram powerpoint template. Three staged hexagon diagram and icons has been used to design this PPT diagram. This PPT diagram contains the concept of business agenda representation. Use this PPT diagram for business and marketing related presentations.
-
 Gu three staged pyramid agile management powerpoint template
Presenting gu three staged pyramid agile management powerpoint template. Three staged pyramid diagram has been used to design this power point template diagram. This PPT diagram contains the concept of agile management. Use this PPT diagram for business and marketing related presentations.
-
 Qw three staged business agenda icons diagram powerpoint template
Presenting qw three staged business agenda icons diagram powerpoint template. Three staged business agenda and icons diagram has been used to craft this power point template diagram. This PPT diagram contains the concept of business agenda representation. Use this PPT diagram for business and marketing related presentations.
-
 Passport brochure of travel agenices suitcase beach holidays ppt icons graphics
We are proud to present our passport brochure of travel agenices suitcase beach holidays ppt icons graphics. This power point icon template has been crafted with graphic of passport, suitcase icons. This icon PPT contains the concept of game strategy. Use this icon template for business and travel related presentations.
-
 Ag three staged linear arrows with process icons powerpoint template slide
Presenting ag three staged linear arrows with process icons powerpoint template slide. Three staged linear arrow and icons diagram has been used to craft this power point template icon diagram. This icon PPT contains the concept of business process flow. Use this icon template for business and marketing related presentations.
-
 No three staged business agenda diagram powerpoint template
Presenting no three staged business agenda diagram powerpoint template. This Power Point template diagram has been crafted with graphic of three staged business agenda diagram. This PPT diagram contains the concept of business agenda analysis. Use this PPT diagram for business and sales related presentations.
-
 Oa three steps data tags for business agenda workflow powerpoint template
Presenting oa three steps data tags for business agenda workflow powerpoint template. Three steps tags diagram has been used to craft this power point template diagram. This PPT diagram contains the concept of business agenda workflow and data representation. Use this PPT diagram for business and marketing related presentations.
-
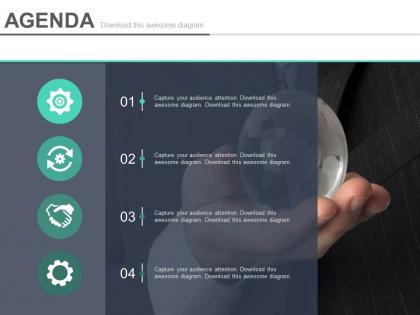 Four sequential tags for business agenda icons powerpoint slides
Editable PPT Slide for business agenda with icons. Compatible with numerous format options like JPEG, JPG or PDF. Access to inclusion and exclusion of contents as per specific needs of any business. Provides a professional outlook to your PowerPoint presentation. Beneficial for business professionals, students, teachers, business analysts and strategists. Customization of each PowerPoint graphic and text according to your desire and want. Available in Widescreen slide size also. Freedom to customize it with company name and logo.
-
 About us page for business agenda analysis powerpoint slides
Presenting about us page for business agenda analysis powerpoint slides. This is a about us page for business agenda analysis powerpoint slides. This is a six stage process. The stages in this process are about us company details.
-
 Multiple business operation agenda slide powerpoint slides
Top determination PPT design slides for clear wide screen see. Upkeep of fitting shading many-sided quality to ensure clear vision. Utilization of sustaining and supplementing picture portrayal. 100 percent editable PPT slide content. Join the association name and logo to give a more tweaked look. Simple consolidation and shirking of information, as indicated by require. Important for business specialists, representatives, cash related analysts, understudies and scientists.
-
 Kpi for agreed proposals correctly handled neglected compliance issues ppt slide
Presenting kpi for agreed proposals correctly handled neglected compliance issues ppt slide. This presentation slide shows three Key Performance Indicators or KPIs in a Dashboard style design. The first KPI that can be shown is Age of Agreed Upon Recommendations. The second KPI is percentage of Compliance Issues Handled First Time Correctly and the third is percentage of Neglected Compliance Issues. These KPI Powerpoint graphics are all data driven,and the shape automatically adjusts according to your data. Just right click on the KPI graphic,enter the right value and the shape will adjust automatically. Make a visual impact with our KPI slides.
-
 Manually measured compared against benchmarks benchmarking cost per kpi ppt slide
Presenting manually measured compared against benchmarks benchmarking cost per kpi ppt slide. This presentation slide shows three Key Performance Indicators or KPIs in a Dashboard style design. The first KPI that can be shown is percentage of KPIs That are Manually Measured. The second KPI is percentage of KPIs Compared Against Benchmarks and the third is Average Cost of Benchmarking Per KPI. These KPI Powerpoint graphics are all data driven, and the shape automatically adjusts according to your data. Just right click on the KPI graphic, enter the right value and the shape will adjust automatically. Make a visual impact with our KPI slides.
-
 Carrying kpi for agreed delivery time free orders cost fuel per package presentation slide
Presenting carrying kpi for agreed delivery time free orders cost fuel per package presentation slide. This presentation slide shows three Key Performance Indicators or KPIs in a Dashboard style design. The first KPI that can be shown is percentage of Agreed Delivery Times Reached. The second KPI is percentage of Free Orders Delivered Cost and the third is Amount of Fuel Per Package. These KPI Powerpoint graphics are all data driven, and the shape automatically adjusts according to your data. Just right click on the KPI graphic, enter the right value and the shape will adjust automatically. Make a visual impact with our KPI slides.
-
 Postal kpi for correct deliveries cost per delivery agreed delivery ppt slide
Presenting postal kpi for correct deliveries cost per delivery agreed delivery ppt slide. This presentation slide shows Three Key Performance Indicators or KPIs in a Dashboard style design. The first KPI that can be shown is Percentage of Deliveries That are Delivered Correctly First Time. The second KPI is Average Cost Per Delivery. The third is Percentage of Agreed Delivery Times Reached. These KPI Powerpoint graphics are all data driven, and the shape automatically adjusts according to your data. Just right click on the KPI graphic, enter the right value and the shape will adjust automatically. Make a visual impact with our KPI slides.
-
 Airline kpi for average age of fleet fuel cost accidents per hour presentation slide
Presenting airline kpi for average age of fleet fuel cost accidents per hour presentation slide. This presentation slide shows three Key Performance Indicators or KPIs in a Dashboard style design. The first KPI that can be shown is Average Age of Fleet. The second KPI is Fuel Cost as Percentage of Total Costs and the third is Accidents Per 100,000 Flight Hours. These KPI Powerpoint graphics are all data driven, and the shape automatically adjusts according to your data. Just right click on the KPI graphic, enter the right value and the shape will adjust automatically. Make a visual impact with our KPI slides.
-
 Kpi for utilization cost use of cleaning agents narcotic documentation presentation slide
Presenting kpi for utilization cost use of cleaning agents narcotic documentation presentation slide. This presentation slide shows three Key Performance Indicators or KPIs in a Dashboard style design. The first KPI that can be shown is Utilization Cost Per FTE Physician. The second KPI is Average Use of Cleaning Agents or Soap Used to Determine Hand Hygiene Hand Washing and the third is Compliance with Narcotic Documentation. These KPI Powerpoint graphics are all data driven, and the shape automatically adjusts according to your data. Just right click on the KPI graphic, enter the right value and the shape will adjust automatically. Make a visual impact with our KPI slides.
-
 Inventory kpi for average age supply months ppt slide
Presenting inventory kpi for average age supply months ppt slide. This presentation slide shows Two Key Performance Indicators or KPIs. The first KPI that can be show is Average Age of Inventory. The second KPI is Inventory Months of Supply. These KPI Powerpoint graphics are all data driven, and the shape automatically adjusts according to your data. Just right click on the KPI graphic, enter the right value and the shape will adjust automatically. Make a visual impact with our KPI slides.
-
 Agenda example of ppt presentation
Edit slides to the way you want. Instantly downloadable with a single click. Standard and widescreen support for all devices. Can be viewed in Google Slides also. Suitable for use by clients, managers and firms. Premium Customer support.This is a four stage process. The stages In this process are agenda, business meeting agenda.
-
 Demographics showing gender age and parental status
Presenting this set of slides with name - Demographics Showing Gender Age And Parental Status. This is a three stage process. The stages in this process are Population, Demographics, People Growth.
-
 People silhouettes image of people standing against a futuristic background
Presenting this set of slides with name - People Silhouettes Image Of People Standing Against A Futuristic Background. This is a five stage process. The stages in this process are People Silhouettes, Persons Silhouettes, Human Beings Silhouettes.
-
 Global agenda with four steps 1
Presenting this set of slides with name - Global Agenda With Four Steps 1. This is a four stage process. The stages in this process are Global Agenda, Global Plan, Global Strategy.
-
 Global agenda with six steps
Presenting this set of slides with name - Global Agenda With Six Steps. This is a six stage process. The stages in this process are Global Agenda, Global Plan, Global Strategy.
-
 Global agenda with four steps
Presenting this set of slides with name - Global Agenda With Four Steps. This is a four stage process. The stages in this process are Global Agenda, Global Plan, Global Strategy.
-
 Agenda time activity lineup image with pen
Presenting this set of slides with name - Agenda Time Activity Lineup Image With Pen. This is a one stage process. The stages in this process are Agenda Time, Plan Time, Meeting Time.
-
 Agenda time calendar schedule image with pc
Presenting this set of slides with name - Agenda Time Calendar Schedule Image With Pc. This is a one stage process. The stages in this process are Agenda Time, Plan Time, Meeting Time.
-
 Agenda time meeting watch image
Presenting this set of slides with name - Agenda Time Meeting Watch Image. This is a one stage process. The stages in this process are Agenda Time, Plan Time, Meeting Time.
-
 Agenda time notebook list image with wooden background
Presenting this set of slides with name - Agenda Time Notebook List Image With Wooden Background. This is a one stage process. The stages in this process are Agenda Time, Plan Time, Meeting Time.
-
 Agenda time scheduler image with clock
Presenting this set of slides with name - Agenda Time Scheduler Image With Clock. This is a one stage process. The stages in this process are Agenda Time, Plan Time, Meeting Time.
-
 Meeting agenda time plan image
Presenting this set of slides with name - Meeting Agenda Time Plan Image. This is a one stage process. The stages in this process are Agenda Time, Plan Time, Meeting Time.
-
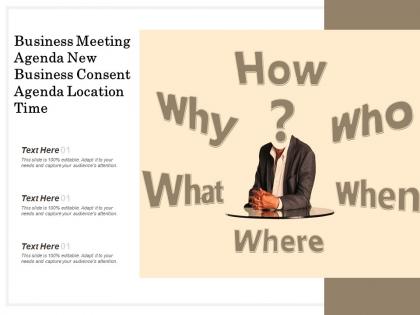 Business meeting agenda new business consent agenda location time
Presenting this set of slides with name - Business Meeting Agenda New Business Consent Agenda Location Time. This is a three stage process. The stages in this process are Question Mark, Asking Question, Query Mark.
-
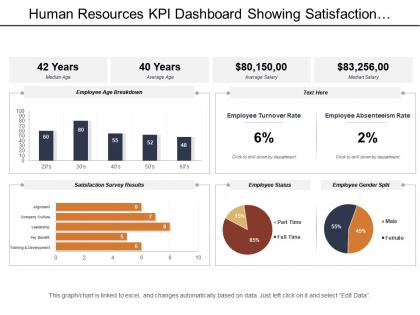 Human resources kpi dashboard showing satisfaction survey result age breakdown
Presenting human resources KPI dashboard showing satisfaction survey result age breakdown data driven PowerPoint slide. Fit to be used with the Google slides. Replace the visuals, text and the content in the slide design. Change the size, style and orientation of the slides. Use your company’s name or brand name to make it your own presentation template. Beneficial for managers, professors, marketers, etc. Flexible option for conversion in PDF or JPG formats. Available in Widescreen format also. Useful for making business plan and strategies.
-
 Audit kpi dashboard showing aggregated audit status and audit work effort
Presenting this set of slides with name - Audit Kpi Dashboard Showing Aggregated Audit Status And Audit Work Effort. This is a five stage process. The stages in this process are Audit, Examine, Survey.
-
 Call center kpi dashboard showing agent talking longest call waiting call handling
Presenting this set of slides with name - Call Center Kpi Dashboard Showing Agent Talking Longest Call Waiting Call Handling. This is a five stage process. The stages in this process are Call Center Agent, Customer Care, Client Support.
-
 Call center kpi dashboard showing budget call volume agent costs percentage sales target
Presenting this set of slides with name - Call Center Kpi Dashboard Showing Budget Call Volume Agent Costs Percentage Sales Target. This is a four stage process. The stages in this process are Call Center Agent, Customer Care, Client Support.
-
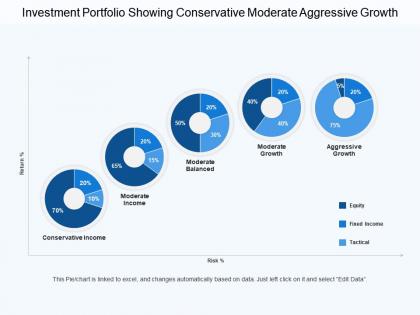 Investment portfolio showing conservative moderate aggressive growth
Presenting this set of slides with name - Investment Portfolio Showing Conservative Moderate Aggressive Growth. This is a five stage process. The stages in this process are Investment Portfolio, Funding Portfolio, Expenditure Portfolio.
-
 Hr dashboard employee age breakdown graph donut chart
Presenting this set of slides with name - Hr Dashboard Employee Age Breakdown Graph Donut Chart. This is a four stage process. The stages in this process are Hr Dashboard, Human Resource Dashboard, Hr Kpi.
-
 0414 agenda powerpoint presentation
We are proud to present our 0414 agenda powerpoint presentation. Our Agenda PowerPoint Presentation Power Point Templates Provide You With A Vast Range Of Viable Options. Select The Appropriate Ones And Just Fill In Your Text. Subscribe To Our Technology Power Point Templates And Receive Great Value For Your Money. Be Assured Of Finding The Best Projection To Highlight Your Words.
-
 Agenda of unity concept with new agenda 0214
We are proud to present our agenda of unity concept with new agenda 0214. Concept of unity is shown in this slide. This slide is can be used for displaying new agendas of business.
-
 Mark 10 30 the age to come powerpoint church sermon
We are proud to present our mark 10 30 the age to come powerpoint church sermon. Guide them to salvation with our Mark 10.30. Give them a glimpse of Gods grace. Give them a glimpse of Gods grace with our Eternal Life PowerPoint sermon slides for pastors. Guide their souls to salvation. Mark 10.30 Will fail to receive a hundred times as much in this present age homes, brothers, sisters, mothers, children and fields along with persecutions and in the age to come eternal life.
-
 0914 business plan colorful seven points spheres for agenda diagram powerpoint presentation template
We are proud to present our 0914 business plan colorful seven points spheres for agenda diagram powerpoint presentation template. Seven staged sphere diagram has been used to design this Power Point template. This PPT displays the concept of business and sales agenda. Use this info graphic in your business presentations and explain business agendas.
-
 0914 business plan six stages colorful spheres diagram agenda powerpoint presentation template
We are proud to present our 0914 business plan six stages colorful spheres diagram agenda powerpoint presentation template. To display business agenda in your business presentation use our exclusive power point template. This PPT contains the graphic of six stages of colorful spheres. Make an impressive presentations for business agenda related topics.
-
 0914 business plan new pencil diagram agenda powerpoint presentation template
Quick and easy hassle-free download without unnecessary steps. Fully editable PPT slide - insert text as per requirement. Absolutely modifiable color scheme, contrast, size and orientation of PPT images. Insert brand name, tagline, trademarks, logo, watermark etc. No change in resolution post editing. Add seamlessly anywhere in between your own slides.
-
 Agriculture and forestry kpi dashboard showing average milk yield per lactation
Exhibiting agriculture and forestry KPI dashboard showing average milk yield per lactation PPT design. Speedy download with easy to save options. Effortless to put in corporation name, logo and image. Presentation template can be shared with Google slides as easily merge with them. PowerPoint graphic can be showcased in standard and widescreen view. Preference to download and present with different nodes and stages. PPT diagram can be modify easily as some components are editable.
-
 Agriculture and forestry kpi dashboard showing crop production and chemical fertilizers consumptions
Displaying agriculture and forestry KPI dashboard showing crop production and chemical fertilizers consumptions presentation slide. Modify the design with trademark and picture. PowerPoint diagram is well-matched with Google slides. Colors and text can be amended as the PPT graphic comes with easy to use editing options. Presentation design can be delivered in both standard and widescreen display view. Flexible with other software options such as PDF or JPG formats as can be converted effortlessly.
-
 Agriculture and forestry kpi dashboard showing deforestation restoration of degraded lands
Stunning agriculture and forestry KPI dashboard showing deforestation restoration of degraded lands PowerPoint template. Choice to display PowerPoint template in standard and widescreen view. Presentation designs are well-suited with Google slides or MS Office PowerPoint programs. Can be transformed into JPG and PDF format. Trouble-free replacement of your company’s logo. Access to open on a big screen display. Perfect for business professionals, managers and industry leaders. Customize the fonts, colors, layout, etc.as per your requirements and business needs.
-
 Agriculture and forestry kpi dashboard showing milk production cost by number of cows
Readymade agriculture and forestry KPI dashboard showing milk production cost by number of cows PPT template. Attuned with Microsoft office software’s as well as Google slides. Amend and customize the PPT slide by adding the corporate trademark. Assistance to make changes has been provided in the slide. Useful for sales leaders, marketers, business professionals, analysts, strategists, etc. Effortlessly and fluently adjustable by any user at any time without even having any expertize. Fast to download, share and insert in the presentation.
-
 Agriculture and forestry kpi dashboard showing most common tree types height of the tree
Highlighting agriculture and forestry KPI dashboard showing most common tree types height of the tree PPT template. An easy access to make the desired changes or edit it anyways. Wide screen view of the slides. Easy conversion into Jpeg or Pdf format. The PPT images offer compatibility with Google slides. Valuable for business professionals, sales representatives, marketing professionals, students and selling investigators. High quality charts and visuals used in the designing process. They enhance the performance of the presentation.
-
 Agriculture and forestry kpi dashboard showing planting progress and seeds planted
Introducing agriculture and forestry KPI dashboard showing planting progress and seeds planted PPT template. The presentation template can be downloaded and saved in any desired format. Valuable for the business presenters and entrepreneurs as they can showcase their business success in a creative way. Privilege of insertion of logo and trademarks for more personalization. Adaptable to wide screen view without the problem of pixilation. Can be used with Google slides. Beneficial for industry professionals, managers, executives, researchers, sales people, etc.
-
 Agriculture and forestry kpi dashboard showing production cost and working capital sow
Presenting agriculture and forestry KPI dashboard showing production cost and working capital sow PPT slideshow. Easy and convenient downloading by following simple steps. They have an amazing view to grab the attention if the viewer. They are popular and in demand due to their easy use and accessibility. They maintain the professionalism of the presentation. Fully compatible with Google slides. Have the tendency to enhance the overall impact of your presentation. User friendly PPT templates. Presented to be saved in jpg or pdf format if required.
-
 Agriculture and forestry kpi dashboard showing productivity per crop and farm
Pre-designed agriculture and forestry KPI dashboard showing productivity per crop and farm PPT template. Beneficial for managers, professors, marketers, etc. Flexible option for conversion in PDF or JPG formats. Useful for making business plan and strategies. Can also be used with Google slides. Replace the images, text and the content in the slide design. Change the size, style and orientation of the slides. Use your company’s name or brand name to make it your own presentation template.
-
 Agriculture and forestry kpi dashboard showing roi per crop production and industry claim count
Presenting agriculture and forestry KPI dashboard showing ROI per crop production and industry claim count PowerPoint slide. Unaffected high-resolution PowerPoint slide. Include or exclude slide content as per your individual need. Personalize the presentation with individual company name and logo. Beneficial for industry professionals, managers, executives, researchers, sales people, etc. This template is available in both Standard and Widescreen slide size. Easy and quick downloading process. Flexible option for conversion in PDF or JPG formats. Compatible with Google slides.
-
 Agriculture and forestry kpi dashboard showing us gdp production target
Highlighting agricultural and forestry KPI dashboard showing us gdp production target PowerPoint slide. Useful tool for students, business analysts, sales people, sales managers and professionals of any industry. Precise and easy to comprehend information on PPT sample. Useful for marketing and business-related presentations. Wide screen projection does not affect the output adversely. Access to save in the JPG or PDF format. Increase the level of personalization with your company logo and name. Compatible with all software and can be saved in any format.
-
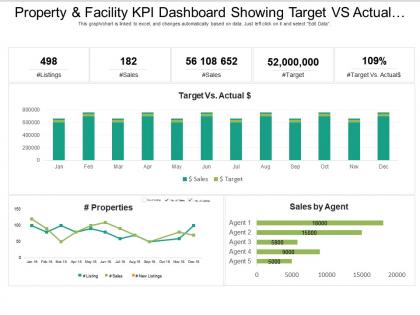 Property and facility kpi dashboard showing target vs actual cost and sales by agent
Get a chance to go through, property and facility KPI dashboard showing target-vs-actual cost and sales by agent PowerPoint Presentation Slide. This Presentation has been designed by professionals and is fully editable. You can have access to alter the font size, font type, colors, and even the background. This Template is amiable with Google Slide and can be saved in JPG or PDF format without any chaos created. Fast download at the click of the button.
-
 Workforce kpi dashboard showing average age female percentage and average tenure
Presenting this set of slides with name - Workforce Kpi Dashboard Showing Average Age Female Percentage And Average Tenure. This is a four stage process. The stages in this process are Staff, Personnel, Workforce.
-
 Special old age care facility hospital branding image
Presenting this set of slides with name - Special Old Age Care Facility Hospital Branding Image. This is a two stage process. The stages in this process are Hospital Branding, Hospital Marketing, Hospital Promotion.
-
 Media and publishing subscribers gender age and categories dashboard
Presenting this set of slides with name - Media And Publishing Subscribers Gender Age And Categories Dashboard. This is a six stage process. The stages in this process are Media And Publishing, Media Communication.
-
 Confidentiality disclosure agreement template internal organizational structure cloud computing cpb
This is an editable three stages graphic that deals with topics like Confidentiality Disclosure Agreement Template, Internal Organizational Structure, Cloud Computing to help convey your message better graphically. This product is a premium product available for immediate download, and is 100 percent editable in Powerpoint. Download this now and use it in your presentations to impress your audience.
-
 Lean agile methods lean leadership principles lean thinking model cpb
This is an editable two stages graphic that deals with topics like Lean Agile Methods, Lean Leadership Principles, Lean Thinking Model to help convey your message better graphically. This product is a premium product available for immediate download, and is 100 percent editable in Powerpoint. Download this now and use it in your presentations to impress your audience.
-
 Insurance total active agents dashboard snapshot
• Multi colored beautifully designed visuals • Easy to download • Easy to customize and personalize • Ease of inclusion and exclusion of slide content as per company specific data • Thoroughly editable slides • High resolution visuals • Compatible with Google slides • Compatible with numerous forms format options available in market • Harmonious with multiple software options • Used by business analysts, insurance companies, insurance employees, and other such professionals.
-
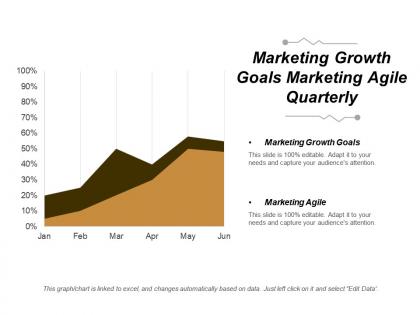 Marketing growth goals marketing agile quarterly marketing goals cpb
This is an editable two stages graphic that deals with topics like Marketing Growth Goals, Marketing Agile, Quarterly Marketing Goals to help convey your message better graphically. This product is a premium product available for immediate download, and is 100 percent editable in Powerpoint. Download this now and use it in your presentations to impress your audience.


