Six sigma principles and concepts powerpoint presentation with slides
Are you looking to take up your six sigma methodology PowerPoint show to next level? Just check out our presentation deck to thoroughly explain your six sigma approach or simply what is six sigma? By utilizing this PPT example you can motivate your employees to go for team formation so as to improve overall performance of your business processes. Additionally, with help of our PPT slideshow you can easily identify various defects and suggest measures to timely remove and maintain quality management. There is more that you can address with this PPT model like various levels of six sigma, design for six sigma, lean six sigma process improvement tools and techniques. Well bearing all this in mind, we have conceptualized creative presentation layouts like six sigma roadmap, six sigma process, the DAMIC process, voice of customer are just a few to name here. In nutshell, by downloading our six sigma principles and concepts complete PowerPoint slide deck you not only save your time, but also get best readymade PPT sample. Get your audience singing from the same sheet. Our Six Sigma Principles And Concepts Complete Powerpoint Deck With Slides can create harmony.
You must be logged in to download this presentation.
 Impress your
 audience
Editable
of Time
PowerPoint presentation slides
Total 60 high resolution template slides thoroughly addressing six sigma basics. Complete set for project manager, quality controllers and strategic thinkers. Easy to replace dummy text with company name, logo or trademark. Manually editable presentation background, color and font. Complete space liberty offered to user for inserting any sort of text. Simple downloading process that even a novice can easily download. The stages in this process are statistics, planning, analysis, six sigma.
People who downloaded this PowerPoint presentation also viewed the following :
Content of this Powerpoint Presentation
Slide 1: This slide introduces SIX SIGMA PRINCIPLES & CONCEPT. State company name here to get started.
Slide 2: This is an Agenda slide. State your agenda etc. here.
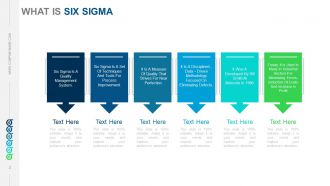
Slide 3: This slide states What Is Six Sigma in the following points- Six Sigma Is A Quality Management System, Six Sigma Is A Set Of Techniques And Tools For Process Improvement, It Is A Measure Of Quality That Strives For Near Perfection, It Is A Disciplined , Data – Driven Methodology Focused On Eliminating Defects, It Was A Developed By Bill Smith At Motorola In 1986, Today, It Is Used In Many In Industrial Sectors For Minimizing Errors, reduction Of Costs And Increase In Profit.
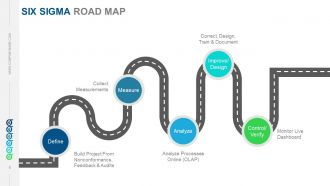
Slide 4: This slide displays a Six Sigma Roadmap with- Define, Measure, Analyze, Control/Verify, Improve/Design.
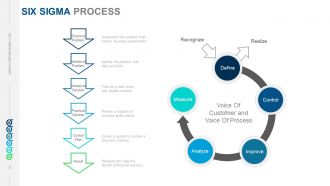
Slide 5: This slide displays Six Sigma Process in a circular form with target imagery.
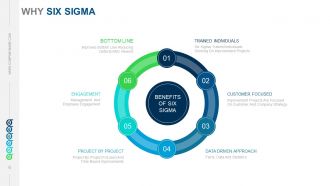
Slide 6: This is Why Six Sigma slide in a circular form. It majorly states the Benefits Of Six Sigma which include- Customer Focused, Engagement, Bottom Line, Trained Individuals, Data Driven Approach, Project By Project.
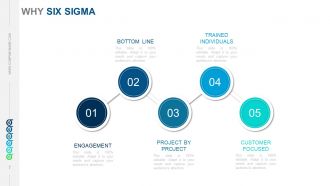
Slide 7: This is another Why Six Sigma slide showcasing- Customer Focused, Engagement, Bottom Line, Trained Individuals, Data Driven Approach, Project By Project.
Slide 8: This slide showcases Six Sigma Methodologies in a tree diagram form divided into- DEFECT REDUCTION, CYCLE TIME REDUCTION.
Slide 9: This slide displays The DMAIC Process as- DEFINE The opportunities MEASURE The Performance ANALYSE The Performance IMPROVE The Performance CONTROL The Performance. Activities to be Executed at Each phase with Relational Tools/Techniques Acquired and Expected Deliverables at Each Phase with Toll Gate Review.
Slide 10: This is another The DMAIC Process slide in a circular flow model/ diagram.
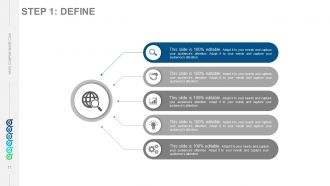
Slide 11: This slide showcases STEP 1: DEFINE of DMAIC Process.
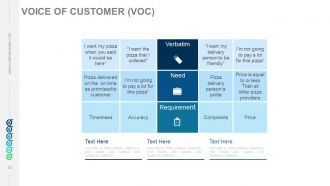
Slide 12: This slide showcases Voice of Customer(VOC) in a tabular form with the following sub headings- Verbatim, Need, Requirement.
Slide 13: This is another Voice Of Customer (VOC) slide in a funnel form.
Slide 14: This too is Voice Of Customer (VOC) slide with text boxes and arrow imagery.
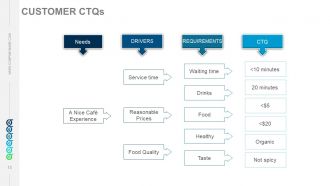
Slide 15: This slide showcases Customer CTQs with the following subheadings- Needs, Drivers, Requirements, CTQ.
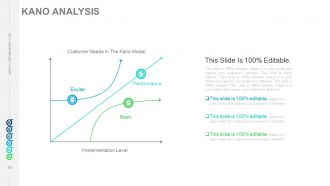
Slide 16: This slide presents a Kano Analysis with Customer Needs In The Kano Model graph.
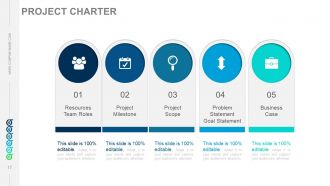
Slide 17: This slide presents a Project Charter with- Resources Team Roles, Project Milestone, Project Scope, Problem Statement Goal Statement, Business Case.
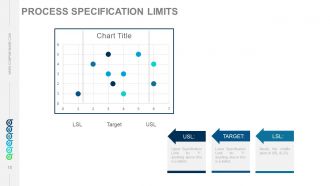
Slide 18: This slide displays Process Specification Limits with charts and arrow imagery.
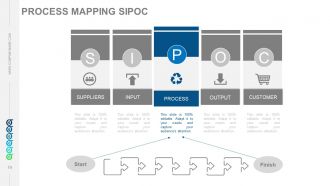
Slide 19: This slide displays Process Mapping SIPOC consisting of- Suppliers, Input, Process, Output, Customers.
Slide 20: This is another Process Mapping SIPOC slide with their respective icons.
Slide 21: This slide showcases Process Mapping Flow Charting with Start and End text boxes to be filled as per need.
Slide 22: This slide displays STEP 2: MEASURE of DMAIC process.
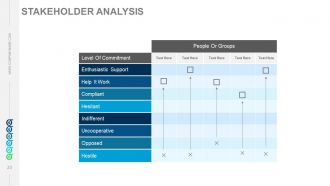
Slide 23: This slide displays STAKEHOLDER ANALYSIS with the following points- Level of commitment, Enthusiastic support, Help it work, Compliant, Hesitant, Indifferent, Uncooperative, Opposed, Hostile.
Slide 24: This slide showcases a Value Stream Map. Present information, specifications etc. here.
Slide 25: This is Value Stream Mapping slide with arrow imagery.
Slide 26: This is a Check Sheet slide. Present information, specifications etc. here.
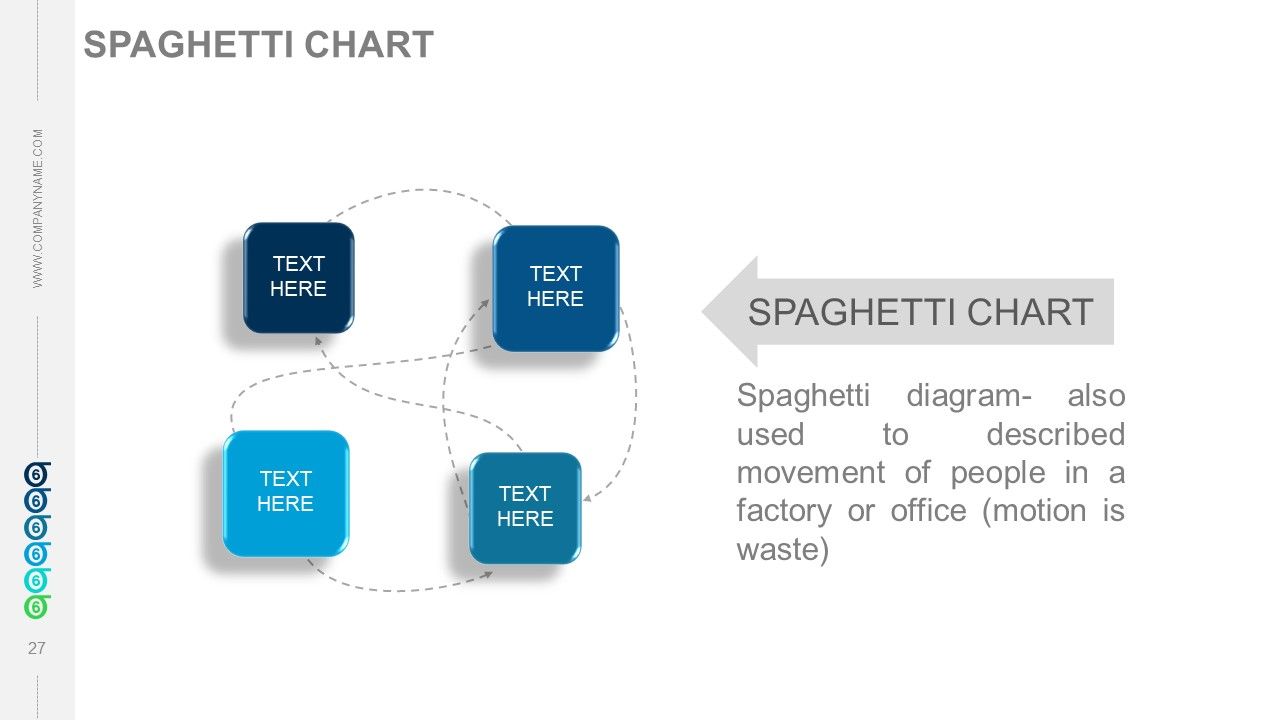
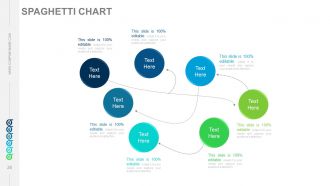
Slide 27: This is a Spaghetti Chart slide to show information, specifications etc.
Slide 28: This is another Spaghetti Chart slide.
Slide 29: This slide displays 5s Analsyis listed as- Standardise, Sustain, Straighten, Shine, Sort.
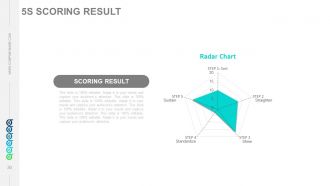
Slide 30: This slide presents 5s Scoring Result in a Radar Chart form.
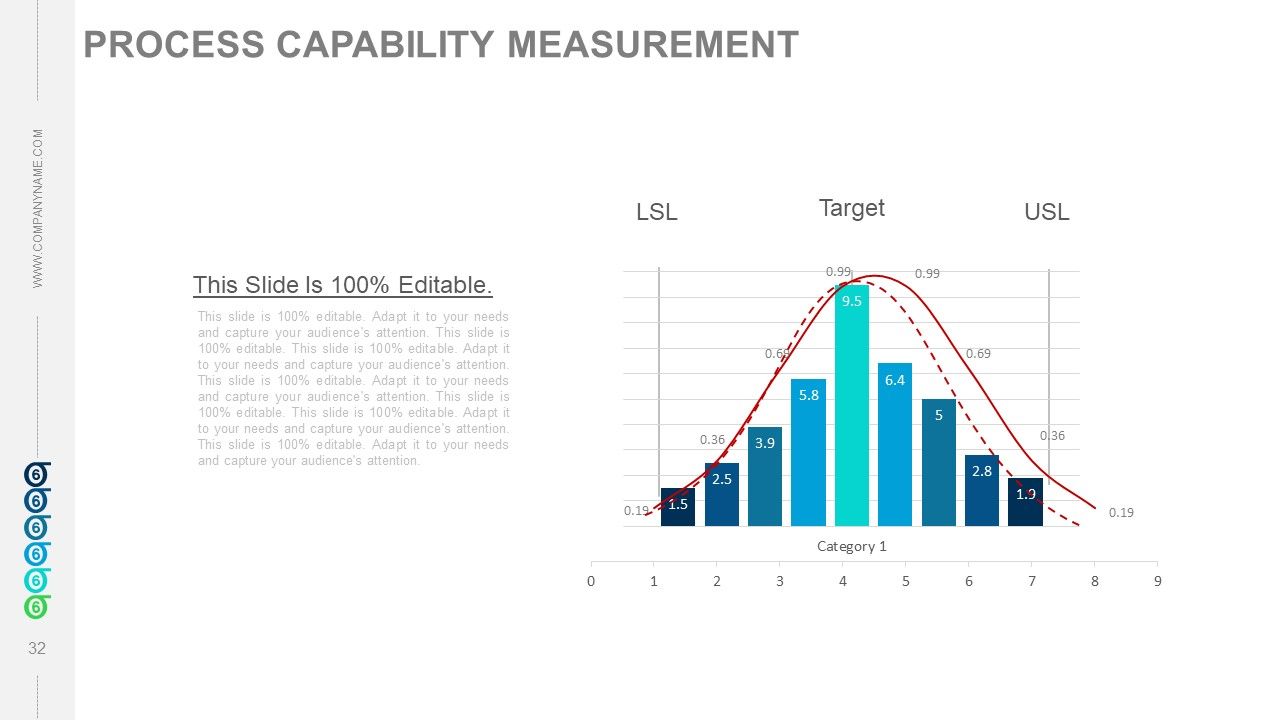
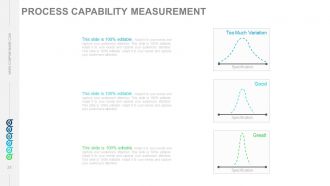
Slide 31: This slide displays Process Capability Measurement in terms of Specification with Too Much Variation, Good, and Great! as parameters.
Slide 32: This is another Process Capability Measurement slide.
Slide 33: This slide showcases an XBAR and R-CHART. Present information, specifications etc. here.
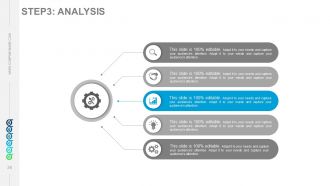
Slide 34: This slide presents STEP3: ANALYSIS of DMAIC process.
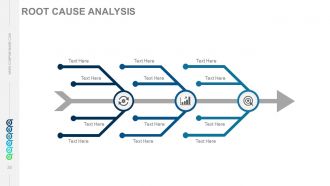
Slide 35: This slide presents a Root Cause Analysis in Fishbone diagram form.
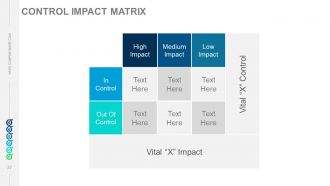
Slide 36: This slide presents a Control Impact Matrix.
Slide 37: This is another slide showcasing Control Impact Matrix.
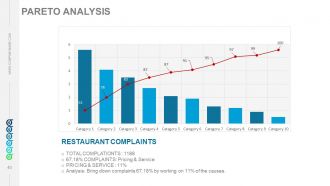
Slide 38: This slide showcases a Pareto Analysis with Reasons and Complaints.
Slide 39: This slide showcases a Pareto Chart.
Slide 40: This is another Pareto Analysis slide.
Slide 41: This slide showcases Process Map Analysis with- Issue order, Cancel order, Deliver Goods, Process order, Refund order, Requested- submit order, Requested Deposit, Complete order, Re- submit order, Deposit.
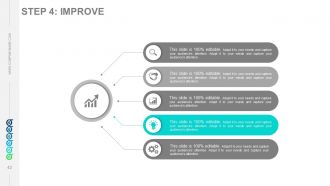
Slide 42: This slide presents STEP 4: Improve of DMAIC process.
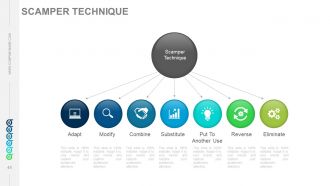
Slide 43: This slide showcases Scamper Technique which includes- Combine, Substitute, Adapt, Magnify, Rearrange, Eliminate, Put To Other Uses.
Slide 44: This is another Scamper Technique slide with text boxes to be filled as per need.
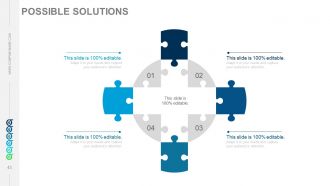
Slide 45: This slide showcases Possible Solutions with puzzle imagery.
Slide 46: This is another Possible Solutions slide with creative key imagery.
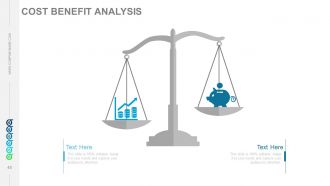
Slide 47: This slide displays Cost Benefit Analysis in balancing scale image form.
Slide 48: This is another Cost Benefit Analysis slide with text boxes and creative imagery.
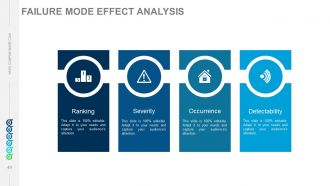
Slide 49: This slide presents Failure Mode Effect Analysis with the following points- Ranking, Severity, Occurrence, Detectability.
Slide 50: This slide showcases STEP 5 Control of DMAIC process.
Slide 51: This slide presents Statistical Process Control in a bar graph form with- Upper Control Limit (UCL), Lower Control Limit (UCL), Process output.
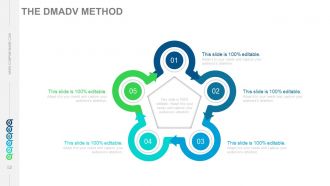
Slide 52: This slide presents The DMADV Method. Present information, specifications etc. here.
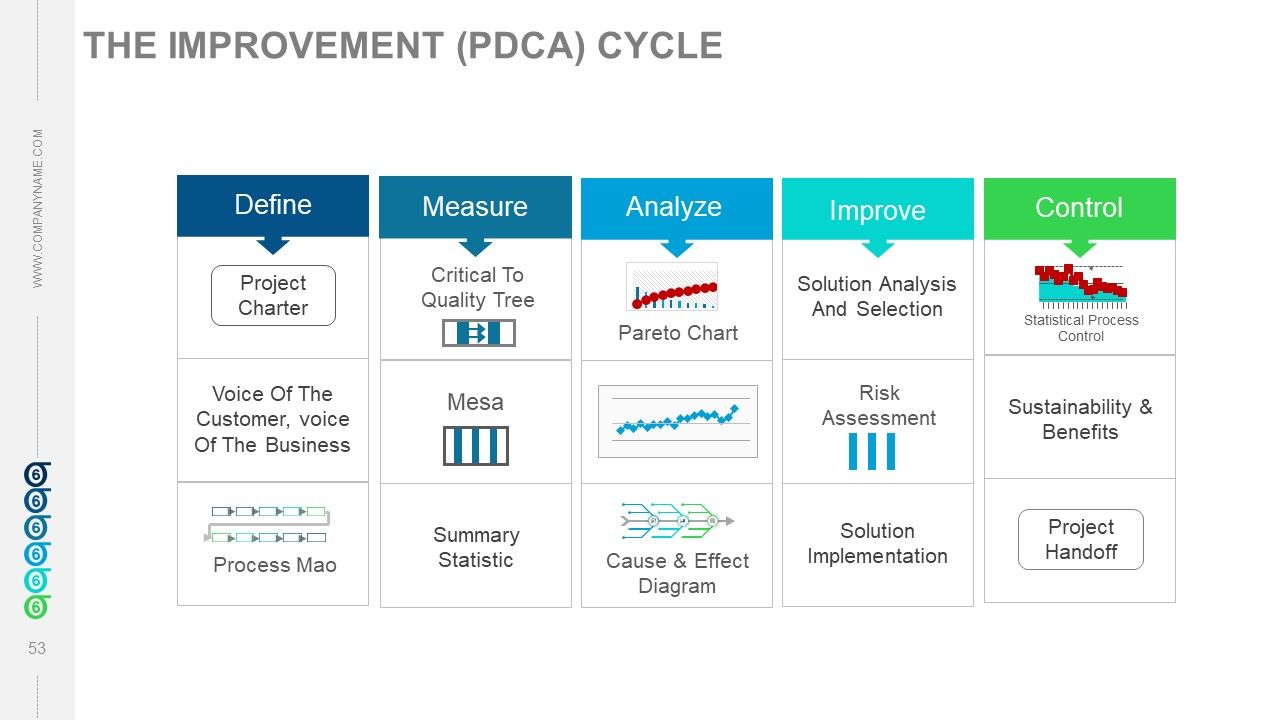
Slide 53: This slide displays The Improvement (PDCA) Cycle with the following sub headings- Define, Measure, Analyze, Improve, Control.
Slide 54: This is Our Vision slide with imagery. State your Mission, Vision, Values and Goals here.
Slide 55: This slide showcases Our Team with name and designation to fill.
Slide 56: This is Target With Arrow image slide. State your targets etc. here.
Slide 57: This slide displays Key Metrics Performance with relevant imagery.
Slide 58: This is a World Map image slide to show global growth, presence etc.
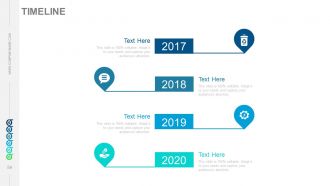
Slide 59: This slide presents a Timeline to show growth, milestones etc.
Slide 60: This is a THANK YOU slide for acknowledgement/ mark an end to the presentation.
Six sigma principles and concepts powerpoint presentation with slides with all 60 slides:
Give your thoughts the compact look. Fit them into our acommodative Six Sigma Principles And Concepts Complete Powerpoint Deck With Slides.
-
good presentation
-
Unique design & color.
-
Editable templates with innovative design and color combination.


