Matrix chart
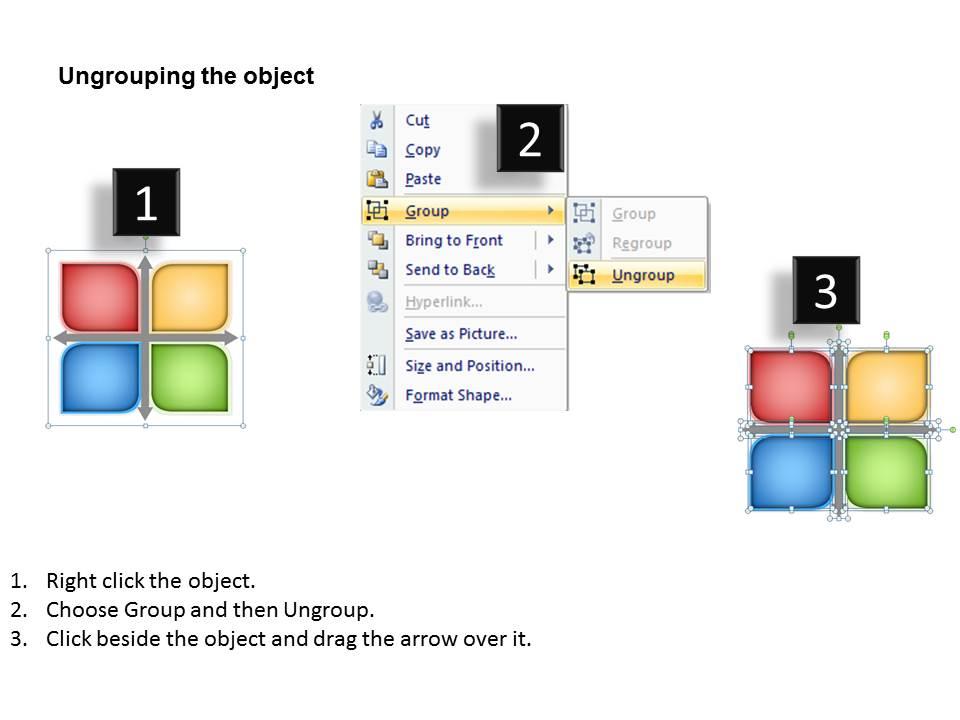
If you looking around for the best Matrix based presentation design, you are fortunately at the right place. We have this wonderfully designed Matrix Chart PPT template to showcase the relationships between one or two variables in a sophisticated format. The matrix chart is basically a table that gives information about the relationships, establish pairings between two, display the comparative values and simply make everything visible on a single glance. The audience can have a succinct synopsis of the situation which discreet the data in dots units while representing categories grouped together in a matrix. These are in fact used to offer a very rapid overview of the distribution and the proportions of every category in a data set for distribution and proportion across other datasets. A user can thus easily create a table representing the measure visually, offering you to rapidly pinpoint the extreme values. Crystallize your thoughts on our Matrix Chart. They will evolve into a definite plan.
You must be logged in to download this presentation.
 Impress your
 audience
Editable
of Time
PowerPoint presentation slides
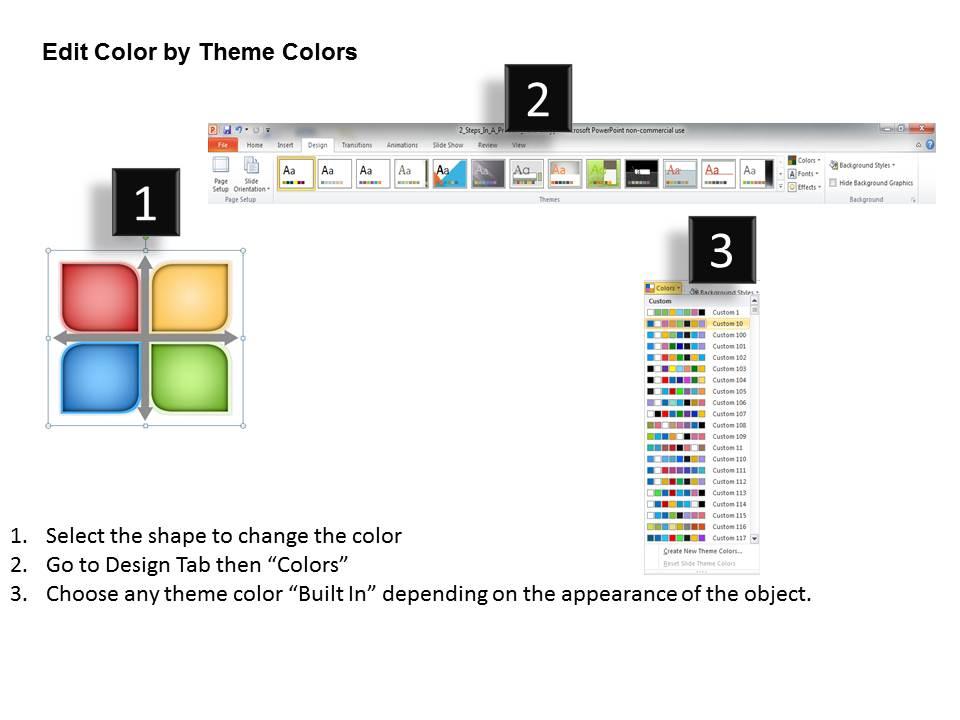
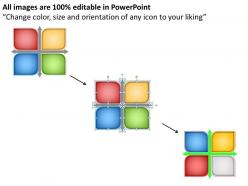
High resolution of the images and the business icons. Add or remove the image and the graphics. Insert your brand name or logo while removing the trademark from the slides. 100% accessibility to edit and make the desired changes. Advantageous for the global marketers, entrepreneurs and the management professionals.
People who downloaded this PowerPoint presentation also viewed the following :
Matrix chart with all 5 slides:
Hit the nail on the head with our Matrix Chart. Your ideas will set the bells ringing loud and clear.
-
Great product with highly impressive and engaging designs.
-
I discovered this website through a google search, the services matched my needs perfectly and the pricing was very reasonable. I was thrilled with the product and the customer service. I will definitely use their slides again for my presentations and recommend them to other colleagues.


