Heatmap table
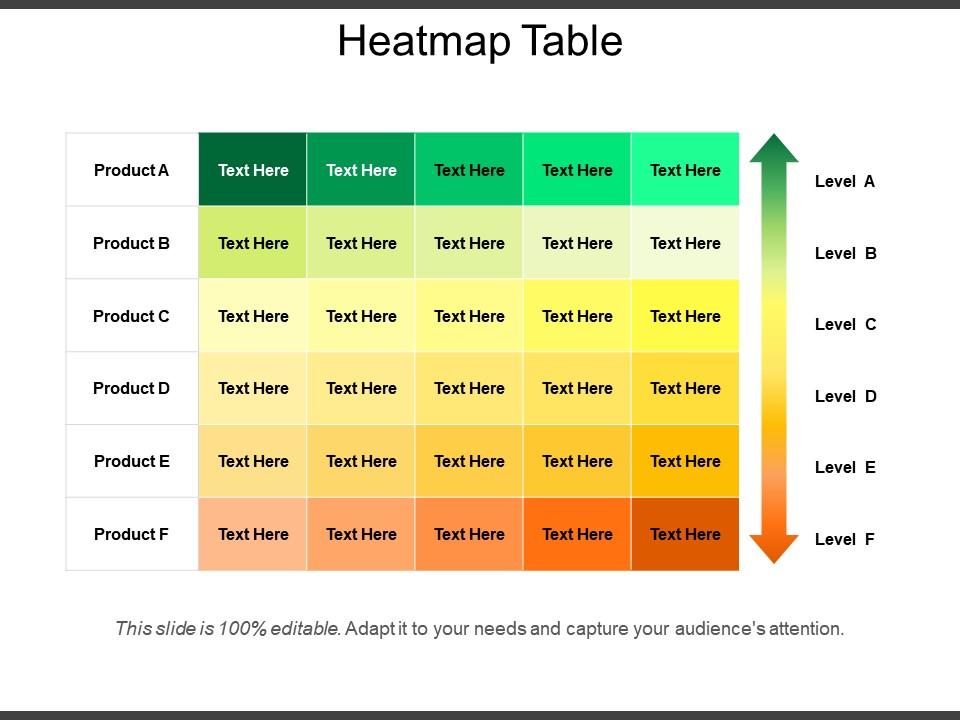
Showcase your site analytics and predict the behavior of visitors instantly by using the Heatmap Table presentation template. Highlight which part of a page receives more attention with the aid of this correlation heatmap PowerPoint graphic. With the help of the web analytics PPT slideshow, you can visualize the amount of multiple information within a dataset more clearly. You can represent the data easily that utilizes the color-coded systems using the statistical graphics PowerPoint slide. Employ the heatmap chart PPT visual to depict the individual values contained in a matrix. Take the assistance of a business mapping PPT theme to track a large amount of data quickly to make informed decisions. Use high-grade icons that are present in the slide which makes your presentation communicative and knowledgeable. You can calculate the density of records and lead your business more effectively by downloading our ready-to-use data graphical representation presentation slide.
You must be logged in to download this presentation.
 Impress your
 audience
Editable
of Time
PowerPoint presentation slides
Presenting the Heatmap Table PPT theme which is designed by our professionals for your convenience. You can alter the font, color, font size, and font types of the slides as per your needs. This template is compatible with Google Slides which makes it easily accessible at once. It can be changed into various formats like PDF. PNG, and JPG. The slide is readily available in both 4:3 and 16:9 aspect ratio.
People who downloaded this PowerPoint presentation also viewed the following :
Heatmap table with all 5 slides:
Handle it beautifully with our Heatmap Table. You will acquire the firmest grip.
-
Enough space for editing and adding your own content.
-
Great designs, really helpful.


