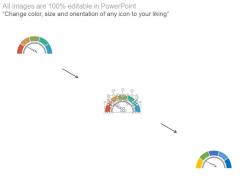
Four Dashboards Snapshot And Percentage Diagram Powerpoint Slides
PowerPoint presentation is the most useful way to present the ideas and information in a systematic way. It becomes pretty easy to understand out of PPT slides. Keeping this in mind we have come up with presentation slide designs of four dashboard snapshot and percentage diagram to explain the concept of financial strategy and analysis. We have designed PowerPoint infographics for business data in dashboard, icons for business vision .Our experts have designed ready to use four dashboard snapshot and percentage template especially for executives involved in conceptualizing business and finance related concepts. You just click on the PPT design and explore your knowledge.
You must be logged in to download this presentation.
 Impress your
 audience
Editable
of Time
PowerPoint presentation slides
It consists of high resolution ppt slides to address all business and finance related concepts. Appealing background, color, layout and font. Can be easily converted into PDF or JPG. Alluring graphs for comparison and fascinating figures to illustrate the concepts. Useful for corporate people, researchers and business professionals.
People who downloaded this PowerPoint presentation also viewed the following :
Four Dashboards Snapshot And Percentage Diagram Powerpoint Slides with all 4 slides:
Decades contract with our Four Dashboards snapshot And Percentage Diagram Powerpoint Slides. Your advance to your goals will get accelerated.
-
Very well designed and informative templates.
-
Content of slide is easy to understand and edit.


