Heatmap graph
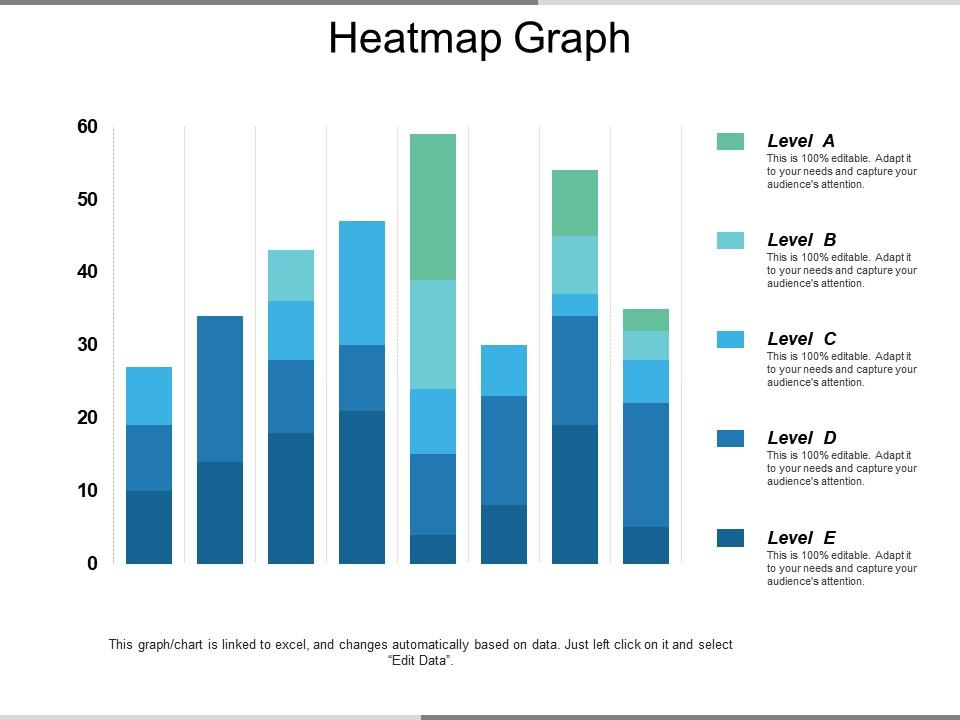
Highlight the overall amount of data in a visual manner with the aid of the Heatmap Graph PPT slideshow. Use a data visualization presentation template to explain how to utilize the color-coded systems to fetch specific information. Showcase the site analytics of your business with the aid of this heat map chart PowerPoint graphic and grab the attention of various stakeholders. With the help of web analytics PPT visual, you can mention the different steps that allow you to track a large amount of data in an appropriate manner. Take the assistance of our statistical graphics PowerPoint layout to determine the overall activities generated on your site. Employ the business mapping PPT theme to plot a large number of data using different colors. Included here are various high-quality icons with which you can make your presentation impressive and knowledgeable. You can assess where your users have clicked on a page by downloading our ready-to-use correlation heatmap PowerPoint slide.
You must be logged in to download this presentation.
 Impress your
 audience
Editable
of Time
PowerPoint presentation slides
Presenting the Heatmap Graph PowerPoint theme which is designed professionally for your convenience. Open and save your presentation in various formats like PDF, JPG, and PNG. You can freely access your presentation in both 4:3 and 16:9 aspect ratio. Alter the font, color, font size, and font types of the slides as per your needs. This template is compatible with Google Slides which makes it easily accessible at once.
People who downloaded this PowerPoint presentation also viewed the following :
Heatmap graph with all 5 slides:
Cater for the infirm with our Heatmap Graph. Create conditions conducive to them.
-
Innovative and attractive designs.
-
Excellent template with unique design.


