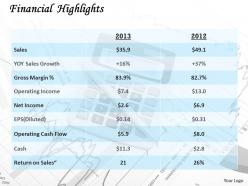
0314 financial sales growth chart
0314 Financial Sales Growth Chart, has been designed by our team of very professional experts just as per your requirement as it helps to annually calculate the company’s earnings, dividends and shares profit. The PowerPoint presentation can be used to relate to the customers demand after the launch of new product and check for volatility and risk stocks thus in a way it helps to keep an edge over the competitors. In order to have potentially large gains with the sharing of important and customized information with the client base can be done with the help of PPT graphic. The PowerPoint design can be used to cover the interest, make good debt to equity ratio and thus mark a push to increase the sales of goods and services offered by the respective company. A comprehensive set of data can be used and bifurcated into direct labor cost, cost of goods sold, advertising and marketing expenses, technology and salaries expense and other licensing fees can be added in presentation slide.Presentations that thrill are only a click away. Our 0314 Financial Sales Growth Chart are ready to use in seconds.
You must be logged in to download this presentation.
 Impress your
 audience
Editable
of Time
PowerPoint presentation slides
Presentation slide is beneficial for clients, managers, project in charge, financial sector and business conferences. Color, style and position can be standardized, supports font size which can be read from a distance. PPT slide is compatible with Microsoft 2010 and 2013 versions. Text and graphics can be placed on the slide. PPT diagram 100% compatible with Google slide.
People who downloaded this PowerPoint presentation also viewed the following :
0314 financial sales growth chart with all 5 slides:
Our 0314 Financial Sales Growth Chart contain no boo-boos. They are combed carefully for errors.
-
Qualitative and comprehensive slides.
-
Design layout is very impressive.


