- Sub Categories
-
 Four arrows labels with percentage charts powerpoint slides
Presenting four arrows labels with percentage charts powerpoint slides. This Power Point template slide has been crafted with graphic of four arrows labels and percentage chart. This PPT slide contains the concept of financial data analysis. Use this PPT slide for business and finance related presentations.
-
 Four different price tags for finance powerpoint slides
Presentation slide graphic of four different price tags for finance. Can be used by marketers, sales people, business analysts, etc. Compatible with number of software options. Colors and text can be easily changed as the PPT slide is completely editable. Personalize the presentation with individual company name and logo. Available in both Standard and Widescreen slide size. Easy and quick downloading process. Flexible option for conversion in PDF or JPG formats. Can use with Google slides.
-
 Four tags for business activity levels powerpoint slides
Presenting four tags for business activity levels powerpoint slides. This Power Point template slide has been crafted with graphic of four tags. This PPT slide contains the concept of business activity levels representation. Use this PPT slide for business and finance related presentations.
-
 Four tags with price list for financial mangement powerpoint slides
Presenting four tags with price list for financial mangement powerpoint slides. This Power Point template slide has been crafted with graphic of four tags and price list. This PPT slide contains the concept of financial management. Use this PPT slide for business and finance related presentations.
-
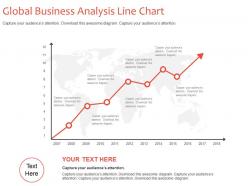 Global business analysis line chart powerpoint slides
Presenting global business analysis line chart powerpoint slides. This Power Point template slide has been crafted with graphic of line chart. This PPT slide contains the concept of global business analysis representation. Use this PPT slide for business and finance related presentations.
-
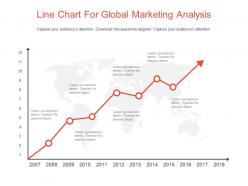 Line chart for global marketing analysis powerpoint slides
Presenting line chart for global marketing analysis powerpoint slides. This Power Point template slide has been crafted with graphic of line chart. This PPT slide contains the concept of global marketing analysis representation. Use this PPT slide for business and marketing related presentations.
-
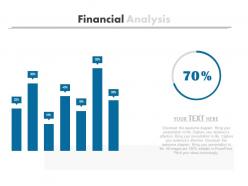 Percentage cycle with bar graph for financial analysis powerpoint slides
Presenting percentage cycle with bar graph for financial analysis powerpoint slides. This Power Point template slide has been crafted with graphic of percentage cycle and bar graph. This PPT slide contains the concept of financial analysis. Use this PPT slide for business and finance related presentations.
-
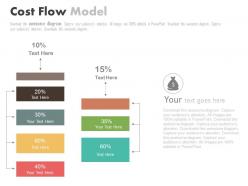 Seven staged cost flow model powerpoint slides
Presenting seven staged cost flow model powerpoint slides. This Power Point template slide has been crafted with graphic of seven staged cost flow model. This PPT slide contains the concept of financial analysis. Use this PPT slide for business and finance related presentations.
-
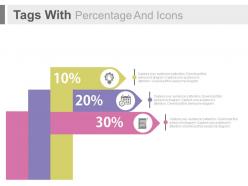 Three tags with percentage and icons powerpoint slides
Presenting three tags with percentage and icons powerpoint slides. This Power Point template slide has been crafted with graphic of three tags and percentage diagram. This PPT slide contains the concept of financial data analysis. Use this PPT slide for business and finance related presentations.
-
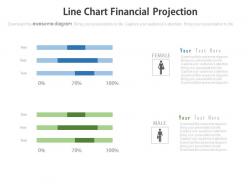 Two line charts financial projection powerpoint slides
Presenting two line charts financial projection powerpoint slides. This Power Point template slide has been crafted with graphic of two line chart. This PPT slide contains the concept of financial projection. Use this PPT slide for business and finance related presentations.
-
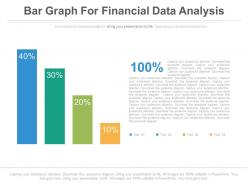 Bar graph for financial data analysis powerpoint slides
Presenting bar graph for financial data analysis powerpoint slides. This Power Point template diagram with graphic of bar graph and finance icons. This PPT diagram contains the concept of financial data analysis. Use this PPT diagram for business and finance related presentations.
-
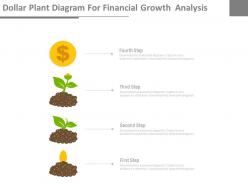 Dollar plant diagram for financial growth analysis powerpoint slides
Presenting dollar plant diagram for financial growth analysis powerpoint slides. This Power Point template diagram with graphic of dollar plant and finance icons. This PPT diagram contains the concept of financial growth analysis. Use this PPT diagram for business and finance related presentations.
-
 Financial analysis table with five segments powerpoint slides
Presenting financial analysis table with five segments powerpoint slides. This Power Point template diagram with graphic of finance table with five segments. This PPT diagram contains the concept of financial analysis. Use this PPT diagram for business and finance related presentations.
-
 Financial planning with icons for analysis powerpoint slides
Presenting financial planning with icons for analysis powerpoint slides. This Power Point template diagram with graphic of finance icons. This PPT diagram contains the concept of financial planning and analysis. Use this PPT diagram for business and finance related presentations.
-
 Five circles and icons for social media networking powerpoint slides
Presenting five circles and icons for social media networking powerpoint slides. This Power Point template diagram with graphic of five circles and icons. This PPT diagram contains the concept of social media networking. Use this PPT diagram for business and internet related presentations.
-
 Four circle chart with finance percentage diagram powerpoint slides
Presentation slide representing circle charts with finance percentages. Useful combination of charts and percentages. Compatible with number of software options. Colors, text and fonts can be easily changed as the PPT slide is completely editable. Personalize the presentation with individual company name and logo. Available in both Standard and Widescreen slide size. Easy and quick downloading process. Flexible option for conversion in PDF or JPG formats. Can use with Google slides.
-
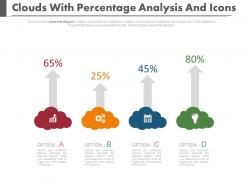 Four clouds with percentage analysis and icons powerpoint slides
Presenting four clouds with percentage analysis and icons powerpoint slides. This Power Point template diagram with graphic of four clouds and percentage. This PPT diagram contains the concept of financial analysis. Use this PPT diagram for business and finance related presentations.
-
 Four directional financial analysis chart powerpoint slides
Presenting four directional financial analysis chart powerpoint slides. This Power Point template diagram with graphic of four directional chart. This PPT diagram contains the concept of financial analysis. Use this PPT diagram for business and finance related presentations.
-
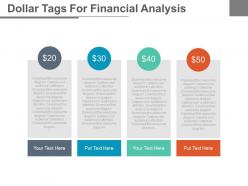 Four dollar tags for financial analysis powerpoint slides
Presenting four dollar tags for financial analysis powerpoint slides. This Power Point template diagram with graphic of four dollar tags. This PPT diagram contains the concept of financial analysis. Use this PPT diagram for business and finance related presentations.
-
 Four pyramids with percentage analysis powerpoint slides
Presenting four pyramids with percentage analysis powerpoint slides. This Power Point template diagram with graphic of four pyramid and percentage. This PPT diagram contains the concept of percentage analysis. Use this PPT diagram for business and finance related presentations.
-
 Four staged financial tags for analysis powerpoint slides
Presenting four staged financial tags for analysis powerpoint slides. This Power Point template diagram with graphic of four staged tags. This PPT diagram contains the concept of financial analysis. Use this PPT diagram for business and finance related presentations.
-
 Four staged gender ratio analysis chart powerpoint slides
Presenting four staged gender ratio analysis chart powerpoint slides. This Power Point template diagram with graphic of four staged gender ratio chart. This PPT diagram contains the concept of gender ratio analysis. Use this PPT diagram for business and finance related presentations.
-
 Four staged pricing table with icons powerpoint slides
The visuals bear a high-class image display with no error of pixilation. The option of unlimited customization stays with you to experiment with the colour scheme, orientation features, and size adjustment. Save the said template in various file formats with an easy download option. The templates are fully congruent to Google slides. Explore the feasible options to recast the slides with a complete guide that follows the Ppt.
-
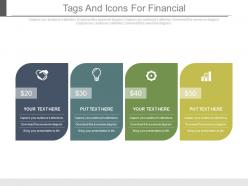 Four tags and icons for financial update powerpoint slides
The visuals impose a stunning impact with its high-resolution picture quality. Download the template in various file formats available. Conduct an easy play of templates in Google slides and other software options. Utilize the unlimited customize options to fabricate the Ppt as per your suitability. Insert the desired text and other details of your company with a few clicks.
-
 Four tags and icons with percentage analysis powerpoint slides
Presenting four tags and icons with percentage analysis powerpoint slides. This Power Point template diagram with graphic of four staged tags and icons. This PPT diagram contains the concept of percentage analysis. Use this PPT diagram for business and finance related presentations.
-
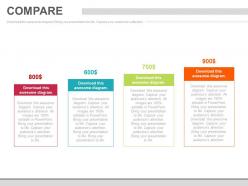 Four tags for comparison analysis chart powerpoint slides
Presenting four tags for comparison analysis chart powerpoint slides. This Power Point template diagram with graphic of four tags and icons. This PPT diagram contains the concept of comparison analysis. Use this PPT diagram for business and finance related presentations.
-
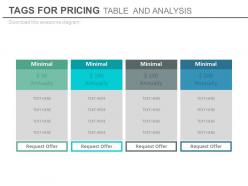 Four tags for pricing tables and analysis powerpoint slides
Compelling mix of PPT icons, text, content and background. Pre designed PowerPoint Infographic. Harmonious with large number of software options. Hassle free adaptation in any format. Easy to embrace personalized elements like company logo and name. Hassle free editing of font, color, shade, shape and orientation. Excellence in picture quality even on wide screen output. Used by marketers, businessman, strategists, educationists, financiers, students and stakeholders.
-
 Four tags for total sales analysis powerpoint slides
Presenting four tags for total sales analysis powerpoint slides. This Power Point template diagram with graphic of four tags and icons. This PPT diagram contains the concept of total sales analysis. Use this PPT diagram for business and finance related presentations.
-
 Four tags with dollar values for financial analysis powerpoint slides
Presenting four tags with dollar values for financial analysis powerpoint slides. This is a four tags with dollar values for financial analysis powerpoint slides. This is a four stage process. The stages in this process are financials.
-
 Six staged percentage analysis chart powerpoint slides
Presenting six staged percentage analysis chart powerpoint slides. This Power Point template diagram with graphic of six staged percentage chart. This PPT diagram contains the concept of financial analysis. Use this PPT diagram for business and finance related presentations.
-
 Tap and water drop diagram for data powerpoint slides
Brimming with aesthetic appeal and professional parameters. Uncluttered and intense projection of relevant visuals. Harmonious use of PPT icons, colors, fonts and designs with respect to the subject. Freedom to execute changes in slide background as per individual’s preference. Flexibility to customize it with company specific elements like name, logo and trademark. Compatibility with multiple software and format options. High resolution and stupendous quality visuals. Used by several business strategists, stakeholders, managers, students, financiers, sales professionals and entrepreneurs.
-
 Three pie charts with percentage analysis powerpoint slides
Splendid picture quality which does not pixelate when projected on wide screen. Compatible with multiple online/offline software options. Compatible with multiple format options like JPEG/JPG/PNG. Easy to comprehend and visually appealing. Ease of personalization with own name, logo or trademark insertion. 100 percent editable PowerPoint slide design. Modify the icons, colors, shades, orientation or even font as per your choice. Widely applicable by varied group of professionals, students, freelancers and more.
-
 Three social networks google plus viber and linkdin powerpoint slides
Presenting three social networks google plus viber and linkdin powerpoint slides. This Power Point template diagram with graphic of three social networks. This PPT diagram contains the concept of social networking for google,viber and LinkedIn. Use this PPT diagram for business and finance related presentations.
-
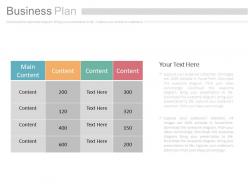 Three staged business planning diagram powerpoint slides
No risk of picture pixilation whatever be the size of display screen. Allow instant downloading and saving of the slide design. Follow the provided instructions to modify the layout and customize it. Fix the background with your business trademark or logo. Use additional icons available to download. Beneficial for the business managers, traders, presenters and the relevant individuals in a trading company.
-
 Three staged sales info year based chart powerpoint slides
Presenting three staged sales info year based chart powerpoint slides. This Power Point template diagram with graphic of three staged year info chart diagram. This PPT diagram contains the concept of year based sales planning. Use this PPT diagram for business and sales related presentations.
-
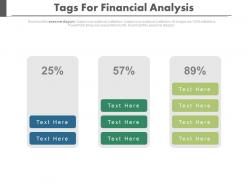 Three staged tags for financial analysis diagram powerpoint slides
Presenting three staged tags for financial analysis diagram powerpoint slides. This Power Point template diagram with graphic of three staged tags diagram. This PPT diagram contains the concept of financial analysis. Use this PPT diagram for business and finance related presentations.
-
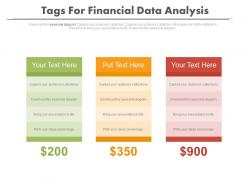 Three tags for financial data analysis powerpoint slides
Presenting three tags for financial data analysis powerpoint slides. This Power Point template diagram with graphic of three staged tags diagram. This PPT diagram contains the concept of financial data analysis. Use this PPT diagram for business and finance related presentations.
-
 Triangle with financial and employee ratio analysis powerpoint slides
Presenting triangle with financial and employee ratio analysis powerpoint slides. This Power Point template diagram with graphic of triangle and finance icons diagram. This PPT diagram contains the concept of employee ratio analysis. Use this PPT diagram for business and finance related presentations.
-
 Triangle with percentage financial analysis powerpoint slides
Presenting triangle with percentage financial analysis powerpoint slides. This Power Point template diagram with graphic of triangle and percentage diagram. This PPT diagram contains the concept of financial analysis. Use this PPT diagram for business and finance related presentations.
-
 Two data driven chart for comparison powerpoint slides
Presenting two data driven chart for comparison powerpoint slides. This Power Point template diagram with graphic of two data driven chart diagram. This PPT diagram contains the concept of data comparison analysis. Use this PPT diagram for business and finance related presentations.
-
 Two data driven comparison charts for analysis powerpoint slides
Presenting two data driven comparison charts for analysis powerpoint slides. This Power Point template diagram with graphic of two data driven chart diagram. This PPT diagram contains the concept of data comparison analysis. Use this PPT diagram for business and finance related presentations.
-
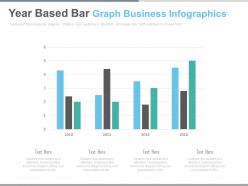 Year based bar graph business infographics powerpoint slides
Presenting year based bar graph business infographics powerpoint slides. This Power Point template diagram with graphic of year based bar graph diagram. This PPT diagram contains the concept of data analysis. Use this PPT diagram for business and finance related presentations.
-
 Ppts channel percentage kpis key performance indicator evaluate success powerpoint slides
This PPT Template can be used by professionals for representing their business and management ideas by the means of Percentage Kpis Key Performance Indicator Evaluate presentations. You can change the color of the elements shown in the figure and also edit the text to write a short brief about your company's matters. This PPT slide is also available in full screen mode.
-
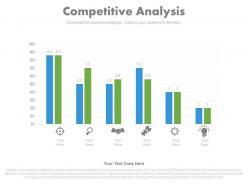 View competitive data analysis to identify opportunities and threats powerpoint slides
Presenting view competitive data analysis to identify opportunities and threats powerpoint slides. This Power Point template slide has been crafted with graphic of data bar graph and pie charts icons. This PPT slide contains the concept of competitive data analysis and identity opportunities representation. Use this PPT slide for business and marketing related presentations.
-
 New current quarter portfolio bar chart powerpoint slides
This PPT slide can be used by anyone looking to project their business process through a flow chart. This PowerPoint template is 100% editable, which means text, color, and shapes of the given elements can be altered according to your liking and you can choose icons among the thousands of options available. These slides are also compatible with Google slides.
-
 Apt current quarter portfolio for business analysis powerpoint slides
Other than providing you with an excellent experience this PPT slide can be used by professionals for discussing financial and business matters using a flow chart. You can easily ungroup the elements shown in the diagram and according to your liking. Download this slide and insert your company's logo for a professional look and experience it in full screen version.
-
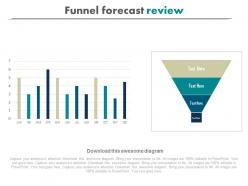 Download funnel forecast review powerpoint slides
Presenting download funnel forecast review powerpoint slides. This Power Point template slide has been crafted with graphic of funnel and bar graph charts. This PPT slide contains the concept of result analysis. Use this PPT slide for business and marketing related presentations.
-
 Ppt funnel forecast review table powerpoint slides
Presenting ppt funnel forecast review table powerpoint slides. This Power Point template slide has been crafted with graphic of funnel and bar graph charts. This PPT slide contains the concept of business forecast and review. Use this PPT slide for business and marketing related presentations.
-
 New next quarter deals to identify sales pipeline powerpoint slides
Presenting new next quarter deals to identify sales pipeline powerpoint slides. This Power Point template slide has been crafted with graphic of section chart. This PPT slide contains the concept of sales strategy and deal representation. Use this PPT slide for business and sales related presentations.
-
 Use quarter percentage track record powerpoint slides
Presenting use quarter percentage track record powerpoint slides. This Power Point template slide has been crafted with graphic of percentage icons. This PPT slide contains the concept of data record analysis. Use this PPT slide for business and sales related presentations.
-
 View quarter track record line chart powerpoint slides
Editable PPT Slide for viewing quarterly track record line chart. Compatible with numerous format options like JPEG, JPG or PDF. Access to inclusion and exclusion of contents as per specific needs of any business. Provides a professional outlook to your PowerPoint presentation. Beneficial for business professionals, students, teachers, business analysts and strategists. Customization of each PowerPoint graphic and text according to your desire and want. Available in Widescreen slide size also. Freedom to customize it with company name and logo.
-
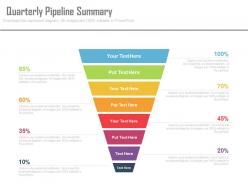 New quarterly pipeline summary powerpoint slides
New quarterly pipeline summary PPT Slide. Proper balance of colors, shapes and stages in relation to presentation topic. High resolution and fine quality PowerPoint slides. Easy and quick downloading. Compatible with multiple software options available both online and offline. Widely used by business owners, strategists, marketers, investors, financial executives, professors and students. Guidance for executing the changes has been provided for assistance. Modify and personalize the presentation by including the company name and logo.
-
 Ppt sales performance versus target indicator dial dashboard powerpoint slides
High resolution Dial Dashboard Diagram doesn’t pixel ate, while being projected on big screen. Easy to embed company logo/ trademark. Well compatible with Google slides. Quick and easy downloading process. Amendable font style, design and the content of the icons or the PPT Slides. Valuable for entrepreneurs, students, researchers and employees.
-
 App sales rep performance scorecard to understand sales numbers powerpoint slides
Simple, hassle free and swift to download. Absolutely editable PPT infographics – alter the color scheme and contrast. No change in high resolution of PPT images after editing. Add text to supplement the graphics to suit the context of your presentation. Modify the size and orientation of presentation icons to your liking. Insert your company logo, brand name, trademark etc.
-
 Water drop design with percentage flat powerpoint design
The PowerPoint presentation ensures proofing and editing with ease. Presentation slide is of utmost use to management professionals, big or small organizations and business startups. Text and graphic can be put on show in the same PPT slide. PPT diagram supports recasting the color, size and orientation according to the requirement. High resolution in color and art shape is offered by PPT slide.
-
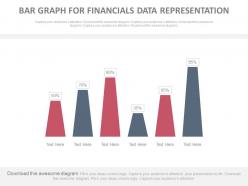 Bar graph for financial data representation powerpoint slides
Presenting bar graph for financial data representation powerpoint slides. This Power Point template slide has been crafted with graphic of bar graph and data. This PPT slide contains the concept of financial data representation. Use this PPT slide for business and finance related presentations.
-
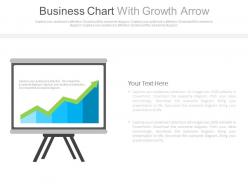 Business chart with growth arrow for finance powerpoint slides
Presenting business chart with growth arrow for finance powerpoint slides. This Power Point template slide has been crafted with graphic of business chart and growth arrow. This PPT slide contains the concept of financial data analysis and growth representation. Use this PPT slide for business and finance related presentations.
-
 Date and days chart for financial process powerpoint slides
Presenting date and days chart for financial process powerpoint slides. This Power Point template slide has been crafted with graphic of date and days chart. This PPT slide contains the concept of financial process flow representation. Use this PPT slide for business and finance related presentations.
-
 Doughnut chart with percentage analysis powerpoint slides
Presenting doughnut chart with percentage analysis powerpoint slides. This Power Point template slide has been crafted with graphic of doughnut chart and percentage. This PPT slide contains the concept of financial data analysis representation. Use this PPT slide for business and finance related presentations.
-
 Financial data table for analysis powerpoint slides
Presenting financial data table for analysis powerpoint slides. This Power Point template slide has been crafted with graphic of data table. This PPT slide contains the concept of financial data analysis. Use this PPT slide for business and finance related presentations.
-
Excellent Designs.
-
Attractive design and informative presentation.
-
Easy to edit slides with easy to understand instructions.
-
Excellent design and quick turnaround.
-
Excellent design and quick turnaround.
-
Designs have enough space to add content.
-
Easily Understandable slides.
-
Unique research projects to present in meeting.
-
Good research work and creative work done on every template.
-
Excellent work done on template design and graphics.


