- Sub Categories
-
 Use five staged mountain chart and icons for business analysis flat powerpoint design
Presenting use five staged mountain chart and icons for business analysis flat powerpoint design. This Power Point template diagram slide has been crafted with graphic of five staged mountain chart and icons diagram This PPT diagram contains the concept of business analysis representation. Use this PPT diagram for business and marketing related presentations.
-
 One test tubes with percentage analysis flat powerpoint design
Presenting one test tubes with percentage analysis flat powerpoint design. This Power Point template diagram slide has been crafted with graphic of test tubes and percentage diagram. This PPT diagram contains the concept of financial analysis. Use this PPT diagram for business and marketing related presentations.
-
 View bar chart with icons for financial analysis flat powerpoint design
Presenting view bar chart with icons for financial analysis flat powerpoint design. This Power Point template diagram has been crafted with graphic of bar chart and icons diagram. This PPT diagram contains the concept of financial analysis representation .Use this PPT diagram for business and finance related presentations.
-
 App bar graph and percentage for new marketing strategy flat powerpoint design
Presenting app bar graph and percentage for new marketing strategy flat powerpoint design. This Power Point template diagram has been crafted with graphic of bar graph and percentage diagram. This PPT diagram contains the concept of new marketing strategy representation .Use this PPT diagram for business and marketing related presentations.
-
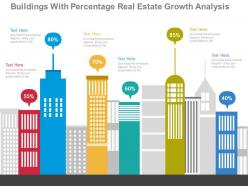 Apt buildings with percentage real estate growth analysis flat powerpoint design
High determination PPT visuals don't pixelate even after customization. All the PPT symbols, content, foundation and charts can be altered to coordinate your need. It can further be spared in any organization of your decision (JPG/JPEG/PDF). Compatible with various arrangement choices. Compatible with numerous product alternatives accessible both on the web and disconnected. Personalize it with organization name and logo of your own. It's a helpful PowerPoint slide plan for entrepreneurs, operations troughs, advertising official, educators and understudies.
-
 Pptx five staged horizontal bars for year based financial growth analysis flat powerpoint design
Presenting pptx five staged horizontal bars for year based financial growth analysis flat powerpoint design. This Power Point template diagram has been crafted with graphic of five staged horizontal bars diagram. This PPT diagram contains the concept of financial growth analysis representation. Use this PPT diagram for business and finance related presentations.
-
 View five staged tags for financial saving flat powerpoint design
Presenting view five staged tags for financial saving flat powerpoint design. This Power Point template diagram has been crafted with graphic of five staged tags diagram. This PPT diagram contains the concept of financial saving representation. Use this PPT diagram for business and finance related presentations.
-
 App triangles with percentage for timeline formation flat powerpoint design
Presenting app triangles with percentage for timeline formation flat powerpoint design. This Power Point template diagram slide has been crafted with graphic of triangle and percentage diagram. This PPT slide contains the concept of business timeline formation. Use this PPT slide for business and management related presentations.
-
 Download venn diagram with percentage for result analysis flat powerpoint design
Completely editable content including fonts, text, colors. Compatible with number of software options. Modify the PPT design with company image and logo. Excellence in picture quality even on wide screen output. Compatible with Google slides. Adaptable PPT designs as can be converted into JPG and PDF. Suitable for business, sales, marketing, finance, IT, accounts sectors.
-
 Pptx vertical chart with percentage values for terminal value calculation flat powerpoint design
Presenting pptx vertical chart with percentage values for terminal value calculation flat powerpoint design. This Power Point template diagram slide has been crafted with graphic of vertical chart and percentage value. This PPT slide contains the concept of terminal value calculation .Use this PPT slide for business and marketing related presentations.
-
 Pie chart with comparison between peoples powerpoint slides
Very useful for large companies and start-ups. Equally handy for school teachers for various subjects like geography, economics etc. Fully modifiable contents. PowerPoint templates available in widescreen format for different screen sizes. Easily convert PPT presentation to popular formats like JPG and PDF. Compatible with google slides for better usability. Uncomplicated process of changing icon features like Size, color and orientation.
-
 Pie chart with percentage analysis powerpoint slides
Presenting pie chart with percentage analysis powerpoint slides. This Power Point template slide has been crafted with graphic of pie chart and percentage icons. This PPT slide contains the concept of financial analysis. Use this PPT slide for business and finance related presentations.
-
 Pptx four percentage banners result analysis flat powerpoint design
Presenting pptx four percentage banners result analysis flat powerpoint design. This Power Point template diagram slide has been crafted with graphic of four percentage banners. This PPT slide contains the concept of business result analysis representation .Use this PPT slide for business and finance related presentations.
-
 View laptop mock up with percentage diagram flat powerpoint design
Presenting view laptop mock up with percentage diagram flat powerpoint design. This Power Point template diagram slide has been crafted with graphic of laptop percentage diagram. This PPT slide contains the concept of financial analysis and strategy representation .Use this PPT slide for business and marketing related presentations.
-
 New percentage bar graph for business analysis flat powerpoint design
Presenting new percentage bar graph for business analysis flat powerpoint design. This Power Point template diagram slide has been crafted with graphic of percentage bra graph. This PPT slide contains the concept of business analysis. This PPT slide for business and management related presentations.
-
 Pptx percentage based timeline for financial analysis flat powerpoint design
Presenting pptx percentage based timeline for financial analysis flat powerpoint design. This Power Point template diagram has been crafted with graphic of percentage based timeline. This PPT diagram contains the concept of financial analysis. Use this PPT diagram for business and finance related presentations.
-
 Use pie charts with percentage and icons flat powerpoint design
Modifiable PPT Slide with pie charts with percentage and icons. Compatible with numerous format options like JPEG, JPG or PDF. Provides a professional outlook to your PowerPoint presentation. Icons are also be added. Customization of each PowerPoint graphic and text according to your desire and want. Available in Widescreen slide size also. Freedom to customize it with company name and logo. Beneficial for business professionals, students, teachers, business analysts and strategists. Compatible with Google slides as well.
-
 Bar graph for financial growth analysis powerpoint slides
Presenting bar graph for financial growth analysis powerpoint slides. This Power Point template slide has been crafted with graphic of bar graph and finance icons. This PPT slide contains the concept of year based financial growth analysis. Use this PPT slide for business and finance related presentations.
-
 Bar graph with year based timeline percentage chart powerpoint slides
Presenting bar graph with year based timeline percentage chart powerpoint slides. This Power Point template diagram slide has been crafted with bar graph, percentage chart and timeline icons. This PPT diagram slide contains the concept of financial data analysis. Use this PPT slide for finance and business related presentations.
-
 Business agenda checklist table infographics powerpoint slides
This PPT Template can be used by any organization’s executives for representing business agenda related presentations. All these images are 100% edited in terms of color, size, and orientation of the elements mentioned in the slides. These PPT slides are compatible with Google slides and can be edited in any PowerPoint software.
-
 Computer and mobile with percentage value powerpoint slides
Presenting computer and mobile with percentage value powerpoint slides. This Power Point template diagram slide has been crafted with computer and mobile . This PPT diagram slide contains the concept of technology application. Use this PPT slide for finance and technology related presentations.
-
 Four staged circle with percentage icons powerpoint slides
Presenting four staged circle with percentage icons powerpoint slides. This Power Point template diagram slide has been crafted with graphic of four staged circle and percentage icons. This PPT diagram slide contains the concept of financial analysis representation. Use this PPT slide for finance and business related presentations.
-
 Four staged percentage chart for financial study powerpoint slides
Presenting four staged percentage chart for financial study powerpoint slides. This Power Point template diagram slide has been crafted with graphic of four staged circle and percentage chart. This PPT diagram slide contains the concept of financial study representation. Use this PPT slide for finance and business related presentations.
-
 Four staged table chart for decision representation powerpoint slides
Presenting four staged table chart for decision representation powerpoint slides. This Power Point template diagram slide has been crafted with graphic of four staged table chart. This PPT diagram slide contains the concept of decision ability representation. Use this PPT slide for finance and business related presentations.
-
 Linear chart for annual report infographics powerpoint slides
Presenting linear chart for annual report infographics powerpoint slides. This Power Point template diagram slide has been crafted with graphic of linear chart. This PPT diagram slide contains the concept of annual report representation. Use this PPT slide for finance and business related presentations.
-
 Three staged percentage our services diagram powerpoint slides
Presenting three staged percentage our services diagram powerpoint slides. This Power Point template diagram slide has been crafted with graphic of three staged percentage diagram. This PPT diagram slide contains the concept of our services representation. Use this PPT slide for finance and business related presentations.
-
 Three staged variation table checklist powerpoint slides
Presenting three staged variation table checklist powerpoint slides. This Power Point template diagram slide has been crafted with graphic of three staged table and checklist diagram. This PPT diagram slide contains the concept of our services representation. Use this PPT slide for finance and business related presentations.
-
 Three tags for ecommerce business and financial agendas powerpoint slides
Presenting three tags for ecommerce business and financial agendas powerpoint slides. This Power Point template diagram slide has been crafted with graphic of three tags diagram. This PPT diagram slide contains the concept of business and financial agenda representation. Use this PPT slide for finance and business related presentations.
-
 Three tags for financial strategy representation powerpoint slides
Presenting three tags for financial strategy representation powerpoint slides. This Power Point template diagram slide has been crafted with graphic of three tags diagram. This PPT diagram slide contains the concept of financial strategy representation. Use this PPT slide for finance and business related presentations.
-
 Bar graph with growth arrow for analysis powerpoint slides
Presenting bar graph with growth arrow for analysis powerpoint slides. This Power Point template slide has been crafted with graphic of bar graph and arrow. This PPT slide contains the concept of business growth analysis. Use this PPT slide for business and marketing related presentations.
-
 Business time management sheet daily activity plan schedule powerpoint slides
Presenting business time management sheet daily activity plan schedule powerpoint slides. This Power Point template slide has been crafted with graphic of activity plan and time icons. This PPT slide contains the concept of business time management and planning. Use this PPT slide for business and marketing related presentations.
-
 Circle bar graph with percentage analysis powerpoint slides
Presenting circle bar graph with percentage analysis powerpoint slides. This Power Point template slide has been crafted with graphic of circle bar graph and percentage icons. This PPT slide contains the concept of financial analysis. Use this PPT slide for business and marketing related presentations.
-
 Dashboard chart with year based analysis powerpoint slides
Presenting dashboard chart with year based analysis powerpoint slides. This Power Point template slide has been crafted with graphic of dashboard chart. This PPT slide contains the concept of year based analysis. Use this PPT slide for business and finance related presentations.
-
 Dollar bar graph for financial growth powerpoint slides
Presenting dollar bar graph for financial growth powerpoint slides. This Power Point template slide has been crafted with graphic of bar graph and dollar icons. This PPT slide contains the concept of financial growth analysis. Use this PPT slide for business and finance related presentations.
-
 Eight staged pie chart financial percentage analysis powerpoint slides
Good combination of icons and text using a circular diagram. Compatible with number of software options. Colors and text can be easily changed as the PPT slide is completely editable. Personalize the presentation with individual company name and logo. Available in both Standard and Widescreen slide size. Easy and quick downloading process. Flexible option for conversion in PDF or JPG formats. Completely adaptable with Google slides. Useful for finance professionals, accounts team, education firms etc.
-
 Financial chart with checklist and icons powerpoint slides
Well crafted and professionally equipped PowerPoint visual. Use of bright and bold colors for maximum visual appeal. Ease of editing every component of the PPT template. Guidance for executing the changes has been provided for assistance. Modify and personalize the presentation by including the company name and logo. Compatible with varied number of format options. Compatible with multiple software options available both online and offline. Widely used by entrepreneurs, business strategists, business analysts, stakeholders, students and teachers.
-
 Financial chart with data analysis powerpoint slides
Presenting financial chart with data analysis powerpoint slides. This Power Point template slide has been crafted with graphic of financial chart and data icons. This PPT slide contains the concept of data analysis. Use this PPT slide for business and finance related presentations.
-
 Financial data verification table and infographics powerpoint slides
Presenting financial data verification table and infographics powerpoint slides. This Power Point template slide has been crafted with graphic of data verification table and info graphics. This PPT slide contains the concept of financial data analysis. Use this PPT slide for business and finance related presentations.
-
 Five staged bar graph percentage chart powerpoint slides
Aesthetically designed and professionally equipped slides. High resolution. Impressive picture quality which do not pixelate when projected on wide screen. Compatible with multiple set of software available both online and offline. Compatible with team of format like JPEG, JPG and PDF. Modify the contents at your ease. 100 percent editable slide design. Execute the changes with the provided on slide assistance. Personalize the contents with your company name and logo.
-
 Four arrows with percentage analysis powerpoint slides
Presenting four arrows with percentage analysis powerpoint slides. This Power Point template slide has been crafted with graphic of four arrows and percentage icons. This PPT slide contains the concept of percentage analysis representation. Use this PPT slide for business and finance related presentations.
-
 Four circle with percentage analysis chart powerpoint slides
Presenting four circle with percentage analysis chart powerpoint slides. This Power Point template slide has been crafted with graphic of four circle and percentage icons. This PPT slide contains the concept of percentage analysis representation. Use this PPT slide for business and finance related presentations.
-
 Four colored tags and percentage analysis powerpoint slides
Presenting four colored tags and percentage analysis powerpoint slides. This Power Point template slide has been crafted with graphic of four colored tags and percentage icons. This PPT slide contains the concept of financial data analysis representation. Use this PPT slide for business and finance related presentations.
-
 Four staged financial chart and icons powerpoint slides
Presenting four staged financial chart and icons powerpoint slides. This Power Point template slide has been crafted with graphic of four staged financial chart and icons. This PPT slide contains the concept of financial data analysis. Use this PPT slide for business and finance related presentations.
-
 Four tags for business planning analysis powerpoint slides
Presenting four tags for business planning analysis powerpoint slides. This Power Point template slide has been crafted with graphic of four tags. This PPT slide contains the concept of business planning analysis. Use this PPT slide for business and finance related presentations.
-
 Four tags for financial data analysis powerpoint slides
Presenting four tags for financial data analysis powerpoint slides. This Power Point template slide has been crafted with graphic of four tags. This PPT slide contains the concept of financial data analysis. Use this PPT slide for business and finance related presentations.
-
 Percentage chart with data analysis powerpoint slides
Presenting percentage chart with data analysis powerpoint slides. This Power Point template slide has been crafted with graphic of percentage chart. This PPT slide contains the concept of data analysis. Use this PPT slide for business and finance related presentations.
-
 Saving piggy mobile dollars financial planning powerpoint slides
Presenting saving piggy mobile dollars financial planning powerpoint slides. This Power Point template slide has been crafted with graphic of piggy bank, dollars and mobile icons. This PPT slide contains the concept of financial planning. Use this PPT slide for business and finance related presentations.
-
 Sequential timeline made with pie chart and percentage powerpoint slides
Presenting sequential timeline made with pie chart and percentage powerpoint slides. This Power Point template slide has been crafted with graphic of sequential timeline and pie chart This PPT slide contains the concept of financial data analysis and planning. Use this PPT slide for business and finance related presentations.
-
 Three sequential money pots for financial growth analysis powerpoint slides
Presenting three sequential money pots for financial growth analysis powerpoint slides. This Power Point template slide has been crafted with graphic of three sequential money pots. This PPT slide contains the concept of financial growth analysis. Use this PPT slide for business and finance related presentations.
-
 Triangle with percentage organization chart powerpoint slides
Presenting triangle with percentage organization chart powerpoint slides. This Power Point template slide has been crafted with graphic of triangle and percentage..This PPT slide contains the concept of financial data analysis. Use this PPT slide for business and finance related presentations.
-
 Three tags with percentage chart and icons powerpoint slides
Presenting three tags with percentage chart and icons powerpoint slides. This Power Point template slide has been crafted with graphic of three tags and percentage chart diagram. This PPT slide contains the concept of financial data analysis and flow representation .Use this PPT slide for business and finance related presentations.
-
 Bar graph and line chart for financial planning powerpoint slides
Presenting bar graph and line chart for financial planning powerpoint slides. This Power Point template slide has been crafted with graphic of bar graph and line chart. This PPT slide contains the concept of financial planning. Use this PPT slide for business and finance related presentations.
-
 Bar graph for financial analysis powerpoint slides
Presenting bar graph for financial analysis powerpoint slides. This Power Point template slide has been crafted with graphic of bar graph. This PPT slide contains the concept of financial data analysis. Use this PPT slide for business and finance related presentations.
-
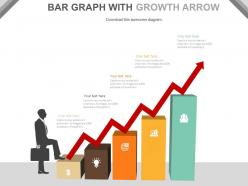 Bar graph with red growth arrow and icons for success powerpoint slides
Presenting bar graph with red growth arrow and icons for success powerpoint slides. This Power Point template slide has been crafted with graphic of bar graph and red growth arrow. This PPT slide contains the concept of financial growth analysis and success. Use this PPT slide for business and finance related presentations.
-
 Board for financial analysis with bar graph powerpoint slides
Presenting board for financial analysis with bar graph powerpoint slides. This Power Point template slide has been crafted with graphic of bar graph and board. This PPT slide contains the concept of financial analysis. Use this PPT slide for business and finance related presentations.
-
 Chart for financial infographics analysis powerpoint slides
Presenting chart for financial infographics analysis powerpoint slides. This Power Point template slide has been crafted with graphic of chart and icons. This PPT slide contains the concept of financial analysis. Use this PPT slide for business and finance related presentations.
-
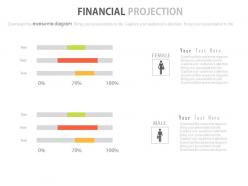 Financial projection line charts powerpoint slides
Presenting financial projection line charts powerpoint slides. This Power Point template slide has been crafted with graphic of projection line chart and icons. This PPT slide contains the concept of financial projection for future and analysis. Use this PPT slide for business and finance related presentations.
-
 Five staged financial percentage chart powerpoint slides
Presenting five staged financial percentage chart powerpoint slides. This Power Point template slide has been crafted with graphic of five staged percentage chart. This PPT slide contains the concept of financial analysis. Use this PPT slide for business and finance related presentations.
-
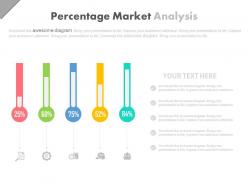 Five staged percentage market analysis powerpoint slides
Presenting five staged percentage market analysis powerpoint slides. This Power Point template slide has been crafted with graphic of five staged percentage chart. This PPT slide contains the concept of financial growth and market analysis. Use this PPT slide for business and finance related presentations.
-
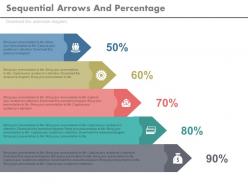 Five staged sequential arrows and percentage powerpoint slides
Presenting five staged sequential arrows and percentage powerpoint slides. This Power Point template slide has been crafted with graphic of five staged arrow and percentage chart. This PPT slide contains the concept of financial growth analysis. Use this PPT slide for business and finance related presentations.
-
Graphics are very appealing to eyes.
-
Unique research projects to present in meeting.
-
Great product with effective design. Helped a lot in our corporate presentations. Easy to edit and stunning visuals.
-
Best Representation of topics, really appreciable.
-
Unique research projects to present in meeting.
-
The content is very helpful from business point of view.
-
Thanks for all your great templates they have saved me lots of time and accelerate my presentations. Great product, keep them up!
-
Topic best represented with attractive design.
-
Illustrative design with editable content. Exceptional value for money. Highly pleased with the product.
-
Content of slide is easy to understand and edit.


