- Sub Categories
-
 Money management moderate aggressive fund market analytics table with icons
Presenting this set of slides with name - Money Management Moderate Aggressive Fund Market Analytics Table With Icons. This is a five stage process. The stages in this process are Marketing Analytics, Marketing Performance, Marketing Discovery.
-
 Social media revenue leads visits market analytics table with graph
Presenting this set of slides with name - Social Media Revenue Leads Visits Market Analytics Table With Graph. This is a three stage process. The stages in this process are Marketing Analytics, Marketing Performance, Marketing Discovery.
-
 Website leads visits target market analytics board with region
Presenting this set of slides with name - Website Leads Visits Target Market Analytics Board With Region. This is a three stage process. The stages in this process are Marketing Analytics, Marketing Performance, Marketing Discovery.
-
 Kpi icon for business financial analysis
Presenting this set of slides with name - Kpi Icon For Business Financial Analysis. This is a four stage process. The stages in this process are Metrics Icon, Kpi Icon, Statistics Icon.
-
 Kpi icon for business review
Presenting this set of slides with name - Kpi Icon For Business Review. This is a four stage process. The stages in this process are Metrics Icon, Kpi Icon, Statistics Icon.
-
 Kpi icon for market analysis
Presenting this set of slides with name - Kpi Icon For Market Analysis. This is a six stage process. The stages in this process are Metrics Icon, Kpi Icon, Statistics Icon.
-
 Kpi icon showing tablet with pie charts
Presenting this set of slides with name - Kpi Icon Showing Tablet With Pie Charts. This is a four stage process. The stages in this process are Metrics Icon, Kpi Icon, Statistics Icon.
-
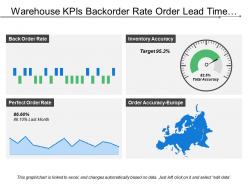
 Warehouse kpis backorder rate order lead time inventory accuracy
Presenting this set of slides with name - Warehouse Kpis Backorder Rate Order Lead Time Inventory Accuracy. This is a four stage process. The stages in this process are Warehouse Kpi, Warehouse Dashboard, Warehouse Metrics.
-
 Warehouse kpis carrying cost of inventory backorder rate inventory turnover
Presenting this set of slides with name - Warehouse Kpis Carrying Cost Of Inventory Backorder Rate Inventory Turnover. This is a four stage process. The stages in this process are Warehouse Kpi, Warehouse Dashboard, Warehouse Metrics.
-
 Warehouse kpis internal supplier customer operating costs shipments
Presenting this set of slides with name - Warehouse Kpis Internal Supplier Customer Operating Costs Shipments. This is a six stage process. The stages in this process are Warehouse Kpi, Warehouse Dashboard, Warehouse Metrics.
-
 Warehouse kpis operating costs order rate total shipments country
Presenting this set of slides with name - Warehouse Kpis Operating Costs Order Rate Total Shipments Country. This is a four stage process. The stages in this process are Warehouse Kpi, Warehouse Dashboard, Warehouse Metrics.
-
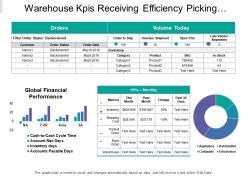
 Warehouse kpis receiving efficiency picking accuracy backorder rate inventory
Presenting this set of slides with name - Warehouse Kpis Receiving Efficiency Picking Accuracy Backorder Rate Inventory. This is a four stage process. The stages in this process are Warehouse Kpi, Warehouse Dashboard, Warehouse Metrics.
-
 Warehouse kpis transaction out of stock inventory return carry cost
Presenting this set of slides with name - Warehouse Kpis Transaction Out Of Stock Inventory Return Carry Cost. This is a four stage process. The stages in this process are Warehouse Kpi, Warehouse Dashboard, Warehouse Metrics.
-
 Lot market estimate for future prospect cover value for adoption connectivity and productivity
Presenting this set of slides with name - Lot Market Estimate For Future Prospect Cover Value For Adoption Connectivity And Productivity. This is a four stage process. The stages in this process are Internet Of Things, Iot, Technology.
-
 Top use of lot with estimated value in percent include smart implementation and ease of usability
Presenting this set of slides with name - Top Use Of Lot With Estimated Value In Percent Include Smart Implementation And Ease Of Usability. This is a five stage process. The stages in this process are Internet Of Things, Iot, Technology.
-
 Mentoring business infographics template
Presenting this set of slides with name - Mentoring Business Infographics Template. This is a four stage process. The stages in this process are Mentoring, Advise, Trainee.
-
 Mentoring drives business success infographic
Presenting this set of slides with name - Mentoring Drives Business Success Infographic. This is a three stage process. The stages in this process are Mentoring, Advise, Trainee.
-
 Cross selling dollar with arrow upward
Presenting this set of slides with name - Cross Selling Dollar With Arrow Upward. This is a two stage process. The stages in this process are Cross Selling, Selling Techniques, Sales.
-
 Data percentage comparison in grid chart format
Presenting this set of slides with name - Data Percentage Comparison In Grid Chart Format. This is a three stage process. The stages in this process are Percentage Comparison, Percentage Compare, Percentage Balancing.
-
 Employee attribute percentage comparison with five categories
Presenting this set of slides with name - Employee Attribute Percentage Comparison With Five Categories. This is a five stage process. The stages in this process are Percentage Comparison, Percentage Compare, Percentage Balancing.
-
 Percentage comparison in data bar format with icons
Presenting this set of slides with name - Percentage Comparison In Data Bar Format With Icons. This is a five stage process. The stages in this process are Percentage Comparison, Percentage Compare, Percentage Balancing.
-
 Percentage comparison showing data comparison through bar graph and line graph
Presenting this set of slides with name - Percentage Comparison Showing Data Comparison Through Bar Graph And Line Graph. This is a four stage process. The stages in this process are Percentage Comparison, Percentage Compare, Percentage Balancing.
-
 Percentage comparison showing demographic evaluation of year on year
Presenting this set of slides with name - Percentage Comparison Showing Demographic Evaluation Of Year On Year. This is a two stage process. The stages in this process are Percentage Comparison, Percentage Compare, Percentage Balancing.
-
 Customer satisfaction experience market drivers analysis meter with icons
Presenting this set of slides with name - Customer Satisfaction Experience Market Drivers Analysis Meter With Icons. This is a three stage process. The stages in this process are Growth Drivers, Growth Opportunity, Market Drivers.
-
 Technical industry mobile data market drivers with percentages
Presenting this set of slides with name - Technical Industry Mobile Data Market Drivers With Percentages. This is a nine stage process. The stages in this process are Growth Drivers, Growth Opportunity, Market Drivers.
-
 Market landscape product company sites blogs seminar social sites
Presenting this set of slides with name - Market Landscape Product Company Sites Blogs Seminar Social Sites. This is a twelve stage process. The stages in this process are Current Landscape, Competitor Landscape, Market Landscape.
-
 Asset capital loans management bank revenue drivers with icons
Presenting this set of slides with name - Asset Capital Loans Management Bank Revenue Drivers With Icons. This is a eight stage process. The stages in this process are Revenue Drivers, Income Drivers, Earning Drivers.
-
 Customer retention acquisition innovation retail revenue drivers with icons
Presenting this set of slides with name - Customer Retention Acquisition Innovation Retail Revenue Drivers With Icons. This is a twelve stage process. The stages in this process are Revenue Drivers, Income Drivers, Earning Drivers.
-
 Tech cash diversified trading revenue drivers allocation chart with icons
Presenting this set of slides with name - Tech Cash Diversified Trading Revenue Drivers Allocation Chart With Icons. This is a seven stage process. The stages in this process are Revenue Drivers, Income Drivers, Earning Drivers.
-
 Financial planning tools business unit strategy customer insights
Presenting this set of slides with name - Financial Planning Tools Business Unit Strategy Customer Insights. This is an editable two stages graphic that deals with topics like Financial Planning Tools, Business Unit Strategy, Customer Insights to help convey your message better graphically. This product is a premium product available for immediate download, and is 100 percent editable in Powerpoint. Download this now and use it in your presentations to impress your audience.
-
 Investment portfolio pie charts showing conservative and balanced growth
Presenting this set of slides with name - Investment Portfolio Pie Charts Showing Conservative And Balanced Growth. This is a four stage process. The stages in this process are Investment Portfolio, Funding Portfolio, Expenditure Portfolio.
-
 Investment portfolio pie charts showing shares property bond cash risk investor
Presenting this set of slides with name - Investment Portfolio Pie Charts Showing Shares Property Bond Cash Risk Investor. This is a three stage process. The stages in this process are Investment Portfolio, Funding Portfolio, Expenditure Portfolio.
-
 Investment portfolio pie charts showing stocks bonds cash with conservative portfolio
Presenting this set of slides with name - Investment Portfolio Pie Charts Showing Stocks Bonds Cash With Conservative Portfolio. This is a three stage process. The stages in this process are Investment Portfolio, Funding Portfolio, Expenditure Portfolio.
-
 Investment portfolio showing asset allocation by investor profile
Presenting this set of slides with name - Investment Portfolio Showing Asset Allocation By Investor Profile. This is a five stage process. The stages in this process are Investment Portfolio, Funding Portfolio, Expenditure Portfolio.
-
 Investment portfolio showing conservative moderate aggressive growth
Presenting this set of slides with name - Investment Portfolio Showing Conservative Moderate Aggressive Growth. This is a five stage process. The stages in this process are Investment Portfolio, Funding Portfolio, Expenditure Portfolio.
-
 Investment portfolio showing low medium high risk with bonds and growth stocks
Presenting this set of slides with name - Investment Portfolio Showing Low Medium High Risk With Bonds And Growth Stocks. This is a three stage process. The stages in this process are Investment Portfolio, Funding Portfolio, Expenditure Portfolio.
-
 Hr dashboard employee age breakdown graph donut chart
Presenting this set of slides with name - Hr Dashboard Employee Age Breakdown Graph Donut Chart. This is a four stage process. The stages in this process are Hr Dashboard, Human Resource Dashboard, Hr Kpi.
-
 Hr dashboard employee type employee tenure
Presenting this set of slides with name - Hr Dashboard Employee Type Employee Tenure. This is a six stage process. The stages in this process are Hr Dashboard, Human Resource Dashboard, Hr Kpi.
-
 Hr dashboard headcount by departments male and female
Presenting this set of slides with name - Hr Dashboard Headcount By Departments Male And Female. This is a three stage process. The stages in this process are Hr Dashboard, Human Resource Dashboard, Hr Kpi.
-
 Hr Dashboard Number Of Employees Employee Structure
Presenting this set of slides with name - Hr Dashboard Number Of Employees Employee Structure. This is a four stage process. The stages in this process are Hr Dashboard, Human Resource Dashboard, Hr Kpi.
-
 Hr dashboard snapshot recruitment performance key metrics
Presenting this set of slides with name - Hr Dashboard Snapshot Recruitment Performance Key Metrics. This is a four stage process. The stages in this process are Hr Dashboard, Human Resource Dashboard, Hr Kpi.
-
 Hr dashboard split by gender and deptt
Presenting this set of slides with name - Hr Dashboard Split By Gender And Deptt. This is a six stage process. The stages in this process are Hr Dashboard, Human Resource Dashboard, Hr Kpi.
-
 Hr dashboard total salary average salary
Presenting this set of slides with name - Hr Dashboard Total Salary Average Salary. This is a three stage process. The stages in this process are Hr Dashboard, Human Resource Dashboard, Hr Kpi.
-
 Focus group analysis shown by human target image
Presenting this set of slides with name - Focus Group Analysis Shown By Human Target Image. This is a four stage process. The stages in this process are Focus Group, Focus Team, Focus Member.
-
 Annual sales by region determining value of budget vs actual with respective gains and differences
Presenting this set of slides with name - Annual Sales By Region Determining Value Of Budget Vs Actual With Respective Gains And Differences. This is a four stage process. The stages in this process are Forecast Vs Actual Budget, Actual Vs Budget, Marketing Budget.
-
 Determining budget vs actual cost of project include year over year analysis
Presenting this set of slides with name - Determining Budget Vs Actual Cost Of Project Include Year Over Year Analysis. This is a four stage process. The stages in this process are Forecast Vs Actual Budget, Actual Vs Budget, Marketing Budget.
-
 Strategic direction video production web design app development
Presenting this set of slides with name - Strategic Direction Video Production Web Design App Development. This is an editable six stages graphic that deals with topics like Strategic Direction, Video Production, Web Design, App Development to help convey your message better graphically. This product is a premium product available for immediate download, and is 100 percent editable in Powerpoint. Download this now and use it in your presentations to impress your audience.
-
 Data presentation example powerpoint presentations
Presenting this set of slides with name - Data Presentation Example Powerpoint Presentations. This is a four stage process. The stages in this process are Data Presentation, Content Presentation, Information Presentation.
-
 Data presentation graphs
Presenting this set of slides with name - Data Presentation Graphs. This is a four stage process. The stages in this process are Data Presentation, Content Presentation, Information Presentation.
-
 Data presentation icons powerpoint templates
Presenting this set of slides with name - Data Presentation Icons Powerpoint Templates. This is a two stage process. The stages in this process are Data Presentation, Content Presentation, Information Presentation.
-
 Data presentation outlet powerpoint presentation examples
Presenting this set of slides with name - Data Presentation Outlet Powerpoint Presentation Examples. This is a six stage process. The stages in this process are Data Presentation, Content Presentation, Information Presentation.
-
 Data presentation statistics example of ppt presentation
Presenting this set of slides with name - Data Presentation Statistics Example Of Ppt Presentation. This is a two stage process. The stages in this process are Data Presentation, Content Presentation, Information Presentation.
-
 Cadastral mapping recruitment promotion narrow work tasks standardized transactions
Presenting this set of slides with name - Cadastral Mapping Recruitment Promotion Narrow Work Tasks Standardized Transactions. This is an editable two stages graphic that deals with topics like Cadastral Mapping, Recruitment Promotion, Narrow Work Tasks, Standardized Transactions to help convey your message better graphically. This product is a premium product available for immediate download, and is 100 percent editable in Powerpoint. Download this now and use it in your presentations to impress your audience.
-
 Marketing kpi dashboard showing bounce rate average session duration
Presenting this set of slides with name - Marketing Kpi Dashboard Showing Bounce Rate Average Session Duration. This is a three stage process. The stages in this process are Marketing, Branding, Promoting.
-
 Marketing kpi dashboard showing consumption sharing sales lead generation
As this slideshow is 100% customizable you can easily add or remove anything from the pre-designed slides. You can change the font size, font color and the font style of the text used following instructions given in the sample templates. The orientation, size and the color of various graphical illustrations used in the PPT template are also adjustable. If you download this PPT slideshow you can view it in either standard size screen ratio of 4:3 or wide screen display ratio of 16:9. The PowerPoint presentation can be saved in PDF or JPG format. The slides are fully compatible with Google slides.
-
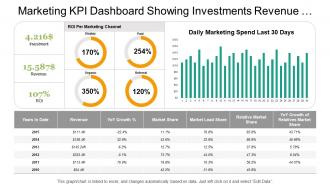
 Marketing kpi dashboard showing investments revenue metrics details
Presenting marketing kpi dashboard showing investments revenue metrics details presentation template slide. The PPT template is very user friendly as it allows you to make numerous changes to the editable slides. You can amend the font size, font style and also the font color as per your requirements. Template slide can be downloaded quickly and cab be saved in format of PDF or JPG easily. The template slide after being downloaded can be viewed in large screen display ratio of 16:9 or standard size display ratio of 4:3.
-
 Marketing kpi dashboard showing lead breakdown web traffic targets
Presenting this set of slides with name - Marketing Kpi Dashboard Showing Lead Breakdown Web Traffic Targets. This is a three stage process. The stages in this process are Marketing, Branding, Promoting.
-
 Marketing kpi dashboard snapshot showing lead funnel traffic sources key metrics
Presenting this set of slides with name - Marketing Kpi Dashboard Snapshot Showing Lead Funnel Traffic Sources Key Metrics. This is a three stage process. The stages in this process are Marketing, Branding, Promoting.
-
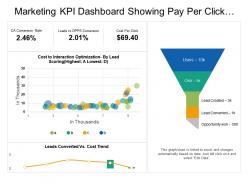
 Marketing kpi dashboard showing pay per click campaign optimization
Presenting this set of slides with name - Marketing Kpi Dashboard Showing Pay Per Click Campaign Optimization. This is a three stage process. The stages in this process are Marketing, Branding, Promoting.
-
 Marketing kpi dashboard showing revenue per acquisition leads speed profit
Presenting this set of slides with name - Marketing Kpi Dashboard Showing Revenue Per Acquisition Leads Speed Profit. This is a three stage process. The stages in this process are Marketing, Branding, Promoting.
-
Wonderful templates design to use in business meetings.
-
Excellent Designs.
-
Perfect template with attractive color combination.
-
Great product with effective design. Helped a lot in our corporate presentations. Easy to edit and stunning visuals.
-
Best Representation of topics, really appreciable.
-
Appreciate the research and its presentable format.
-
Very unique and reliable designs.
-
Awesomely designed templates, Easy to understand.
-
Out of the box and creative design.
-
Easy to edit slides with easy to understand instructions.


