- Sub Categories
-
 1114 slide showing variances and percentages powerpoint presentation
Impressive use of colors to create an eye catchy visual. High resolution pictures. No flaw in picture output when projected on wide screen. Compatibility with numerous format options. Harmonious with large set of software. Thoroughly editable slide design layout. Ease of incorporating changes. Personalize the content with company specific name, logo and trademark. Used by financiers, sales professionals, students and teachers.
-
 1114 fish bone diagram for result bar graph powerpoint template
The stunning bar graph Ppt template carries the superior resolution quality. The Ppt is loaded with the amazing features of digital volume equalizer and control knob. Shape the Ppt as per your desire by changing its colours, object orientation, and dimensions. Tune in the slides easily with the Google slides and enjoy the downloading in desired file format.
-
 1114 six pie charts for result representation and percentage powerpoint template
We are proud to present our 1114 six pie charts for result representation and percentage powerpoint template. This Power Point template slide has been designed with graphic of seven staged vertical timeline diagram. This PPT slide contains the concept of business timeline formation. Use this PPT slide and make exclusive presentations.
-
 1114 three sequential infographic for data flow powerpoint template
We are proud to present our 1114 three sequential infographic for data flow powerpoint template. Three sequential info graphics are used to decorate this power point template. This PPT contains the concept of data flow. Us ethis PPT for your business and finance related presentations.
-
 1214 four staged bar graph with percentage value powerpoint template
Simple to incorporate company name, logo, trademark and animation. Free of space constraints to mention titles and subtitles. Customize PPT layout, font, text, color and design as per your style. Can be easily converted to PDF or JPG formats. High-resolution PowerPoint slides graphics. We have crafted this PPT keeping in mind the professional requirement from the professional designers.
-
 1214 set of circular pie graphs with percentage values powerpoint template
We are proud to present our 1214 set of circular pie graphs with percentage values powerpoint template. Set of circular pie graph with percentage value has been used to design this power point template. This PPT contains the concept of financial data analysis. Use this PPT for your business and finance related presentations.
-
 1214 five linear pie charts for result analysis powerpoint template
We are proud to present our 1214 five linear pie charts for result analysis powerpoint template. This Power Point template has been designed with graphic of five linear pie charts. These charts are used to show the result analysis. Use this PPT for your business and marketing related presentations.
-
 1214 10 percent to 90 percent powerpoint presentation
We are proud to present our 1214 10 percent to 90 percent powerpoint presentation. This Power Point template has been designed with graphic of multiple pie graph. This PPT contains the concept of result analysis with percentage values. Use this PPT for your business and sales related presentations.
-
 1114 business bar graph for data analysis powerpoint template
We are proud to present our 1114 business bar graph for data analysis powerpoint template. This Power Point template slide has been designed with graphic of bar graph. This bar graph is can be used for data analysis. Use this PPT slide for data and business related presentations
-
 1114 colored pie chart for data analysis powerpoint template
We are proud to present our 1114 colored pie chart for data analysis powerpoint template. Graphic of colored pie chart has been used to design this Power Point template slide. This PPt slide contains the concept of data analysis. Use this PPT slide for your business and finance data related analysis.
-
 1114 five staged linear process flow for business data powerpoint template
We are proud to present our 1114 five staged linear process flow for business data powerpoint template. This Power Point template slide has been crafted with graphic of five staged process flow diagram. This PPT slide contains the concept of business data representation. Use this PPT slide and build professional presentation for your viewers.
-
 1114 four colored arrow text boxes for data representation presentation template
Proofing and editing can be done with ease in PPT design. Smooth functioning is ensured by the presentation slide show on all software’s. Color, style and position can be standardized, supports font size which can be read from a distance. When projected on the wide screen the PPT layout does not sacrifice on pixels or color resolution.
-
 1114 four sequential pie charts for data representation presentation template
Easy proofing and editing is added on feature of presentation visual. Presentation slide is useful in business marketing, management and recourse disbursement. Basic theme yet it can modified with respect to font, color and layout. Attractive color scheme gives a professional look to PPT layout. Conversion into PDF or JPG formats is very easy and handy. PPT graphic offers font size which can be read from a distance.
-
 1114 four staged bar graph for data representation presentation template
We are proud to present our 1114 four staged bar graph for data representation presentation template. Four staged bar graph has been used to craft this power point template. This Power Point template has been designed to show the concept of data representation. Use this PPT for your business and finance related presentations.
-
 1214 three circular financial pie chart powerpoint template
We are proud to present our 1214 three circular financial pie chart powerpoint template. This power point template has been designed with graphic of three circular pie chart. This pie chart is suitable for financial data representation. Use this PPt for your business and finance related presentations.
-
 1214 four water drops with percentage values powerpoint presentation
Fabulous introduction of plans and hues. Fantastic quality pictures which don't pixelate when anticipated on wide screen. Similarity with different organization alternatives like JPEG and JPG. Agreeable with various on the web and disconnected programming choices. Fully editable slide graphics. Compatible with various programming design like JPEG, JPG and PDF. Directive slides are given to help you in modifying the layout look and feel.
-
 1214 four staged circle chart for data representation powerpoint template
We are proud to present our 1214 four staged circle chart for data representation powerpoint template. Four staged circle chart has been used to craft this power point template. This PPT contains the concept of data representation. Display data and related topics in your presentation with this unique PPT.
-
 0115 bar graphs on world map for global business powerpoint template
Presenting0115 bar graphs on world map for global business PowerPoint template. Simple data input like company logo, name or trademark. This PowerPoint theme is fully supported by Google slides. Picture quality of these slides does not change even when project on large screen. Fast downloading speed and formats can be easily changed to JPEG and PDF applications. This template is suitable for marketing, sales persons, business managers and entrepreneurs. Adjust PPT layout, font, text and color as per your necessity
-
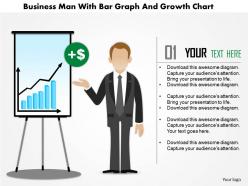 0115 business man with bar graph and growth chart powerpoint template
Efficiently created Presentation design. Insert your valuable trade details such as image, icon or sign. Translatable into various format options i.e. JPEG or PDF. User friendly structure of the PPT designs. Choice to edit the content, style, size and orientation of the PowerPoint layout. Use of high resolution images and the graphics in the designing. Comfort to share the presentation template in standard and widescreen view.
-
 Water drops for financial data analysis flat powerpoint design
Access to transform the Presentation design into JPG and PDF. Easily amendable as editing is permissible with colour, text and font. Adaptable PPT slides as fully compatible with Google slides. Picture quality remain same even when share in widescreen view. PowerPoint template can be personalized by adding business details. Impactful Presentation design and can be shared with large audience.
-
 Business result analysis indication flat powerpoint design
Miraculous presented PowerPoint graphics which are very useful for the business analysts , business students and professionals etc., Easily access able into divergent file compositions like PDF or JPG , Insert able trade name or mark or company logo or emblem, Wholly customize able matters, PowerPoint image, structure, intensity etc., Adaptable with all the operating software’s and Google drives.
-
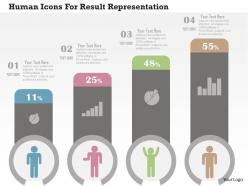 Human icons for result representation flat powerpoint design
We are proud to present our human icons for result representation flat powerpoint design. This power point template diagram has been crafted with graphic of human icon. This PPT diagram contains the concept of result representation. Use this PPT diagram can be used for business and management related presentations.
-
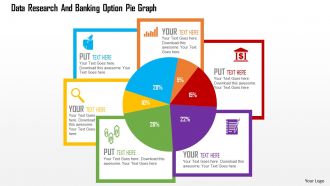 Data Research And Banking Option Pie Graph Flat Powerpoint Design
Exclusive patterns and graphics which are inspired by the current trends to impress the audience. Versatile and multipurpose PPT presentation diagram. Creates transparency of business processes. Enables better understanding and memorising the information displayed. Runs smoothly with all software’s. Compatible with Google framework. 100% amendable icons and images.
-
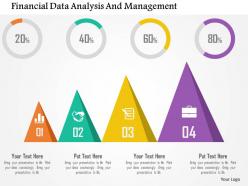 Financial data analysis and management flat powerpoint design
We are proud to present our financial data analysis and management flat powerpoint design. This power point template has been crafted with graphic of triangular bar graph. This PPT diagram contains the concept of financial data analysis and management. Use this PPT diagram for finance related topics.
-
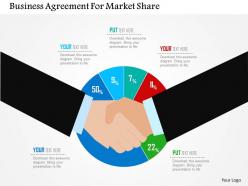 Business agreement for market share flat powerpoint design
We are proud to present our business agreement for market share flat powerpoint design. Concept of business agreement for market research and share has been displayed in this PPT diagram. This PPT diagram contains the graphic of handshake and pie graph. Use this PPT diagram for business and marketing related presentations.
-
 Five staged business data and finance flat powerpoint design
Beneficial in business, accounts, marketing and sales. Presentation graphic is a perfect combination of text and flash animation. Easy proofing and editing in presentation slide. Font style and size can be easily altered and entered. PPT slide is compatible with Google slide. PowerPoint presentation works well in Windows 7,8, 10, XP, Vista and Citrix.
-
 Five staged chart diagram for process control flat powerpoint design
We are proud to present our five staged chart diagram for process control flat powerpoint design. Five staged chart has been used to craft this power point template diagram. This PPT diagram contains the concept of process control. Use this diagram PPT for business and finance related presentations.
-
 Four bulbs for idea generation technique flat powerpoint design
We are proud to present our four bulbs for idea generation technique flat powerpoint design. Graphic of four bulbs has been used to design this power point template diagram. This PPT diagram contains the concept of idea generation. Use this PPT diagram for business and management related presentations.
-
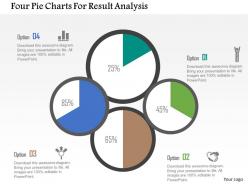 Four Pie Charts For Result Analysis Flat Powerpoint Design
High quality visuals with splendid resolution. 100 percent editable PPT slide templates. Aesthetically designed and professionally proficient. Include or exclude the slide content at your ease and requirement. Compatible with several software options. Harmonious with numerous format options life JPEG, JPG or PDF. Ease of personalization with your company specific name, logo and or trademark.
-
 Global women leadership for business and success powerpoint template
We are proud to present our global women leadership for business and success powerpoint template. Concept of global women leadership with success can be explained in any presentation with this professional PPT diagram. This PPT diagram contains the graphic of world map and women icons. Use this PPT diagram for women empowerment and social communication related presentations.
-
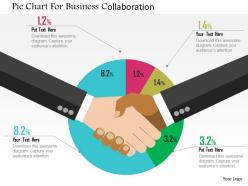 Pie chart for business collaboration flat powerpoint design
We are proud to present our pie chart for business collaboration flat powerpoint design. Graphic of pie chart has been used to craft this power point template diagram. This PPT diagram contains the concept of business collaboration. Use this PPT diagram for business presentations.
-
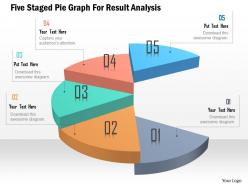 Five staged pie graph for resul analysis powerpoint template
We are proud to present our five staged pie graph for resul analysis powerpoint template. Five staged pie graph has been used to craft this power point template diagram. This PPT diagram contains the concept of result analysis. Use this PPT diagram for business and marketing related presentations.
-
 Magnet attracting dollars financial input powerpoint template
We are proud to present our magnet attracting dollars financial input powerpoint template. Concept of financial inventory update has been displayed in this PPT diagram. This PPT diagram contains graphic of magnet and dollars. Use this PPT diagram for finance and management related presentations.
-
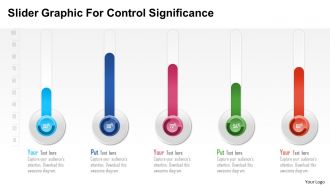 Slider graphic for control significance powerpoint template
We are proud to present our slider graphic for control significance powerpoint template. Graphic of slider has been used to craft this power point template. This PPT diagram contains the concept of control. Use this PPT diagram for business and marketing related presentations.
-
 Cloud with circular percentage chart flat powerpoint design
We are proud to present our cloud with circular percentage chart flat powerpoint design. Concept of cloud computing for financial use has been defined in this power point template diagram. This PPT diagram contains the graphic of cloud with circular puzzle. Use this PPT diagram for business and technology related presentations.
-
 Coloumn chart for financial data analysis flat powerpoint design
We are proud to present our coloumn chart for financial data analysis flat powerpoint design. Graphic of coloumn chart has been used to design this power point template diagram. This PPT diagram contains the concept of financial data analysis. Use this PPT diagram for finance and business related presentations and get good remarks.
-
 Different valued tags in various shapes flat powerpoint design
We are proud to present our different valued tags in various shapes flat powerpoint design. Different valued tags in different shapes has been used to craft this power point template diagram. This PPT diagram contains the concept of data analysis. This PPT diagram is suitbale for data related presentations.
-
 Dollar bag with text boxes for financial growth flat powerpoint design
We are proud to present our dollar bag with text boxes for financial growth flat powerpoint design. Graphic of dollar bag and text boxes has been used to design this power point template diagram. This PPT diagram contains the concept of financial growth. Use this PPT diagramfor finance and data related presentations.
-
 Percentage sankey diagram for business flat powerpoint design
We are proud to present our percentage sankey diagram for business flat powerpoint design. Graphic of percentage Sankey diagram has been used to craft this power point template diagram. This PPT diagram contains the concept of visualization from one set of values to other. Use this PPT diagram and build an exclusive presentation for your business related topics.
-
 Green puzzle with financial symbols and bar graph flat powerpoint design
Great quality images used in the PPT illustration. High resolution slide model as can be projected on wide screen. Cordial in usage with the available format options. Compatible with maximum number of software i.e. JPG and PDF. Easy inclusion and exclusion of content as per individual need. Completely editable presentation vector, text, icons and graphics. Hassle free inclusion of company’s personalized content. Suitable for corporate leaders, Finance and accounts managers and executives.
-
 Five sliders for percentage representation flat powerpoint design
Business oriented PowerPoint presentation slides. Easy and convenient downloading by following simple steps. No concession with the quality once opened on wide screen. Editable visuals, colors and text. Modify and personalize the presentation by including the company name and logo. Guidance for executing the changes has been provided for assistance. Useful for sales leaders, marketers, business professionals, analysts, strategists, students, teachers, etc.
-
 Five staged tags for percentage analysis flat powerpoint design
We are proud to present our five staged tags for percentage analysis flat powerpoint design. This power point template diagram has been crafted with graphic of five staged tags. This PPT diagram contains the concept of percentage analysis. Use this PPT diagram for business and marketing related presentations.
-
 Percentage bar graph for business flat powerpoint design
We are proud to present our percentage bar graph for business flat powerpoint design. This power point template diagram has been crafted with graphic of percentage and bar graph. This PPT diagram contains the concept of financial analysis. Use this PPT diagram for business and finance related presentations.
-
 Bar graph for year based chart and financial details flat powerpoint design
Visually drawing PowerPoint presentation diagrams. Loaded with incomparable benefits. Can be utilized for displaying both simple and complex information. Instant download to save your time and effort. Runs effortlessly with all the software’s. Can be personalized by adding company trademark, logo, brand and symbols. Well-arranged patterns to avoid any confusion or doubt.
-
 Bar graph made with pencils business apps flat powerpoint design
This PowerPoint presentation can be used to represent a company's business and data related presentations in a simple and approachable way. The elements used in this PPT slide are 100% editable by means of color, shape, and orientation. These PPT slides are compatible with Google slides and can be edited in any PowerPoint software.
-
 Four sliders for percentage representation flat powerpoint design
We are proud to present our four sliders for percentage representation flat powerpoint design. This power point template diagram has been crafted with graphic of four sliders and percentage. This PPT diagram contains the concept of financial analysis. Use this PPT diagram for business and finance related presentations.
-
 Colored bars with business icons flat powerpoint design
High resolution of the images and the business icons. Add or remove the image and the graphics. Insert your brand name or logo while removing the trademark from the slides. 100% accessibility to edit and make the desired changes. Fit well with the Google slides or Microsoft office. Quality maintained even when used on a wide display. Advantageous for the global marketers, entrepreneurs and the marketing individuals.
-
 Stack of gold coins for dollar financial stability flat powerpoint design
We are proud to present our stack of gold coins for dollar financial stability flat powerpoint design. Graphic of gold coins in stack has been used to craft this power point template diagram. This PPT diagram contains the concept of global financial stability. Use this PPT diagram for global business and finance related presentations.
-
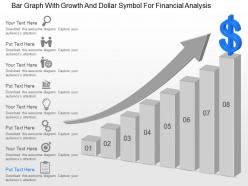 Bar graph with growth and dollar symbol for financial analysis ppt template slide
Visually appealing PPT presentation slides. Possess the ability to easily grab the attention of the audience without putting much efforts. Creates a strong connection between the audience and the presentation. User-friendly PowerPoint backgrounds. Enables easy understanding and memorising of the contents displayed on these templates. Can be viewed on wide screens without the images and icons being pixelating.
-
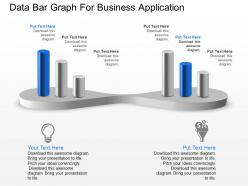 Data bar graph for business application powerpoint template slide
Presenting, data bar graph for business application PowerPoint template slide. Modifiable PPT Slide, edit the bar colors shown and personalize the text with your data. Convertible into various format options like JPEG, JPG or PDF. Display option available such as standard and widescreen view, available in 4:3 standard and full screen version 16:9. Liberty to customize it with company name and logo. Helpful for business professionals, students, teachers, business analysts and strategists. Compatible with google slides as well.
-
 Four staged bar graph for business application powerpoint template slide
We are proud to present our four staged bar graph for business application powerpoint template slide. This power point template diagram has been crafted with graphic of four staged bar graph. This PPT diagram contains the concept of business application. Use this PPT diagram for business and finance related presentations.
-
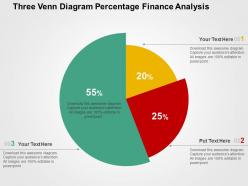 Three venn diagram percentage finance analysis flat powerpoint design
Presentation slide graphic of for financial analysis. Can be used by marketers, students, professors, sales people, business analysts, etc. Compatible with number of software options. Colors and text can be easily changed as the PPT slide is completely editable. Personalize the presentation with individual company name and logo. Available in both Standard and Widescreen slide size. Easy and quick downloading process.
-
 Yen growth bar graph made with money bags flat powerpoint design
We are proud to present our yen growth bar graph made with money bags flat powerpoint design. This power point template diagram has been crafted with graphic of yen and money bag. This PPT diagram contains the concept of money growth. Use this PPT diagram for finance and marketing related presentations.
-
 Money bags with growth arrow indication flat powerpoint design
Beautifully crafted and professionally equipped PowerPoint template. Choice to edit the PPT slide as changes can be done with color, text and shape. Direction to modify the presentation design as per the business requirement. Customization is possible as can add commerce image, symbol etc. PPT diagram compatible with Google slides. Alternate to share in standard as well as in widescreen view. Availability to download with different nodes and stages.
-
 Pound growth indication bar graph flat powerpoint design
We are proud to present our pound growth indication bar graph flat powerpoint design. Concept of growth indication has been displayed in this power point template diagram. This PPT diagram contains the graphic of bar graph and pound. Use this PPT diagram for business and finance related presentations.
-
 Rupee growth indication chart for business flat powerpoint design
Easy to input company logo, brand name or name. Presentation templates quality remain similar even when you resize the image. This PPT template fully compatible with Google slides. Formats can easily be changed into other software’s applications like PDF and JPEG. Amend PowerPoint design slides font, text, color and design as per your necessities. Ideal for entrepreneurs and large business organization.
-
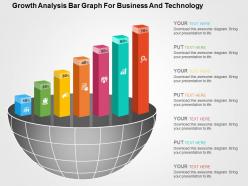 Growth analysis bar graph for business and technology flat powerpoint design
High resolution Presentation slide comes with great picture quality. Download is fast which saves time as well as effort. Customize it by inserting corporation name and logo. Display in both Standard and Widescreen format. Totally responsive and works well with Google slides. Download PPT design to insert text and share. PowerPoint template comes with creative and professional approach. Presentation graphic comes with great pixel quality which ensures better experience for the audience.
-
 Growth arrow for financial analysis flat powerpoint design
We are proud to present our growth arrow for financial analysis flat powerpoint design. Concept of growth and financial analysis has been displayed in this power point template diagram. This PPT diagram contains the graphic of growth arrow. Use this PPT diagram for business and finance related presentations.
-
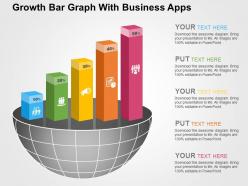 Growth bar graph with business apps flat powerpoint design
We are proud to present our growth bar graph with business apps flat powerpoint design. Graphic of bar graph and business apps has been used to craft this power point template diagram. This PPT diagram contains the concept of growth analysis. Use this PPT diagram for business and marketing related presentations.
-
 Hour glass with dollar coins and notes financial saving flat powerpoint design
We are proud to present our hour glass with dollar coins and notes financial saving flat powerpoint design. Concept of time management and saving strategy has been displayed in this power point template diagram. This PPT diagram contains the graphic of hour glass and dollar coins with notes. Use this PPT diagram for business and finance related presentations.
-
Appreciate the research and its presentable format.
-
Much better than the original! Thanks for the quick turnaround.
-
Presentation Design is very nice, good work with the content as well.
-
Amazing product with appealing content and design.
-
Innovative and attractive designs.
-
Awesome use of colors and designs in product templates.
-
Professional and unique presentations.
-
Excellent Designs.
-
Enough space for editing and adding your own content.
-
Great designs, Easily Editable.


