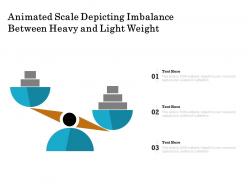
Animated scale depicting imbalance between heavy and light weight
Encourage folks to indulge in exploration with our Animated Scale Depicting Imbalance Between Heavy And Light Weight. Advocate an intrepid approach.
You must be logged in to download this presentation.
 Impress your
 audience
Editable
of Time
PowerPoint presentation slides
Presenting this set of slides with name Animated Scale Depicting Imbalance Between Heavy And Light Weight. This is a three stage process. The stages in this process are Animated Scale Depicting Imbalance Between Heavy And Light Weight. This is a completely editable PowerPoint presentation and is available for immediate download. Download now and impress your audience.
People who downloaded this PowerPoint presentation also viewed the following :
Content of this Powerpoint Presentation
Description:
The image is a PowerPoint slide titled "Animated Scale Depicting Imbalance Between Heavy and Light Weight". The slide features a graphic of a two-sided scale that is tilted to one side, suggesting that one side is heavier than the other. This tilt is visually represented by one side of the scale being lower with more blocks, indicating more weight, compared to the other side which has fewer blocks and is positioned higher.
There are three text boxes positioned to the right of the scale, each labeled with a number (01, 02, and 03) and placeholder text "Text Here". Below each text box, there's a note saying "This slide is 100% editable. Adapt it to your need and capture your audience's attention." This indicates that the slide template is customizable for specific presentations, allowing presenters to add their descriptions or explanations corresponding to the graphic.
The design of the slide is simple and clean, with a limited color palette that draws the viewer's attention to the scale. It is likely used to illustrate imbalance or discrepancy in various contexts such as workload, budget allocation, or any scenario where an unequal distribution needs to be highlighted. The editable text boxes provide a space for the presenter to add commentary or data to explain the imbalance depicted by the scale.
Use Cases:
This slide is adept for illustrating disparities in data across numerous sectors, aiding in visualizing and communicating imbalances that require attention or action.
1. Finance:
Use: Illustrating budgetary imbalances between different departments.
Presenter: Budget Analyst
Audience: Department Heads, Financial Planners
2. Healthcare:
Use: Showing disparities in resource allocation among departments.
Presenter: Healthcare Administrator
Audience: Hospital Staff, Department Managers
3. Education:
Use: Depicting uneven distribution of educational resources.
Presenter: Education Policy Maker
Audience: School Board, Teachers' Union Representatives
4. Technology:
Use: Demonstrating imbalance in investment across various projects.
Presenter: Head of Product Development
Audience: Investors, Project Managers
5. Human Resources:
Use: Comparing workload or staffing levels across teams.
Presenter: HR Manager
Audience: Team Leaders, Operational Managers
6. Marketing:
Use: Analyzing the allocation of budget in different campaigns.
Presenter: Marketing Director
Audience: Marketing Team, Advertising Managers
7. Environmental Services:
Use: Visualizing unequal environmental impacts in different regions.
Presenter: Environmental Analyst
Audience: Policy Makers, Community Leaders
Animated scale depicting imbalance between heavy and light weight with all 2 slides:
Appreciate intrepid approaches with our Animated Scale Depicting Imbalance Between Heavy And Light Weight. Applaud efforts at being inventive.
No Reviews


