- Sub Categories
-
 Dollar increase and decrease sign icon with background
Presenting dollar increase and decrease sign icon with background. This is a dollar increase and decrease sign icon with background. This is a two stage process. The stages in this process are increase decrease, up down, upward downward.
-
 Increase decrease arrow inward and outward icons
Presenting increase decrease arrow inward and outward icons. This is a increase decrease arrow inward and outward icons. This is a two stage process. The stages in this process are increase decrease, up down, upward downward.
-
 Increase decrease percentage up and down icons
Presenting increase decrease percentage up and down icons. This is a increase decrease percentage up and down icons. This is a two stage process. The stages in this process are increase decrease, up down, upward downward.
-
 Increase decrease percentage up and down shadow icons
Presenting increase decrease percentage up and down shadow icons. This is a increase decrease percentage up and down shadow icons. This is a two stage process. The stages in this process are increase decrease, up down, upward downward.
-
 Increase decrease rolling arrow upward and downward
Presenting increase decrease rolling arrow upward and downward. This is a increase decrease rolling arrow upward and downward. This is a two stage process. The stages in this process are increase decrease, up down, upward downward.
-
 Increase decrease zoom in and out icons
Presenting Increase Decrease Zoom In And Out Icons. The slide is completely editable. It can be saved in various document formats such as JPEG, PNG or PDF(Portable Document Format). The slide is compatible with Google Slides which makes it accessible at once. Moreover, both standard screen (4:3) and widescreen (16:9) aspect ratios are supported. High-quality graphics ensure that distortion does not occur.
-
 Increasing and decreasing arrows diagram
Presenting increasing and decreasing arrows diagram. This is a increasing and decreasing arrows diagram. This is a two stage process. The stages in this process are increase decrease, up down, upward downward.
-
 Profit increase decrease productivity level
Presenting this Profit Increase Decrease Productivity Level PPT PowerPoint presentation. Add charts and graphs for a stunning display of information. The slide supports the standard (4:3) and widescreen (16:9) sizes. It is compatible with Google Slides. Transform this into common images or document formats like JPEG, PNG or PDF. High-quality graphics ensure that picture quality is not affected.
-
 Two cubes with arrow pointing increase and decrease
Presenting two cubes with arrow pointing increase and decrease. This is a two cubes with arrow pointing increase and decrease. This is a two stage process. The stages in this process are increase decrease, up down, upward downward.
-
 Zoom in and out icons with background
Presenting Zoom In And Out Icons With Background slide. The slide is completely editable. It can be saved in various document formats such as JPEG, PNG or PDF(Portable Document Format). The slide is compatible with Google Slides which makes it accessible at once. Moreover, both standard screen(4:3) and widescreen(16:9) aspect ratios are supported. High-quality graphics ensure that distortion does not occur.
-
 Gender differentiation percentage
Presenting Gender Differentiation Percentage. This PowerPoint template supports both the widescreen (16:9) and the standard screen aspect ratios(4:3). Add appealing content like charts and graphs to the presentation. The slide is also compatible with Google Slides. This slide can be converted into common image formats like JPEG, PNG or document formats such as PDF. High-quality graphics will prevent the deterioration of slide components.
-
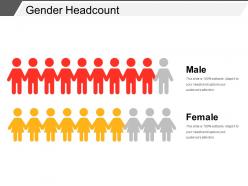
 Gender headcount
Presenting gender headcount. This is a gender headcount. This is a two stage process. The stages in this process are headcount, male female comparison, male female ratio.
-
 Headcount analysis layout
Presenting headcount analysis layout. This is a headcount analysis layout. This is a two stage process. The stages in this process are headcount, male female comparison, male female ratio.
-
 Headcount analysis percentage
Presenting Headcount Analysis Percentage slideshow. This PowerPoint template supports both the widescreen (16:9) and the standard screen aspect ratios(4:3). The slide is compatible with Google Slides. Add appealing content like charts and graphs to the presentation. This slide can be converted into common image formats like JPEG, PNG or document formats such as PDF. High-quality graphics will prevent the deterioration of slide components.
-
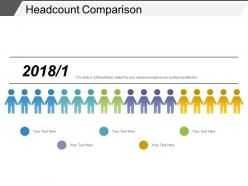
 Headcount comparison
Presenting headcount comparison. This is a headcount comparison. This is a five stage process. The stages in this process are headcount, male female comparison, male female ratio.
-
 Headcount comparison layout
Presenting headcount comparison layout. This is a headcount comparison layout. This is a two stage process. The stages in this process are headcount, male female comparison, male female ratio.
-
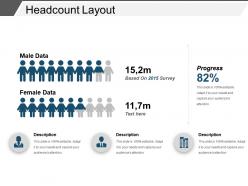
 Headcount layout
Presenting headcount layout. This is a headcount layout. This is a two stage process. The stages in this process are headcount, male female comparison, male female ratio.
-
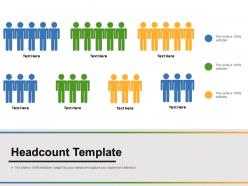
 Headcount template
Presenting headcount template. This is a headcount template. This is a three stage process. The stages in this process are headcount, male female comparison, male female ratio.
-
 Headcount with three titles
Presenting headcount with three titles. This is a headcount with three titles. This is a three stage process. The stages in this process are headcount, male female comparison, male female ratio.
-
 Male female percentage comparison chart
Presenting Male Female Percentage Comparison Chart presentation. The slide is fully customizable in PowerPoint and other office suites. Customize the slide as per your requirements. Transform this template into various documents or image formats like PDF or JPEG. Alter the font style, font color, and other components with ease. The slide is also compatible with Google Slides. High-quality graphics ensure that quality is always maintained.
-
 Three points headcount
Presenting three points headcount. This is a three points headcount. This is a two stage process. The stages in this process are headcount, male female comparison, male female ratio.
-
 Yearly gender comparison
Presenting Yearly Gender Comparison presentation. Customize the slide as per your requirements. Transform this template into various document or image formats like PDF or JPEG. The slide is fully customizable in PowerPoint and other office suites. Alter the font style, font color, and other components with ease. The slide is also compatible with Google Slides. High-quality graphics ensure that quality is always maintained.
-
 Customer acquisition cost powerpoint templates
Presenting customer acquisition cost powerpoint templates. This is a customer acquisition cost powerpoint templates. This is a two stage process. The stages in this process are flow, total paid web visitors, customers, conversion, input variables.
-
 Ideal acquisition cost model powerpoint shapes
Presenting ideal acquisition cost model powerpoint shapes. This is a ideal acquisition cost model powerpoint shapes. This is a two stage process. The stages in this process are balancing act, cost to acquire a customer, monetization, viral effects.
-
 Recruitment tracker ppt slide examples
Presenting recruitment tracker ppt slide examples. This is a recruitment tracker ppt slide examples. This is a five stage process. The stages in this process are applications received, minimally qualified, assessments conducted, eligible candidates, interview invite.
-
 Brand budgeting good ppt example
Presenting brand budgeting good ppt example. This is a brand budgeting good ppt example. This is a three stage process. The stages in this process are task, brand mark, advertising, seo, social media, core brand presentations .
-
 Comparison based on criteria powerpoint templates microsoft
Presenting comparison based on criteria powerpoint templates microsoft. This is a comparison based on criteria powerpoint templates microsoft. This is a six stage process. The stages in this process are revenue, profit, market share, main activity.
-
 Establish brand positioning ppt background
Presenting establish brand positioning ppt background. This is a establish brand positioning ppt background. This is a three stage process. The stages in this process are key benefits, price, value proposition, company and product.
-
 Market competitiveness ppt background template
Presenting market competitiveness ppt background template. This is a market competitiveness ppt background template. This is a three stage process. The stages in this process are own, key success factors, ratings, competitor, weight.
-
 Comparison powerpoint topics template 1
Presenting comparison powerpoint topics template 1. This is a comparison powerpoint topics template 1. This is a two stage process. The stages in this process are male, female, compare, in percentage, business.
-
 Brand budgeting powerpoint slide influencers
Presenting brand budgeting powerpoint slide influencers. This is a brand budgeting powerpoint slide influencers. This is a two stage process. The stages in this process are name development, brand mark, core brand presentation, advertising, social media.
-
 Comparison based on criteria ppt images gallery
Presenting comparison based on criteria ppt images gallery. This is a comparison based on criteria ppt images gallery. This is a six stage process. The stages in this process are revenue, profit, market share, main activity, product quality.
-
 Comparison ppt presentation examples
Presenting comparison ppt presentation examples. This is a comparison ppt presentation examples. This is a two stage process. The stages in this process are comparison, percentage, business, marketing.
-
 Competitive analysis ppt sample download
Presenting competitive analysis ppt sample download. This is a competitive analysis ppt sample download. This is a four stage process. The stages in this process are own company, competitors, emphasizing weaknesses, emphasizing the strengths, strengths.
-
 Market competitiveness presentation powerpoint example
Presenting market competitiveness presentation powerpoint example. This is a market competitiveness presentation powerpoint example. This is a three stage process. The stages in this process are financial position, advertising, market share, brand image, customer loyalty.
-
 Business transition methods and validation
Presenting business transition methods and validation. This is a business transition methods and validation. This is a four stage process. The stages in this process are business transition, transition process.
-
 Business transition plan 90 days sprints
Presenting business transition plan 90 days sprints. This is a business transition plan 90 days sprints. This is a three stage process. The stages in this process are business transition, transition process.
-
 Business transition roles and responsibilities
Presenting Business Transition Roles And Responsibilities slide. This slide is 100% editable in PowerPoint. You can alter the font type, size, diagram color, background color, etc. This template can be saved in multiple image formats such as JPEG, PNG, and PDF. It is compatible with Google Slides which makes it accessible at once and can be saved in multiple image formats such as JPEG, PNG and document formats such as PDF. The quality does not deteriorate when projected on the full screen.
-
 Business transition task duration and predecessors
Presenting business transition task duration and predecessors. This is a business transition task duration and predecessors. This is a four stage process. The stages in this process are business transition, transition process.
-
 Business transition yearly transition
Presenting this Business Transition Yearly Transition PowerPoint presentation. The slide is 100% customizable in MS PowerPoint and compatible with Google Slides. Edit the font style, font color, and other attributes with ease. Convert this template into popular images or document formats like JPEG or PDF. High-quality graphics ensure that quality is not affected. Both standard and widescreen aspect ratios are supported for clarity and comprehension.
-
 Table with five columns and icons
Presenting table with five columns and icons. This is a table with five columns and icons. This is a four stage process. The stages in this process are business transition, transition process.
-
 Table with right going arrows
Presenting Table With Right Going Arrows PowerPoint slide. This PPT presentation is Google Slides compatible hence it is easily accessible. You can download and save this PowerPoint layout in different formats like PDF, PNG, and JPG. This PPT theme is available in both 4:3 and 16:9 aspect ratios. This PowerPoint template is editable so you can modify the font color, font size, font type, and shapes
-
 Crm stage pipeline stage status complete
Presenting crm stage pipeline stage status complete. This is a crm stage pipeline stage status complete. This is a two stage process. The stages in this process are crm stage, customer relationship management phases, crm steps.
-
 Hr consultancy showing strategy and talent management
Presenting hr consultancy showing strategy and talent management. This is a hr consultancy showing strategy and talent management. This is a two stage process. The stages in this process are hr consultancy, recruitment firm, human resource management.
-
 Five columns table with icons
Presenting five columns table with icons. This is a five columns table with icons. This is a five stage process. The stages in this process are migration plan, migration approach, transferring data.
-
 Four columns table with icons
Presenting four columns table with icons. This is a four columns table with icons. This is a four stage process. The stages in this process are migration plan, migration approach, transferring data.
-
 Migration plan activities task and deliverables
Presenting migration plan activities task and deliverables. This is a migration plan activities task and deliverables. This is a six stage process. The stages in this process are migration plan, migration approach, transferring data.
-
 Migration plan assess operate and improve
Presenting migration plan assess operate and improve. This is a migration plan assess operate and improve. This is a five stage process. The stages in this process are migration plan, migration approach, transferring data.
-
 Migration plan critical and non critical slide layout
Presenting migration plan critical and non critical slide layout. This is a migration plan critical and non critical slide layout. This is a three stage process. The stages in this process are migration plan, migration approach, transferring data.
-
 Migration plan planning and monitoring
Presenting Migration Plan Planning And Monitoring template. You can add this PPT into common images or document formats like JPEG and PDF. The PPT also supports the standard (4:3) and widescreen (16:9) sizes. It is also compatible with Google Slides and MS PowerPoint. Modify the style, size, background, etc. High-quality graphics provide immediate room for distortion.
-
 Six columns table with icons
Presenting Six Columns Table With Icons. The template supports the standard (4:3) and widescreen (16:9) viewing angles. Include charts and graphs for a clear display of data. It is also compatible with Google Slides. Transform this into multiple images or document formats like JPEG, PNG or PDF. High-quality graphics ensure that the picture quality always remains the same.
-
 Three columns table with icons
Presenting three columns table with icons. This is a three columns table with icons. This is a three stage process. The stages in this process are migration plan, migration approach, transferring data.
-
 Competitive spend analysis tools with circles
Presenting competitive spend analysis tools with circles. This is a competitive spend analysis tools with circles. This is a seven stage process. The stages in this process are spend analysis, spend management, procurement analysis, purchase analysis.
-
 Business critical position succession chart with years
Presenting business critical position succession chart with years. This is a business critical position succession chart with years. This is a three stage process. The stages in this process are succession chart, succession graph, progression chart.
-
 Succession chart with position ceo name finance operations and technology
Presenting succession chart with position ceo name finance operations and technology. This is a succession chart with position ceo name finance operations and technology. This is a three stage process. The stages in this process are succession chart, succession graph, progression chart.
-
 Employee development opportunity motivation identification
Presenting Employee Development Opportunity Motivation Identification template. You can make as many changes as you want on the slide This slide can be downloaded in any format like JPG, PNG, and PDF without any trouble. You can modify font color, font size, font type in the slide as per your requirements. This slide is available in both widescreen and standard screen ratios. Its compatibility with Google Slide makes it accessible at once.
-
 Product growth products description growth rate
Presenting product growth products description growth rate. This is a product growth products description growth rate. This is a two stage process. The stages in this process are product growth, product development, product improvement.
-
 Product growth strategy safe risky matrix
Presenting this Product Growth Strategy Safe Risky Matrix PowerPoint presentation. Add charts and graphs for a clear display of facts. The slide also supports the standard and widescreen viewing angles. It is also compatible with Google Slides. Convert this into popular images or document formats such as JPEG, PNG or PDF. High-quality graphics will ensure that quality always remains the same.
-
 Purchase order details table showing item description and quantity
Presenting Purchase Order Details Table Showing Item Description And Quantity slideshow. You can change the color, font size, font type, and shapes of this PPT layout according to your needs. This PPT template is compatible with Google Slides and is available in both 4:3 and 16:9 aspect ratios. This ready to use PowerPoint presentation can be downloaded in various formats like PDF, JPG, and PNG.
-
 Purchase order table with description and amount
Presenting Purchase Order Table With Description And Amount slideshow. You can change the color, font size, font type, and shapes of this PPT layout according to your needs. This PPT template is compatible with Google Slides and is available in both 4:3 and 16:9 aspect ratios. This ready to use PowerPoint presentation can be downloaded in various formats like PDF, JPG, and PNG.
-
Thanks for all your great templates they have saved me lots of time and accelerate my presentations. Great product, keep them up!
-
Professional and unique presentations.
-
Topic best represented with attractive design.
-
Use of different colors is good. It's simple and attractive.
-
Excellent products for quick understanding.
-
Qualitative and comprehensive slides.
-
Design layout is very impressive.
-
Really like the color and design of the presentation.
-
Illustrative design with editable content. Exceptional value for money. Highly pleased with the product.
-
Thanks for all your great templates they have saved me lots of time and accelerate my presentations. Great product, keep them up!


