- Sub Categories
-
 6 optimize icon with circular meter and red indicator
Presenting 6 optimize icon with circular meter and red indicator. This is a 6 optimize icon with circular meter and red indicator. This is a six stage process. The stages in this process are optimize icon, analyze icon, engineering icon.
-
 6 optimize icon with settings icon and meter
Presenting 6 optimize icon with settings icon and meter. This is a 6 optimize icon with settings icon and meter. This is a six stage process. The stages in this process are optimize icon, analyze icon, engineering icon.
-
 6 optimize icon with stopwatch and indicator
Presenting 6 optimize icon with stopwatch and indicator. This is a 6 optimize icon with stopwatch and indicator. This is a six stage process. The stages in this process are optimize icon, analyze icon, engineering icon.
-
 7 optimize icon with circular meter and red indicator
Presenting 7 optimize icon with circular meter and red indicator. This is a 7 optimize icon with circular meter and red indicator. This is a seven stage process. The stages in this process are optimize icon, analyze icon, engineering icon.
-
 7 optimize icon with settings icon and meter
Presenting 7 optimize icon with settings icon and meter. This is a 7 optimize icon with settings icon and meter. This is a seven stage process. The stages in this process are optimize icon, analyze icon, engineering icon.
-
 7 optimize icon with stopwatch and indicator
Presenting 7 optimize icon with stopwatch and indicator. This is a 7 optimize icon with stopwatch and indicator. This is a seven stage process. The stages in this process are optimize icon, analyze icon, engineering icon.
-
 Dashboard snapshot ppt slide design
Presenting dashboard snapshot ppt slide design. This is a dashboard ppt slide design. This is a three stage process. The stages in this process are low, medium, high, dashboard, measurement.
-
 Dashboard snapshot presentation outline
Presenting dashboard presentation outline. This is a dashboard snapshot presentation outline . This is a one stage process. The stages in this process are high speed, low, medium, dashboard, strategy.
-
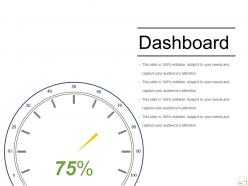 Dashboard snapshot sample of ppt presentation
Presenting dashboard sample of ppt presentation. This is a dashboard snapshot sample of ppt presentation. This is a one stage process. The stages in this process are dashboard, percentage, business, management, process.
-
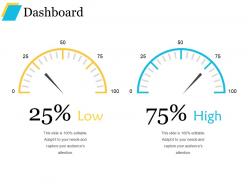 Dashboard powerpoint presentation templates
Presenting dashboard powerpoint presentation templates. This is a dashboard powerpoint presentation templates. This is a two stage process. The stages in this process are low, high, dashboard, technology, business.
-
 Dashboard powerpoint slide templates download
Presenting dashboard powerpoint slide templates download. This is a dashboard powerpoint slide templates download. This is a one stage process. The stages in this process are low, medium, high, dashboard.
-
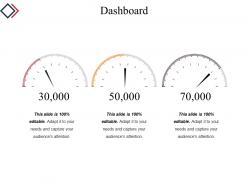 Dashboard snapshot powerpoint presentation examples
Presenting dashboard snapshot powerpoint presentation examples. This is a dashboard powerpoint presentation examples. This is a three stage process. The stages in this process are dashboard, business, marketing, strategy, planning.
-
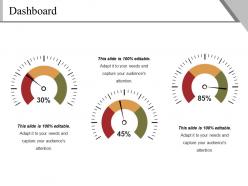 Dashboard powerpoint slide presentation examples
Presenting dashboard powerpoint slide presentation examples. This is a dashboard powerpoint slide presentation examples. This is a three stage process. The stages in this process are dashboard, finance, business, marketing, strategy.
-
 Dashboard powerpoint templates download
Presenting dashboard powerpoint templates download. This is a dashboard powerpoint templates download. This is a one stage process. The stages in this process are medium, low, high, dashboard.
-
 Quality management dashboard powerpoint graphics
Presenting quality management dashboard powerpoint graphics. This is a quality management dashboard powerpoint graphics. This is a six stage process. The stages in this process are purpose and overview, scope, roles and responsibilities, metrics and tools, review and audit plan, corrective plan.
-
 High risk icon with meter and indicator
Presenting high risk icon with meter and indicator. This is a high risk icon with meter and indicator. This is a one stage process. The stages in this process are high risk, risk management, high danger.
-
 Dashboard Snapshot ppt infographic template
Presenting dashboard ppt infographic template. This is a dashboard snapshot ppt infographic template. This is a three stage process. The stages in this process are dashboard, low, high, medium.
-
 Dashboard powerpoint slide graphics
Presenting dashboard powerpoint slide graphics. This is a dashboard powerpoint slide graphics. This is a three stage process. The stages in this process are dashboard, low, medium, high.
-
 Dashboard powerpoint images template 2
Presenting dashboard powerpoint images template 2. This is a dashboard powerpoint images template 2. This is a three stage process. The stages in this process are low, medium, high, dashboard, measurement.
-
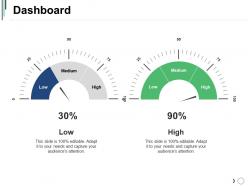 Dashboard powerpoint slide background designs
Presenting this set of slides with name - Dashboard Powerpoint Slide Background Designs. This is a two stage process. The stages in this process are Dashboard, Marketing, Strategy, Planning, Finance.
-
 Dashboard powerpoint slide background image
Presenting dashboard powerpoint slide background image. This is a dashboard powerpoint slide background image. This is a three stage process. The stages in this process are dashboard, percentage, business, marketing, strategy.
-
 Barometer circular indication left right icon
Presenting barometer circular indication left right icon. This is a barometer circular indication left right icon. This is a six stage process. The stages in this process are barometer, weather instrument, ?pressure gauge.
-
 Barometer compass round shaped icon
Presenting barometer compass round shaped icon. This is a barometer compass round shaped icon. This is a three stage process. The stages in this process are barometer, weather instrument, ?pressure gauge.
-
 Barometer pressure tendency dots icon
Presenting barometer pressure tendency dots icon. This is a barometer pressure tendency dots icon. This is a three stage process. The stages in this process are barometer, weather instrument, ?pressure gauge.
-
 Barometer round shape centre arrow icon
Presenting barometer round shape centre arrow icon. This is a barometer round shape centre arrow icon. This is a three stage process. The stages in this process are barometer, weather instrument, ?pressure gauge.
-
 Barometer three colour indicator icon
Presenting barometer three colour indicator icon. This is a barometer three colour indicator icon. This is a three stage process. The stages in this process are barometer, weather instrument, ?pressure gauge.
-
 Barometer time showing instrument simple icon
Presenting barometer time showing instrument simple icon. This is a barometer time showing instrument simple icon. This is a four stage process. The stages in this process are barometer, weather instrument, ?pressure gauge.
-
 Business quality scope and management dashboard
Presenting business quality scope and management dashboard. This is a business quality scope and management dashboard. This is a six stage process. The stages in this process are business quality, quality management, quality assurance.
-
 Launch monitoring dashboard snapshot ppt design
Presenting launch monitoring dashboard Snapshot ppt design. This is a launch monitoring dashboard ppt design. This is a three stage process. The stages in this process are return on investment, target units sold, customer satisfaction, low, medium, high.
-
 Product quality check ppt slide
Presenting the Product Quality Check PPT Slide template. The slide is fully editable in PowerPoint and other office suites. Alter the font style, font color, and other attributes within seconds. The PPT is compatible with Google Slides. Convert this template into numerous images or document formats like JPEG or PDF. High-quality graphics ensure that distortion does not occur. Moreover, both standard(4:3) and widescreen(16:9) viewing angles are supported for clarity.
-
 Measuring meter durability icon with indicator
Presenting measuring meter durability icon with indicator. This is a measuring meter durability icon with indicator. This is a one stage process. The stages in this process are durability, durable, design lifetime, goods quality.
-
 Measuring meter with green indicator
Presenting Measuring Meter With Green Indicator slide. This presentation slide has been professionally designed and is fully editable in PowerPoint. The slide is fully compatible with Google Slides and you can save them in multiple images or document formats such as JPEG, PNG, PDF, etc. High-quality graphics and icons can be included. No deterioration in quality as it supports both standard and widescreen modes.
-
 Brand performance dashboard powerpoint slides design
Presenting brand performance dashboard powerpoint slides design. This is a brand performance dashboard powerpoint slides design. This is a three stage process. The stages in this process are customer recognition, enhanced sales, competitive edge, dashboard, measurement.
-
 Brand performance dashboard snapshot ppt background template
Presenting brand performance dashboard snapshot ppt background template. This is a brand performance dashboard ppt background template. This is a three stage process. The stages in this process are customer recognition, enhanced sales, competitive edge, dashboard, business.
-
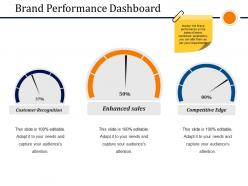 Brand performance dashboard snapshot ppt sample presentations
Presenting brand performance dashboard ppt sample presentations. This is a brand performance dashboard Snapshot ppt sample presentations. This is a three stage process. The stages in this process are customer recognition, enhanced sales, competitive edge
-
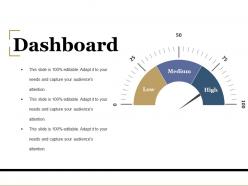 Dashboard powerpoint slide rules
Presenting dashboard powerpoint slide rules. This is a dashboard powerpoint slide rules. This is a three stage process. The stages in this process are business, marketing, strategy, planning, dashboard.
-
 Easy icon gauge against light green background
Presenting easy icon gauge against light green background. This is a easy icon gauge against light green background. This is a three stage process. The stages in this process are easy icon, simple icon.
-
 Easy icon gauge against white background
Presenting easy icon gauge against white background. This is a easy icon gauge against white background. This is a three stage process. The stages in this process are easy icon, simple icon.
-
 Brand performance dashboard powerpoint slide ideas
Presenting brand performance dashboard powerpoint slide ideas. This is a brand performance dashboard powerpoint slide ideas. This is a three stage process. The stages in this process are low, medium, high, dashboard, measurement.
-
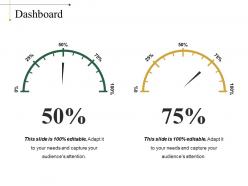 Dashboard powerpoint slide presentation tips
Presenting dashboard powerpoint slide presentation tips. This is a dashboard powerpoint slide presentation tips. This is a two stage process. The stages in this process are dashboard, percentage, business, marketing, process.
-
 Dashboard powerpoint slide presentation sample
Presenting dashboard powerpoint slide presentation sample. This is a dashboard powerpoint slide presentation sample. This is a three stage process. The stages in this process are dashboard, business, marketing, process.
-
 Dashboard snapshot powerpoint shapes
Presenting dashboard snapshot powerpoint shapes. This is a dashboard powerpoint shapes. This is a three stage process. The stages in this process are low, medium, high, dashboard, measurement.
-
 Efficiency icon semi gear pointing arrow
Presenting efficiency icon semi gear pointing arrow. This is a efficiency icon semi gear pointing arrow. This is a three stage process. The stages in this process are efficiency icon, ability icon, effectiveness icon.
-
 Brand performance dashboard snapshot ppt images gallery
Presenting brand performance dashboard snapshot ppt images gallery. This is a brand performance dashboard snapshot ppt images gallery. This is a three stage process. The stages in this process are customer recognition, enhanced sales, competitive edge, dashboard, business.
-
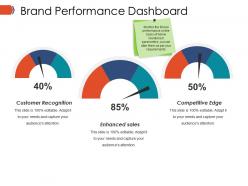 Brand performance dashboard snapshot ppt example
Presenting brand performance dashboard snapshot ppt example. This is a brand performance dashboard ppt example. This is a three stage process. The stages in this process are customer recognition, enhanced sales, competitive edge.
-
 Change management performance dashboard powerpoint slide designs
Presenting change management performance dashboard powerpoint slide designs. This is a change management performance dashboard powerpoint slide designs. This is a three stage process. The stages in this process are critical, high, low, medium, none.
-
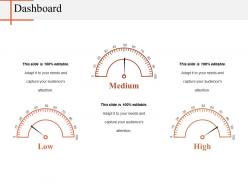 Dashboard powerpoint slide deck samples
Presenting this set of slides with name - Dashboard Powerpoint Slide Deck Samples. This is a three stage process. The stages in this process are Dashboard, Strategy, Finance, Planning, Measure.
-
 Dashboard snapshot powerpoint topics
Presenting dashboard powerpoint topics. This is a dashboard snapshot powerpoint topics. This is a two stage process. The stages in this process are low, high.
-
 Dashboard powerpoint slide background picture
Presenting dashboard powerpoint slide background picture. This is a dashboard powerpoint slide background picture. This is a two stage process. The stages in this process are dashboard, low, high, business, marketing.
-
 Dashboard powerpoint slide design templates 1
Presenting dashboard powerpoint slide design templates 1. This is a dashboard powerpoint slide design templates 1. This is a three stage process. The stages in this process are dashboard, percentage, business, marketing, strategy.
-
 Project phases data driven speedometer dashboard snapshot
Presenting project phases data driven speedometer dashboard. This is a project phases data driven speedometer dashboard snapshot. This is a four stage process. The stages in this process are project phases templates, project steps, project methods.
-
 Customer satisfaction powerpoint images
Presenting customer satisfaction powerpoint images. This is a customer satisfaction powerpoint images. This is a three stage process. The stages in this process are key performance indicators, percentage, year, measurement, dashboard.
-
 Customer satisfaction powerpoint slide background designs
Presenting customer satisfaction powerpoint slide background designs. This is a customer satisfaction powerpoint slide background designs. This is a three stage process. The stages in this process are overall satisfaction with service, satisfaction with value for money, overall satisfaction with relationship, business, percentage.
-
 Dashboard powerpoint slide presentation guidelines
Presenting dashboard powerpoint slide presentation guidelines. This is a dashboard powerpoint slide presentation guidelines. This is a three stage process. The stages in this process are dashboard, low, medium, high.
-
 Dashboard powerpoint slide template 1
Presenting dashboard powerpoint slide template 1. This is a dashboard powerpoint slide template 1. This is a three stage process. The stages in this process are low, medium, high, dashboard, measurement.
-
 Dashboard powerpoint slide background picture template 1
Presenting dashboard powerpoint slide background picture template 1. This is a dashboard powerpoint slide background picture template 1. This is a three stage process. The stages in this process are dashboard, percentage, business, marketing, low.
-
 Dashboard powerpoint ideas template 1
Presenting dashboard powerpoint ideas template 1. This is a dashboard powerpoint ideas template 1. This is a two stage process. The stages in this process are low, medium, high, dashboard, measurement.
-
 Customer satisfaction analysis icons
Presenting customer satisfaction analysis icons. This is a customer satisfaction analysis icons. This is a two stage process. The stages in this process are customer satisfaction analysis, customer retention, customer feedback.
-
 Customer centric culture showing customer centric mindset behavior and processes
Presenting Customer Centric Culture Showing Customer Centric Mindset Behavior And Processes. Build a visually-sound presentation with the help of this PowerPoint template. 100% customizability allows you to personalize text, fonts, colors, patterns, shapes, orientation, and background as desired. Convert the PPT file into formats like PDF, PNG, and JPG as per your convenience. This professionally-created PowerPoint slide works well with Google Slides. You can also access it on widescreen and standard screen resolutions.
-
 Dashboard powerpoint slide
Presenting this set of slides with name - Dashboard Powerpoint Slide. This is a three stage process. The stages in this process are Medium, Medium, High, Dashboard, Business, Percentage.
-
Excellent Designs.
-
Very unique and reliable designs.
-
Use of icon with content is very relateable, informative and appealing.
-
Informative presentations that are easily editable.
-
Awesomely designed templates, Easy to understand.
-
Topic best represented with attractive design.
-
Good research work and creative work done on every template.
-
Innovative and attractive designs.
-
Very well designed and informative templates.
-
Awesome presentation, really professional and easy to edit.


