- Sub Categories
-
 Mining oil and gas extraction kpi dashboard showing ending stock and oil production volumes
Presenting this set of slides with name - Mining Oil And Gas Extraction Kpi Dashboard Showing Ending Stock And Oil Production Volumes. This is a two stage process. The stages in this process are Mining, Oil And Gas Extraction, Refinery, Natural Gas.
-
 Mining oil and gas extraction kpi dashboard showing net sales and production by formation analysis
Presenting this set of slides with name - Mining Oil And Gas Extraction Kpi Dashboard Showing Net Sales And Production By Formation Analysis. This is a two stage process. The stages in this process are Mining, Oil And Gas Extraction, Refinery, Natural Gas.
-
 Mining oil and gas extraction kpi dashboard showing project delivery and availability factor
Presenting this set of slides with name - Mining Oil And Gas Extraction Kpi Dashboard Showing Project Delivery And Availability Factor. This is a four stage process. The stages in this process are Mining, Oil And Gas Extraction, Refinery, Natural Gas.
-
 Mining oil and gas extraction kpi dashboard showing steam to oil ratio and oil reserves
Presenting this set of slides with name - Mining Oil And Gas Extraction Kpi Dashboard Showing Steam To Oil Ratio And Oil Reserves. This is a four stage process. The stages in this process are Mining, Oil And Gas Extraction, Refinery, Natural Gas.
-
 Mining oil and gas extraction kpi dashboard showing total production and budget
Presenting this set of slides with name - Mining Oil And Gas Extraction Kpi Dashboard Showing Total Production And Budget. This is a three stage process. The stages in this process are Mining, Oil And Gas Extraction, Refinery, Natural Gas.
-
 Quality control kpi dashboard snapshot showing data quality
Presenting this set of slides with name - Quality Control Kpi Dashboard Snapshot Showing Data Quality. This is a six stage process. The stages in this process are Quality Management, Quality Control, Quality Assurance.
-
 Quality control kpi dashboard showing defect severity distribution
Presenting this set of slides with name - Quality Control Kpi Dashboard Showing Defect Severity Distribution. This is a four stage process. The stages in this process are Quality Management, Quality Control, Quality Assurance.
-
 Quality control kpi dashboard showing defects and downtime
Presenting this set of slides with name - Quality Control Kpi Dashboard Showing Defects And Downtime. This is a five stage process. The stages in this process are Quality Management, Quality Control, Quality Assurance.
-
 Quality control kpi dashboard showing events per hour and day
Presenting this set of slides with name - Quality Control Kpi Dashboard Showing Events Per Hour And Day. This is a four stage process. The stages in this process are Quality Management, Quality Control, Quality Assurance.
-
 Quality control kpi dashboard showing process under control and cost of quality
Presenting this set of slides with name - Quality Control Kpi Dashboard Showing Process Under Control And Cost Of Quality. This is a four stage process. The stages in this process are Quality Management, Quality Control, Quality Assurance.
-
 Quality control kpi dashboard showing reported issues and priority
Presenting this set of slides with name - Quality Control Kpi Dashboard Showing Reported Issues And Priority. This is a four stage process. The stages in this process are Quality Management, Quality Control, Quality Assurance.
-
 Quality control kpi dashboard showing test case status
Presenting this set of slides with name - Quality Control Kpi Dashboard Showing Test Case Status. This is a two stage process. The stages in this process are Quality Management, Quality Control, Quality Assurance.
-
 Quality control kpi dashboard showing test execution status
Presenting this set of slides with name - Quality Control Kpi Dashboard Showing Test Execution Status. This is a four stage process. The stages in this process are Quality Management, Quality Control, Quality Assurance.
-
 Agile organization it development asset management condition monitoring
Presenting this set of slides with name - Agile Organization It Development Asset Management Condition Monitoring. This is an editable one stages graphic that deals with topics like Agile Organization It Development, Asset Management Condition Monitoring to help convey your message better graphically. This product is a premium product available for immediate download, and is 100 percent editable in Powerpoint. Download this now and use it in your presentations to impress your audience.
-
 Engaging local challenges empowering change agents assessing growth
Presenting this set of slides with name - Engaging Local Challenges Empowering Change Agents Assessing Growth. This is an editable four stages graphic that deals with topics like Engaging Local Challenges, Empowering Change Agents, Assessing Growth to help convey your message better graphically. This product is a premium product available for immediate download, and is 100 percent editable in Powerpoint. Download this now and use it in your presentations to impress your audience.
-
 Strategic items understanding management expectations current state collecting data
Presenting this set of slides with name - Strategic Items Understanding Management Expectations Current State Collecting Data. This is an editable three stages graphic that deals with topics like Strategic Items, Understanding Management Expectations, Current State, Collecting Data to help convey your message better graphically. This product is a premium product available for immediate download, and is 100 percent editable in Powerpoint. Download this now and use it in your presentations to impress your audience.
-
 Resource utilisation by region type and for hours
Presenting this set of slides with name - Resource Utilisation By Region Type And For Hours. This is a three stage process. The stages in this process are Resource Management, Resource Utilization, Resource Allocation.
-
 Resource utilisation showing capacity budgets and plans
Presenting this set of slides with name - Resource Utilisation Showing Capacity Budgets And Plans. This is a three stage process. The stages in this process are Resource Management, Resource Utilization, Resource Allocation.
-
 Resource utilisation showing team capacity individual capacity
Presenting this set of slides with name - Resource Utilisation Showing Team Capacity Individual Capacity. This is a four stage process. The stages in this process are Resource Management, Resource Utilization, Resource Allocation.
-
 Resource utilization dashboard with tasks thats not completed in progress completed
Presenting this set of slides with name - Resource Utilization Dashboard With Tasks Thats Not Completed In Progress Completed. This is a four stage process. The stages in this process are Resource Management, Resource Utilization, Resource Allocation.
-
 Resource utilization planning with task name project
Presenting this set of slides with name - Resource Utilization Planning With Task Name Project. This is a three stage process. The stages in this process are Resource Management, Resource Utilization, Resource Allocation.
-
 Resource utilization showing assignment work with dates
Presenting this set of slides with name - Resource Utilization Showing Assignment Work With Dates. This is a seven stage process. The stages in this process are Resource Management, Resource Utilization, Resource Allocation.
-
 Resource utilization with meter reading of the each person
Presenting this set of slides with name - Resource Utilization With Meter Reading Of The Each Person. This is a four stage process. The stages in this process are Resource Management, Resource Utilization, Resource Allocation.
-
 3d graphs business bar chart and pie chart with icons
Presenting this set of slides with name - 3d Graphs Business Bar Chart And Pie Chart With Icons. This is a two stage process. The stages in this process are Paint Brush, Art, Coloring.
-
 Five options business 3d bar graph for data comparison
Presenting this set of slides with name - Five Options Business 3d Bar Graph For Data Comparison. This is a five stage process. The stages in this process are Paint Brush, Art, Coloring.
-
 Four options 3d bar graph to present data
Presenting this set of slides with name - Four Options 3d Bar Graph To Present Data. This is a four stage process. The stages in this process are Paint Brush, Art, Coloring.
-
 Four stages business 3d bar graph with icons and percentage values
Presenting this set of slides with name - Four Stages Business 3d Bar Graph With Icons And Percentage Values. This is a four stage process. The stages in this process are Paint Brush, Art, Coloring.
-
 Four steps 3d bar graph business info graphic
Presenting this set of slides with name - Four Steps 3d Bar Graph Business Info Graphic. This is a four stage process. The stages in this process are Paint Brush, Art, Coloring.
-
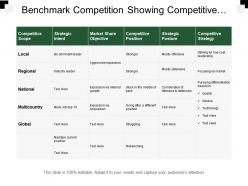
 Benchmark competition showing competitive scope and strategic intent
Presenting this set of slides with name - Benchmark Competition Showing Competitive Scope And Strategic Intent. This is a six stage process. The stages in this process are Benchmark Competition, Competitive Analysis, Competition Landscape.
-
 Benchmark competition showing customer relationship and experience
Presenting this set of slides with name - Benchmark Competition Showing Customer Relationship And Experience. This is a four stage process. The stages in this process are Benchmark Competition, Competitive Analysis, Competition Landscape.
-
 Benchmark competition showing loyalty index and net promoters score
Presenting this set of slides with name - Benchmark Competition Showing Loyalty Index And Net Promoters Score. This is a six stage process. The stages in this process are Benchmark Competition, Competitive Analysis, Competition Landscape.
-
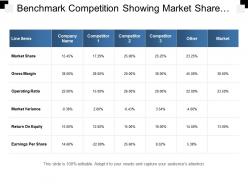
 Benchmark competition showing market share and gross margin
Presenting this set of slides with name - Benchmark Competition Showing Market Share And Gross Margin. This is a six stage process. The stages in this process are Benchmark Competition, Competitive Analysis, Competition Landscape.
-
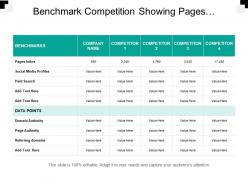
 Benchmark competition showing pages indexed and social media profiles
Presenting this set of slides with name - Benchmark Competition Showing Pages Indexed And Social Media Profiles. This is a four stage process. The stages in this process are Benchmark Competition, Competitive Analysis, Competition Landscape.
-
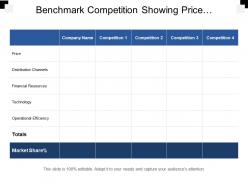
 Benchmark competition showing price distribution channels and financial resources
Presenting this set of slides with name - Benchmark Competition Showing Price Distribution Channels And Financial Resources. This is a four stage process. The stages in this process are Benchmark Competition, Competitive Analysis, Competition Landscape.
-
 Benchmark competition showing task success ease of use
Presenting this set of slides with name - Benchmark Competition Showing Task Success Ease Of Use. This is a four stage process. The stages in this process are Benchmark Competition, Competitive Analysis, Competition Landscape.
-
 Best practice for target achievement
Presenting this set of slides with name - Best Practice For Target Achievement. This is a four stage process. The stages in this process are Best Practice, Best Technique, Best Procedure.
-
 Decreasing cost dollar in circle and downward arrow
Presenting this set of slides with name - Decreasing Cost Dollar In Circle And Downward Arrow. This is a one stage process. The stages in this process are Data Science, Information Science, Data Analysis.
-
 Decreasing cost showing dollar and downward arrow
Presenting this set of slides with name - Decreasing Cost Showing Dollar And Downward Arrow. This is a two stage process. The stages in this process are Data Science, Information Science, Data Analysis.
-
 Decreasing cost showing pounds and downward arrow
Presenting this set of slides with name - Decreasing Cost Showing Pounds And Downward Arrow. This is a one stage process. The stages in this process are Data Science, Information Science, Data Analysis.
-
 Chart showing company financial market analysis index
Presenting this set of slides with name - Chart Showing Company Financial Market Analysis Index. This is a seven stage process. The stages in this process are Bull Market, Financial Markets, Stock Market.
-
 Financial market analysis of different companies
Presenting this set of slides with name - Financial Market Analysis Of Different Companies. This is a three stage process. The stages in this process are Bull Market, Financial Markets, Stock Market.
-
 Financial markets analysis with 4 arrows and dollar sign
Presenting this set of slides with name - Financial Markets Analysis With 4 Arrows And Dollar Sign. This is a four stage process. The stages in this process are Bull Market, Financial Markets, Stock Market.
-
 Financial markets analysis with magnifying glass showing dollar sign
Presenting this set of slides with name - Financial Markets Analysis With Magnifying Glass Showing Dollar Sign. This is a four stage process. The stages in this process are Bull Market, Financial Markets, Stock Market.
-
 Financial markets showing bar graphs
Presenting this set of slides with name - Financial Markets Showing Bar Graphs. This is a four stage process. The stages in this process are Bull Market, Financial Markets, Stock Market.
-
 Financial markets showing dollar sign with upward arrow
Presenting this set of slides with name - Financial Markets Showing Dollar Sign With Upward Arrow. This is a four stage process. The stages in this process are Bull Market, Financial Markets, Stock Market.
-
 Project background showing completion index and pie chart
Presenting this set of slides with name - Project Background Showing Completion Index And Pie Chart. This is a four stage process. The stages in this process are Project Background, Project Management, Project Description.
-
 Reliability centered maintenance system availability life cycle costing
Presenting this set of slides with name - Reliability Centered Maintenance System Availability Life Cycle Costing. This is an editable one stages graphic that deals with topics like Reliability Centered Maintenance, System Availability, Life Cycle Costing to help convey your message better graphically. This product is a premium product available for immediate download and is 100 percent editable in Powerpoint. Download this now and use it in your presentations to impress your audience.
-
 Aware environment major challenges relatively short relatively board
Presenting this set of slides with name - Aware Environment Major Challenges Relatively Short Relatively Board. This is an editable tweleve stages graphic that deals with topics like Aware Environment, Major Challenges, Relatively Short, Relatively Board to help convey your message better graphically. This product is a premium product available for immediate download and is 100 percent editable in Powerpoint. Download this now and use it in your presentations to impress your audience.
-
 Conduct research forecast demand idea scoring selection strategy map
Presenting this set of slides with name - Conduct Research Forecast Demand Idea Scoring Selection Strategy Map. This is an editable four stages graphic that deals with topics like Conduct Research Forecast Demand, Idea Scoring Selection, Strategy Map to help convey your message better graphically. This product is a premium product available for immediate download, and is 100 percent editable in Powerpoint. Download this now and use it in your presentations to impress your audience.
-
 Market access commercial organization effectiveness initiation operations target customer
Presenting this set of slides with name - Market Access Commercial Organization Effectiveness Initiation Operations Target Customer. This is an editable four stages graphic that deals with topics like Market Access, Commercial Organization Effectiveness, Initiation Operations, Target Customer to help convey your message better graphically. This product is a premium product available for immediate download, and is 100 percent editable in Powerpoint. Download this now and use it in your presentations to impress your audience.
-
 Strategic management information system market coverage
Presenting this set of slides with name - Strategic Management Information System Market Coverage. This is an editable nine stages graphic that deals with topics like Strategic Management Information System, Market Coverage to help convey your message better graphically. This product is a premium product available for immediate download, and is 100 percent editable in Powerpoint. Download this now and use it in your presentations to impress your audience.
-
 Business priorities covering growth profitability cost products and innovation
Presenting this set of slides with name - Business Priorities Covering Growth Profitability Cost Products And Innovation. This is a three stage process. The stages in this process are Business Priorities, Business Goals, Business Objectives.
-
 Business priorities showing bar attract clients reduce costs and track workflow
Presenting this set of slides with name - Business Priorities Showing Bar Attract Clients Reduce Costs And Track Workflow. This is a seven stage process. The stages in this process are Business Priorities, Business Goals, Business Objectives.
-
 Drill down country wise breakdown having bar graph and pie chart
Presenting this set of slides with name - Drill Down Country Wise Breakdown Having Bar Graph And Pie Chart. This is a three stage process. The stages in this process are Drill Down, Hierarchy, Top Downwards.
-
 Drill down month wise pie chart and day wise bar graph
Presenting this set of slides with name - Drill Down Month Wise Pie Chart And Day Wise Bar Graph. This is a two stage process. The stages in this process are Drill Down, Hierarchy, Top Downwards.
-
 Drill down sales for year and quarter wise
Presenting this set of slides with name - Drill Down Sales For Year And Quarter Wise. This is a two stage process. The stages in this process are Drill Down, Hierarchy, Top Downwards.
-
 Drill down year to months to days
Presenting this set of slides with name - Drill Down Year To Months To Days. This is a three stage process. The stages in this process are Drill Down, Hierarchy, Top Downwards.
-
 Objective sales promotion fast sales boost encourage trial
Presenting this set of slides with name - Objective Sales Promotion Fast Sales Boost Encourage Trial. This is an editable two stages graphic that deals with topics like Objective Sales Promotion, Fast Sales Boost, Encourage Trial to help convey your message better graphically. This product is a premium product available for immediate download, and is 100 percent editable in Powerpoint. Download this now and use it in your presentations to impress your audience.
-
 Timeline jobs filled initial conversations job career career needs
Presenting this set of slides with name - Timeline Jobs Filled Initial Conversations Job Career Career Needs. This is an editable five stages graphic that deals with topics like Timeline Jobs Filled, Initial Conversations, Job Career, Career Needs to help convey your message better graphically. This product is a premium product available for immediate download, and is 100 percent editable in Powerpoint. Download this now and use it in your presentations to impress your audience.
-
 Building blocks architecture vision transition architecture building blocks
Presenting this set of slides with name - Building Blocks Architecture Vision Transition Architecture Building Blocks. This is an editable two graphic that deals with topics like Building Blocks, Architecture Vision, Transition Architecture, Building Blocks to help convey your message better graphically. This product is a premium product available for immediate download, and is 100 percent editable in Powerpoint. Download this now and use it in your presentations to impress your audience.
-
Great experience, I would definitely use your services further.
-
Informative design.
-
Best Representation of topics, really appreciable.
-
Unique research projects to present in meeting.
-
Good research work and creative work done on every template.
-
The content is very helpful from business point of view.
-
Wonderful templates design to use in business meetings.
-
It saves your time and decrease your efforts in half.
-
Excellent work done on template design and graphics.
-
Very unique, user-friendly presentation interface.


