Sales process improvement consulting powerpoint presentation with slides
Are you enable to figure out why your team isn't bringing sales? Don't worry! With our PPT sample you can easily underline all the important issues of sales in order to motivate your sales team. Now using our readymade PowerPoint show you can give sales training to your work force for developing better sales processes. Moreover, with help of our sales consultancy presentation deck you can illustrate your companies sales accomplishments and shortcomings in order to bring a continuous improvement attitude among sales and marketing team. Apart from this, our PPT model comprises of PowerPoint templates to give insights about benefits of process improvement or importance of process improvement in business. But that's not all, our PPT example comprises of exclusive slide templates like quarterly pipeline summary, quarter track record, opportunity score, next quarter deals, win-loss review, forecast accuracy etc. to touch all facets of sales process consulting. Finally, you have all the things that you require to drive sales process improvement. Simply download and let your next sales process improvement consulting PowerPoint slide deck speak for itself. Adapt to the circumstances with our Sales Process Improvement Consulting Complete Powerpoint Deck With Slides. Get a big dose of flexibility.
You must be logged in to download this presentation.
 Impress your
 audience
Editable
of Time
PowerPoint presentation slides
All in all, complete set having 59 high resolution template themes. Designed exclusively considering need of a sales consultant and change managers. Customizable presentation background, text, color, images and graphs. Comparisons and graphs given to meticulously explain the process. Sufficient space available with all presentation graphics. Simple downloading process. No compatibility issue with diverse softwares. Well responsive to Google slides. The stages in this process are success, business, sales, strategy, planning, selling, review..
People who downloaded this PowerPoint presentation also viewed the following :
Content of this Powerpoint Presentation
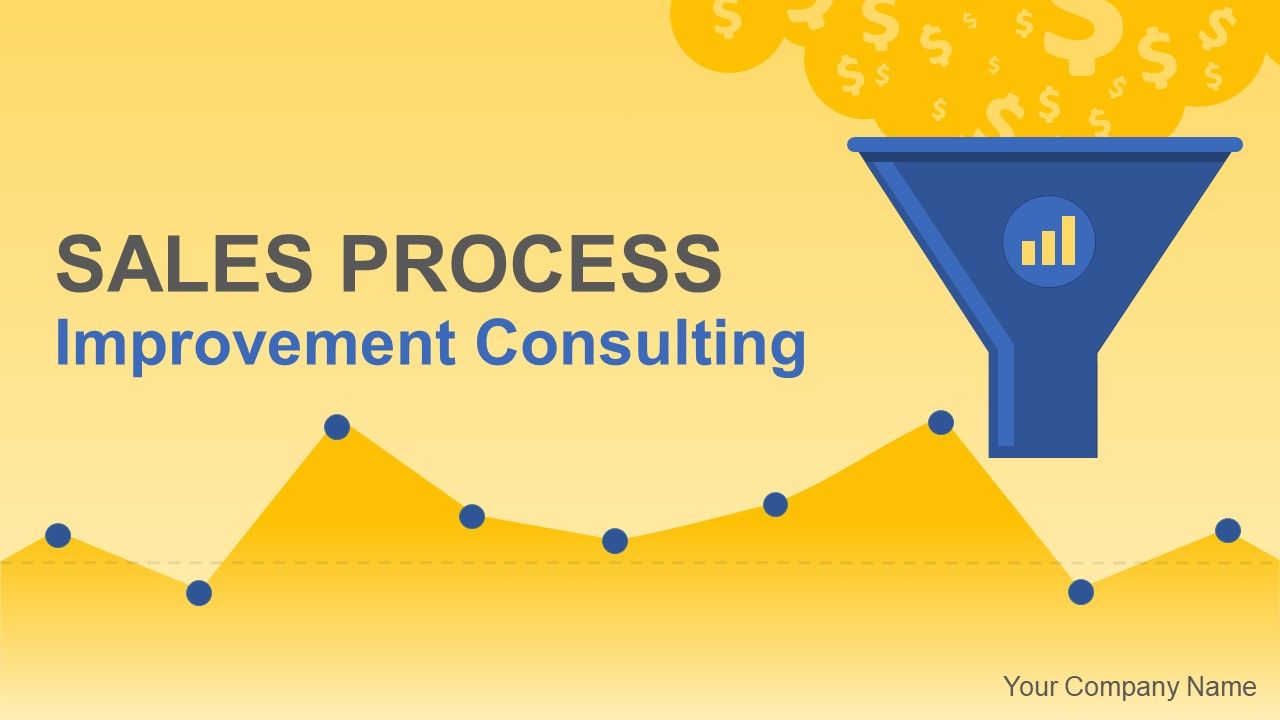
Slide 1: This slide introduces Sales Process Improvement Consulting. State Your Company Name and begin with clarity.
Slide 2: This is an Agenda slide. Present your agendas here.
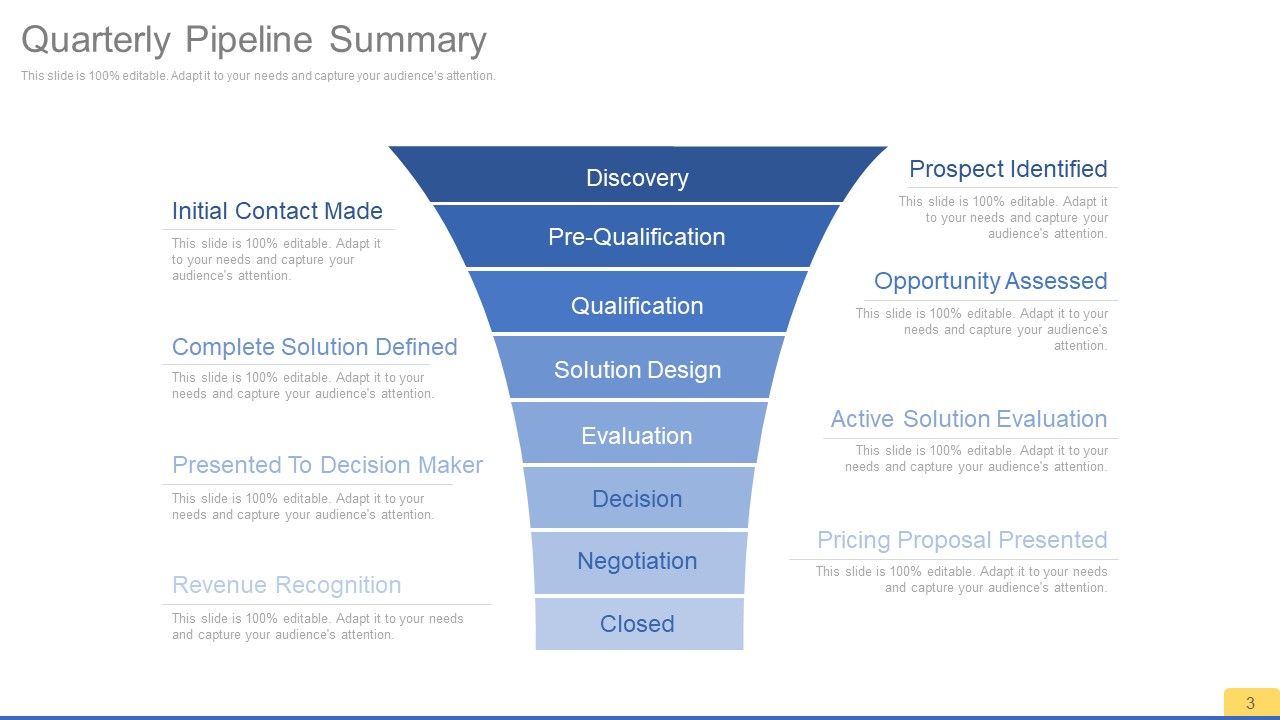
Slide 3: This slide showcases Quarterly Pipeline Summary displaying- Discovery, Pre-Qualification, Qualification, Solution Design, Evaluation, Decision, Negotiation, Closed subheaded as Prospect Identified, Opportunity Assessed, Active Solution Evaluation, Pricing Proposal Presented, Initial Contact Made, Complete Solution Defined, Presented To Decision Maker, Revenue Recognition.
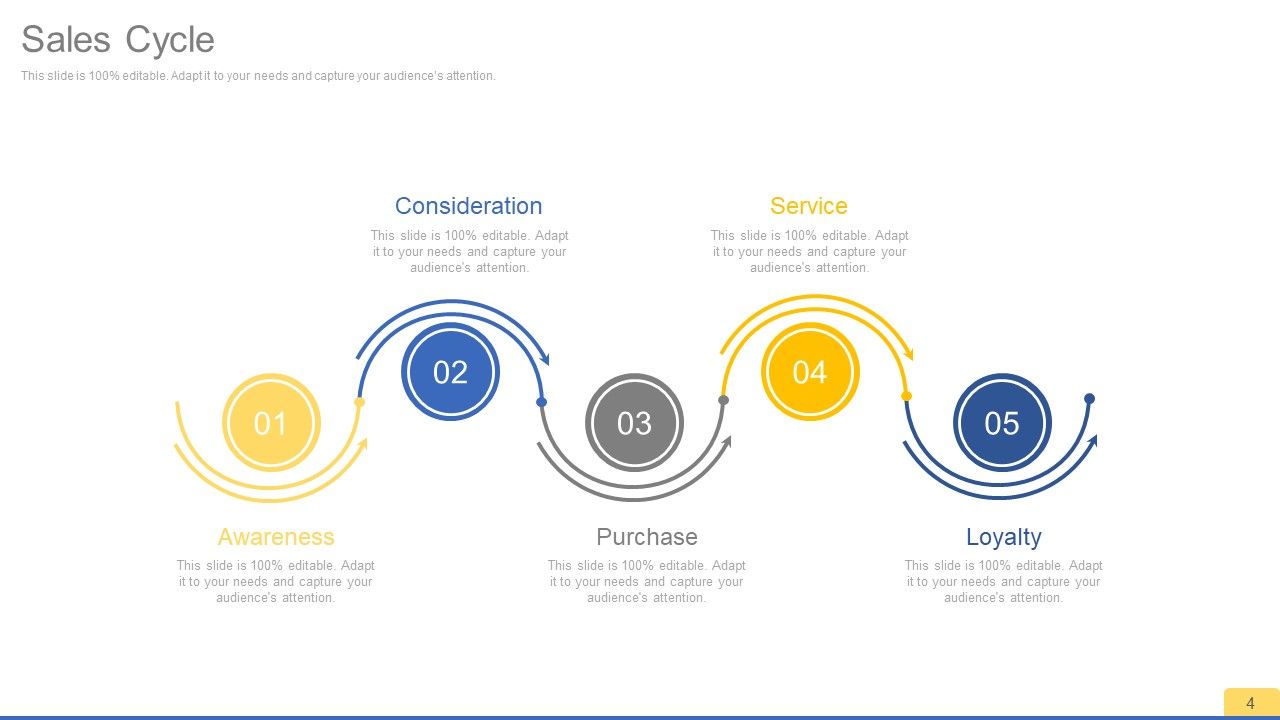
Slide 4: This slide showcases Sales Cycle displaying- Consideration, Service, Awareness, Purchase, Loyalty.
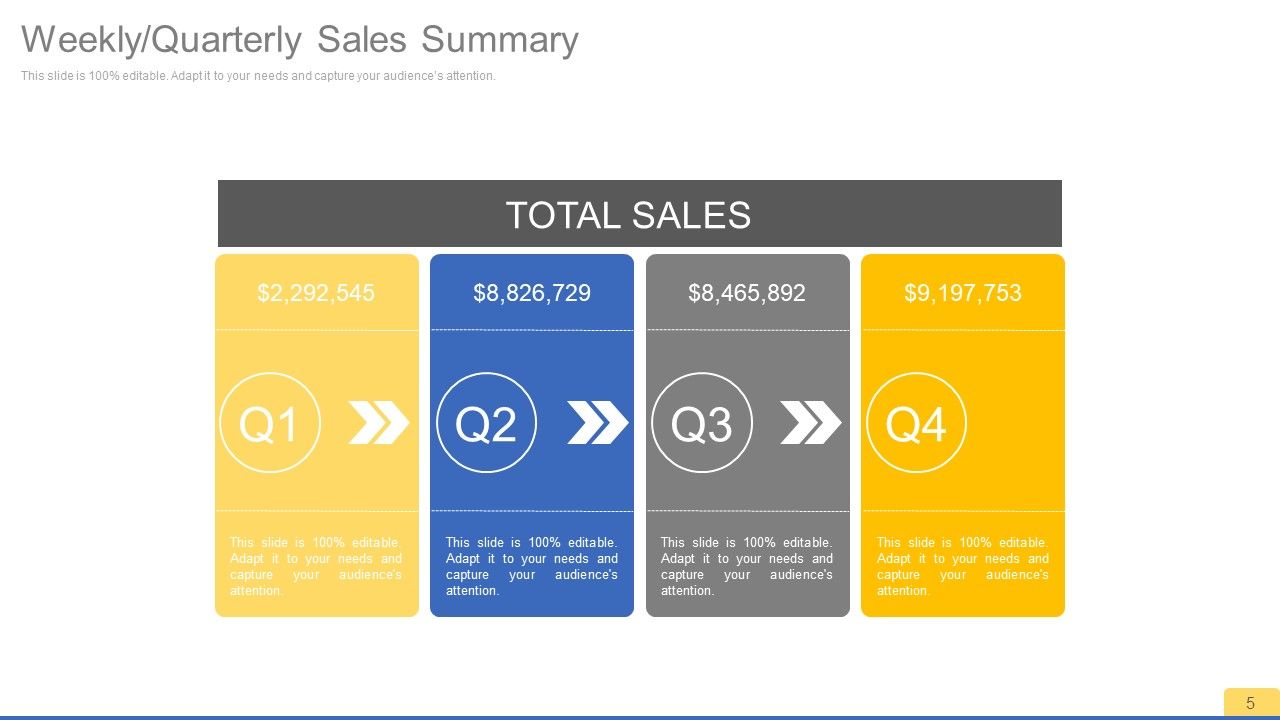
Slide 5: This slide displays Weekly/Quarterly Sales Summary in tabular box format.
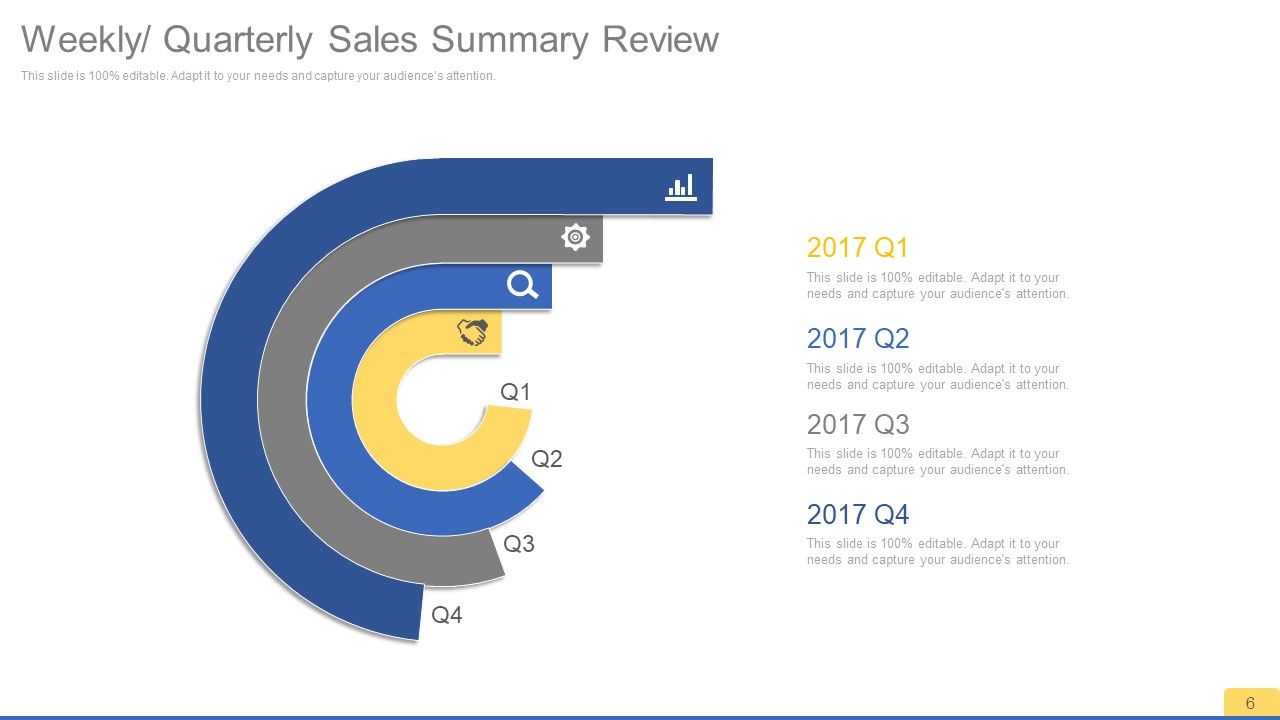
Slide 6: This slide shows Weekly/ Quarterly Sales Summary Review.
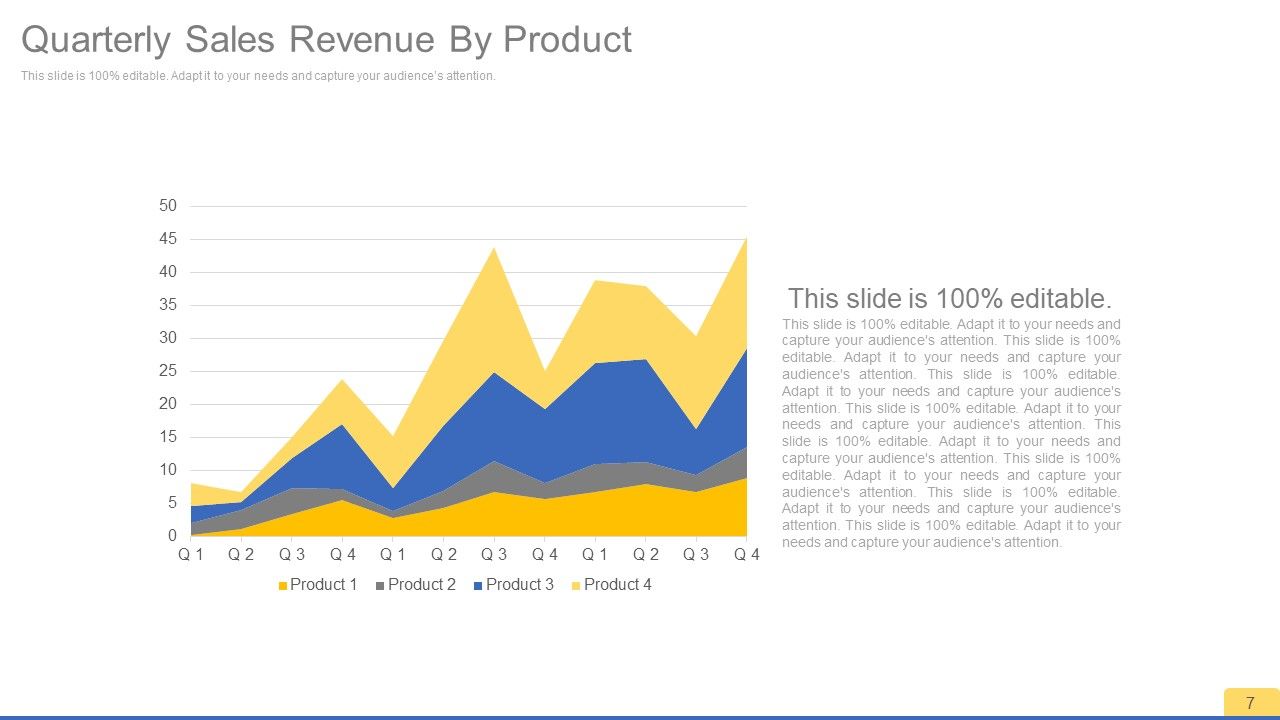
Slide 7: This Quarterly Sales Revenue By Product in graph form.
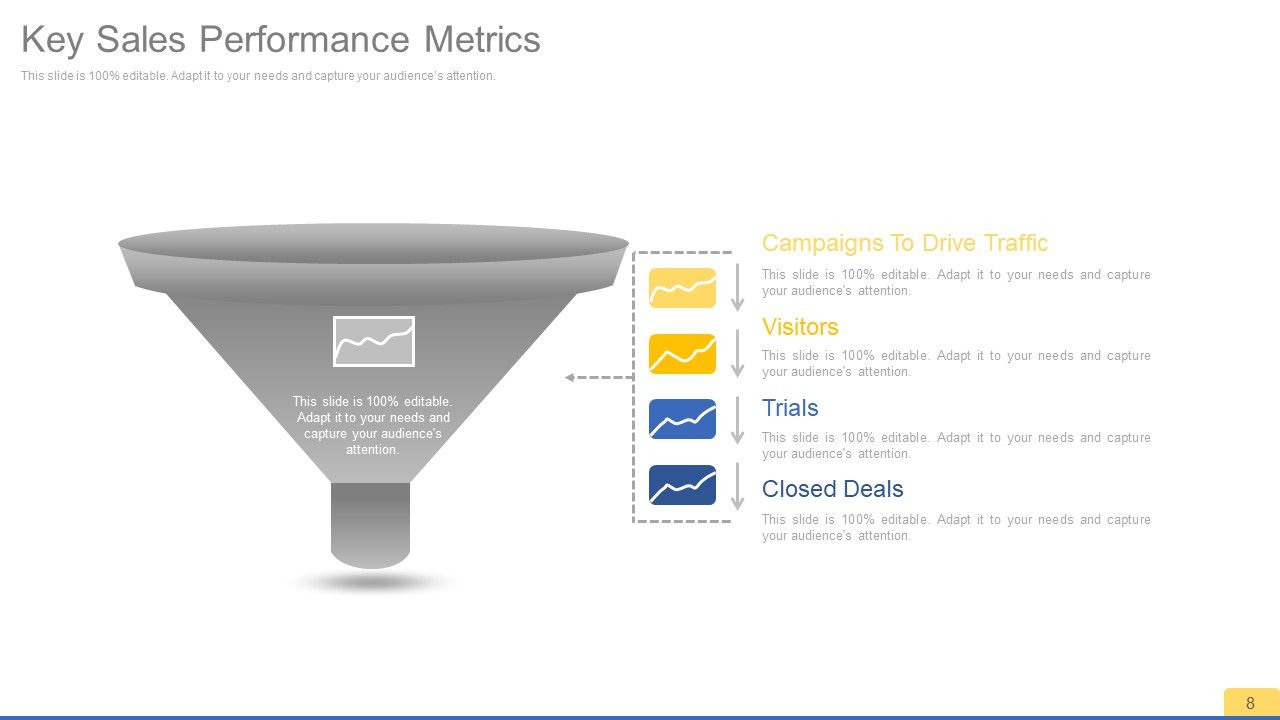
Slide 8: This slide shows Key Sales Performance Metrics in funnel form displaying- Trials, Closed Deals, Visitors, Campaigns To Drive Traffic.
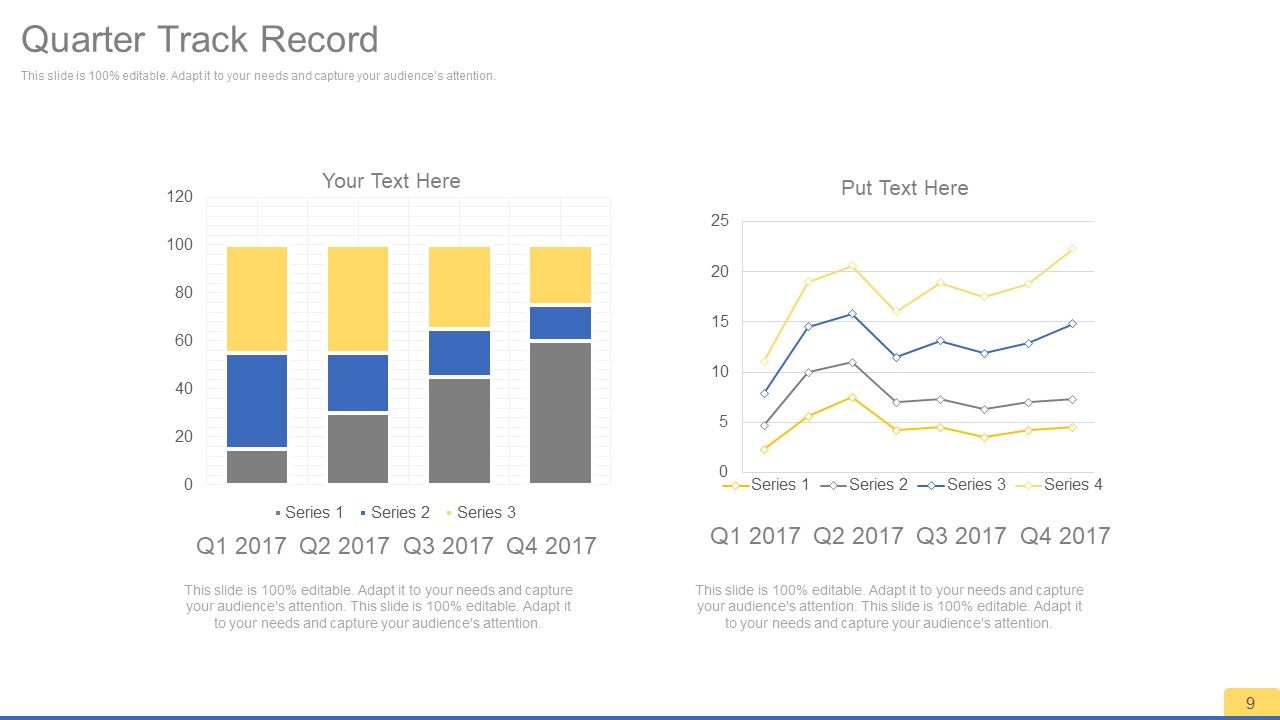
Slide 9: This slide showcases Quarter Track Record in graph form.
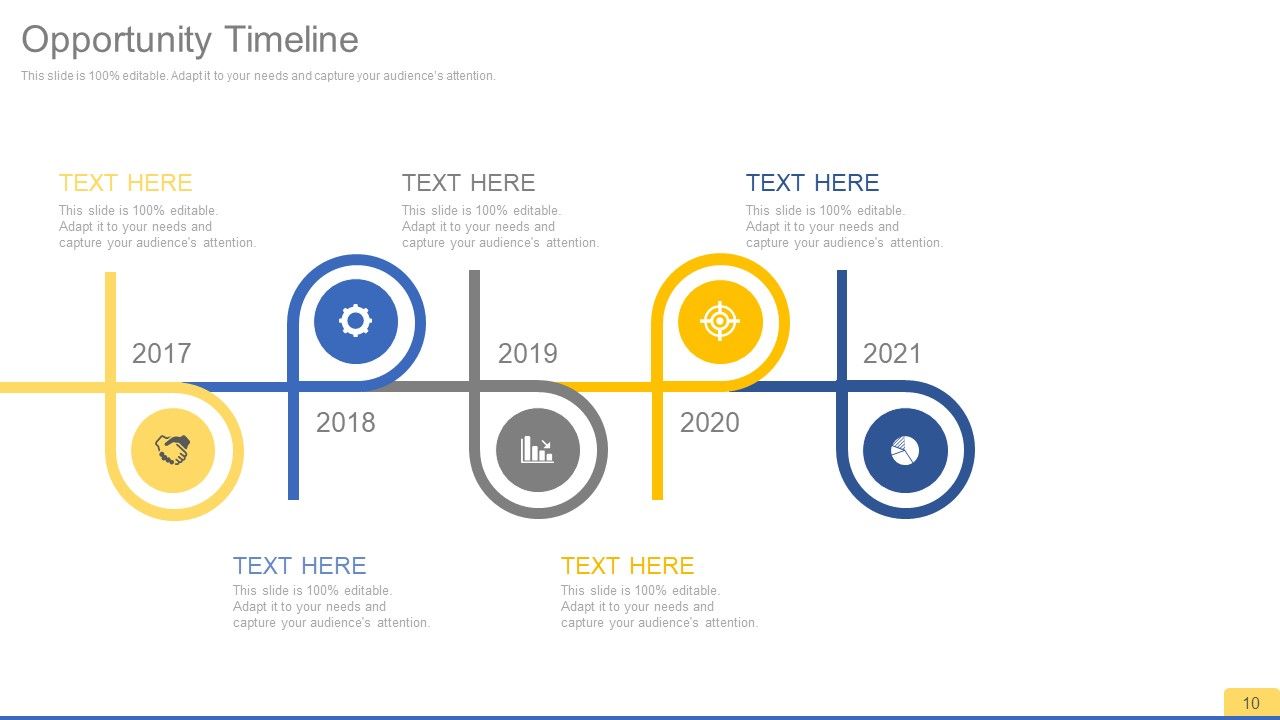
Slide 10: This slide presents an Opportunity Timeline. State relative aspects here.
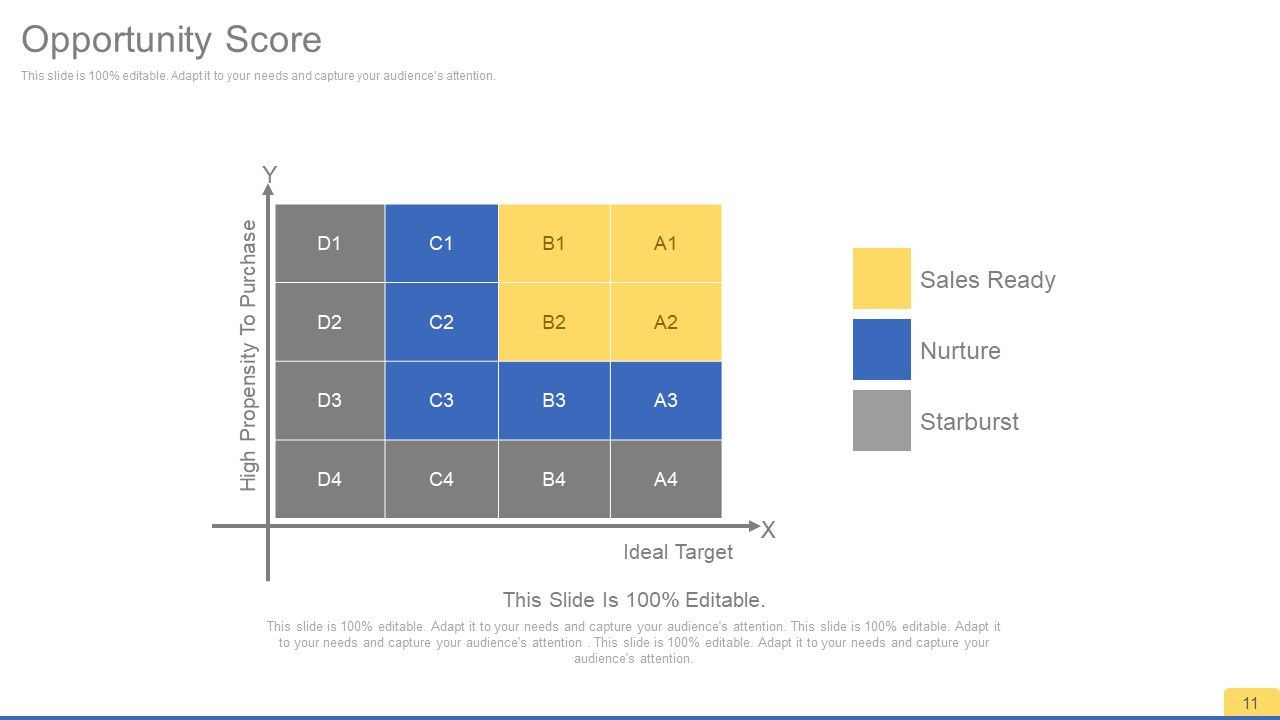
Slide 11: This slide showcases Opportunity Score in graph matrix form displaying Ideal Target, High Propensity To Purchase as Sales Ready, Nurture, Starburst.
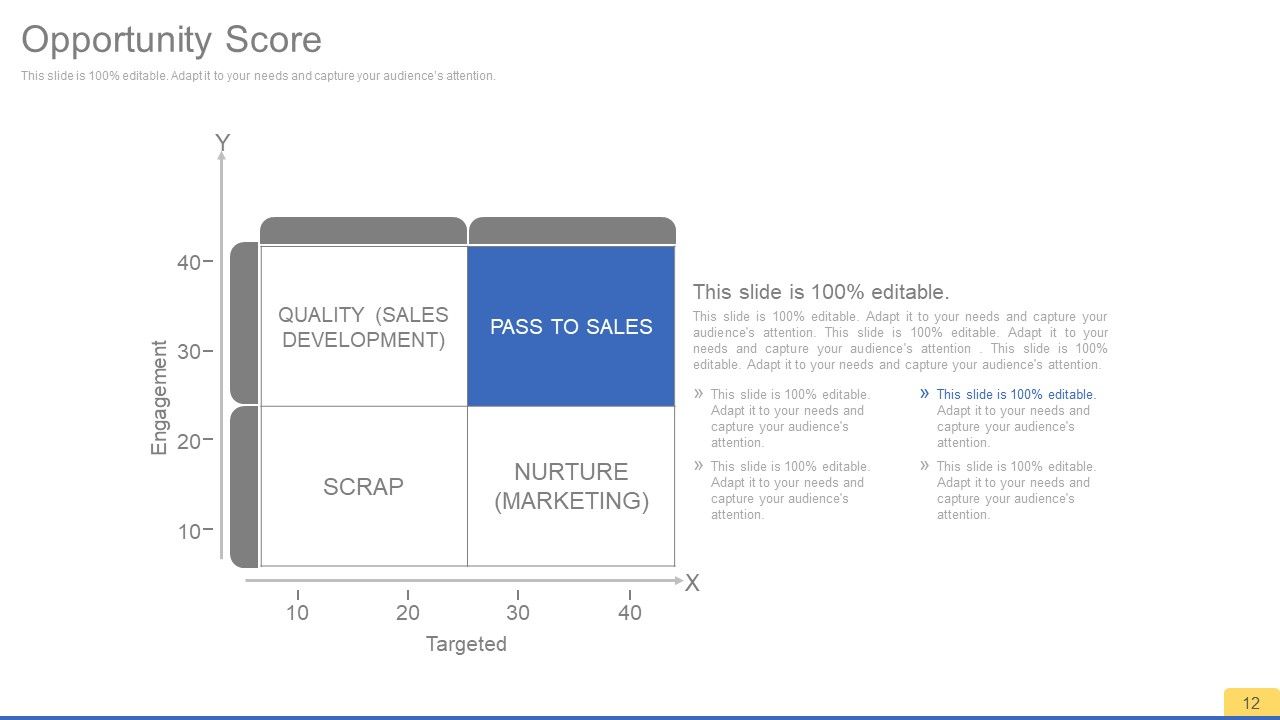
Slide 12: This slide showcases Opportunity Score in matrix form.
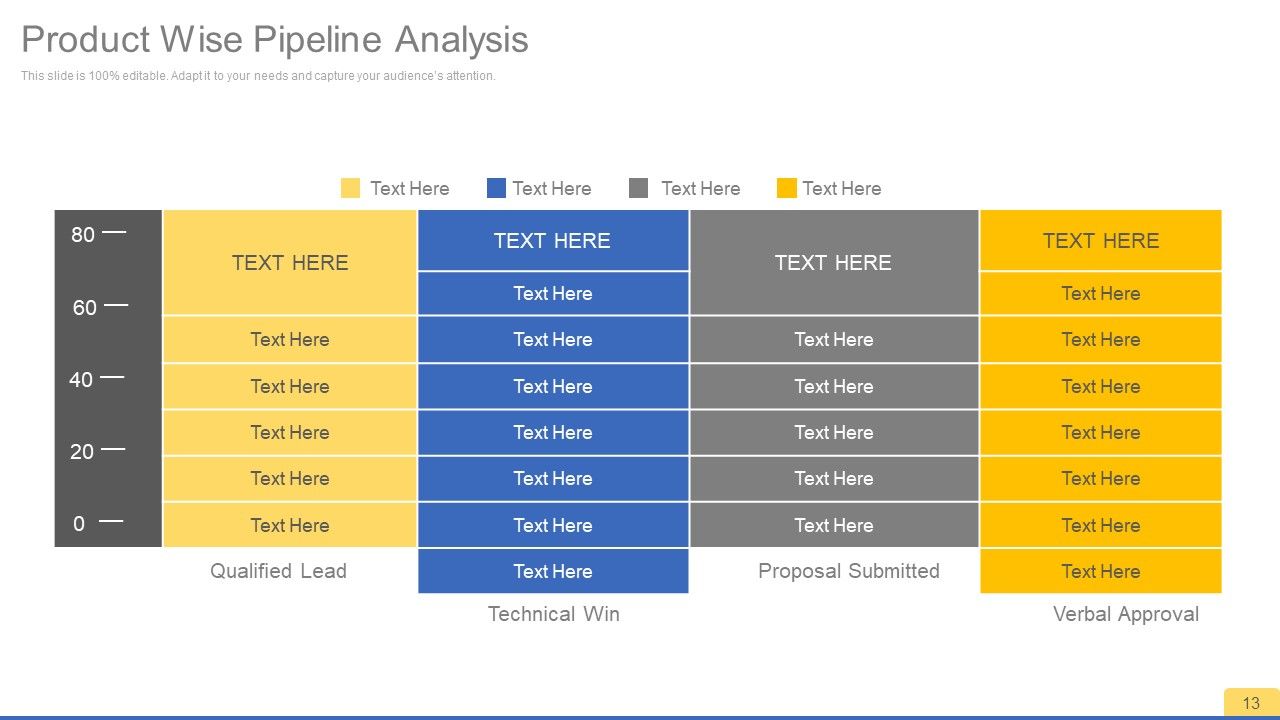
Slide 13: This slide showcases Product Wise Pipeline Analysis in tabular form showing- Qualified Lead, Technical Win, Proposal Submitted, Verbal Approval.
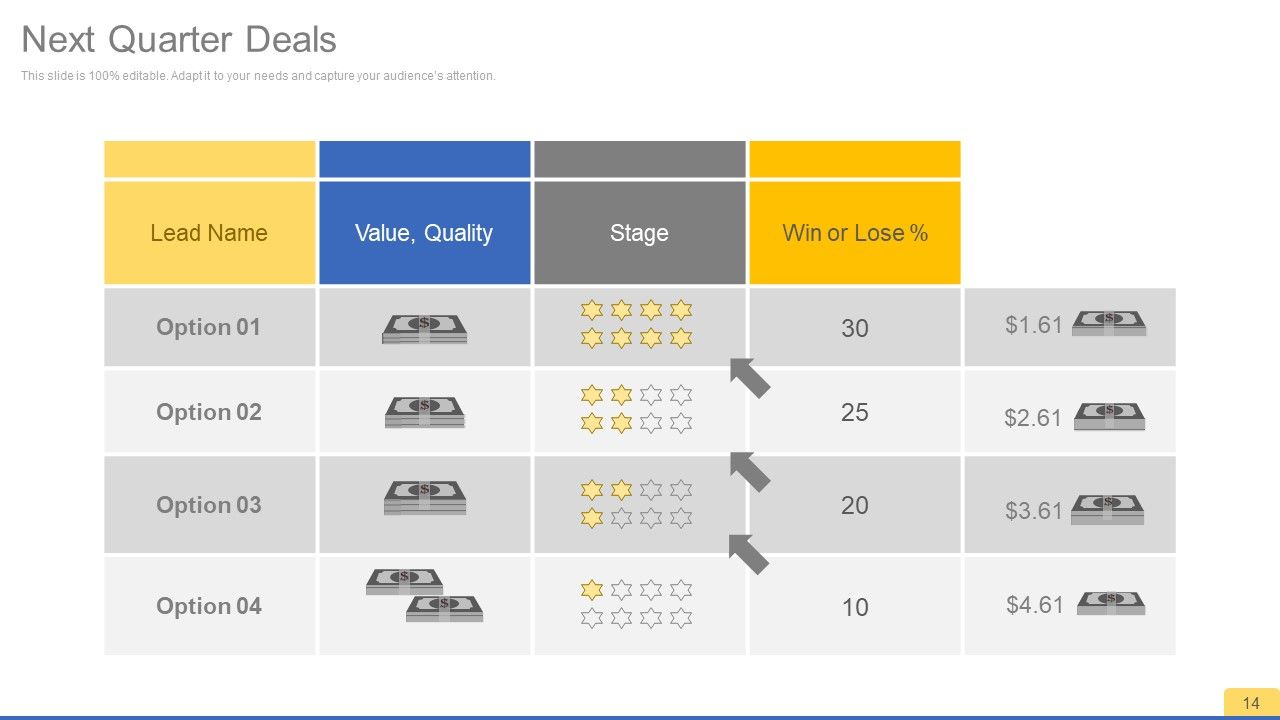
Slide 14: This slide showcases Next Quarter Deals in tabular form.
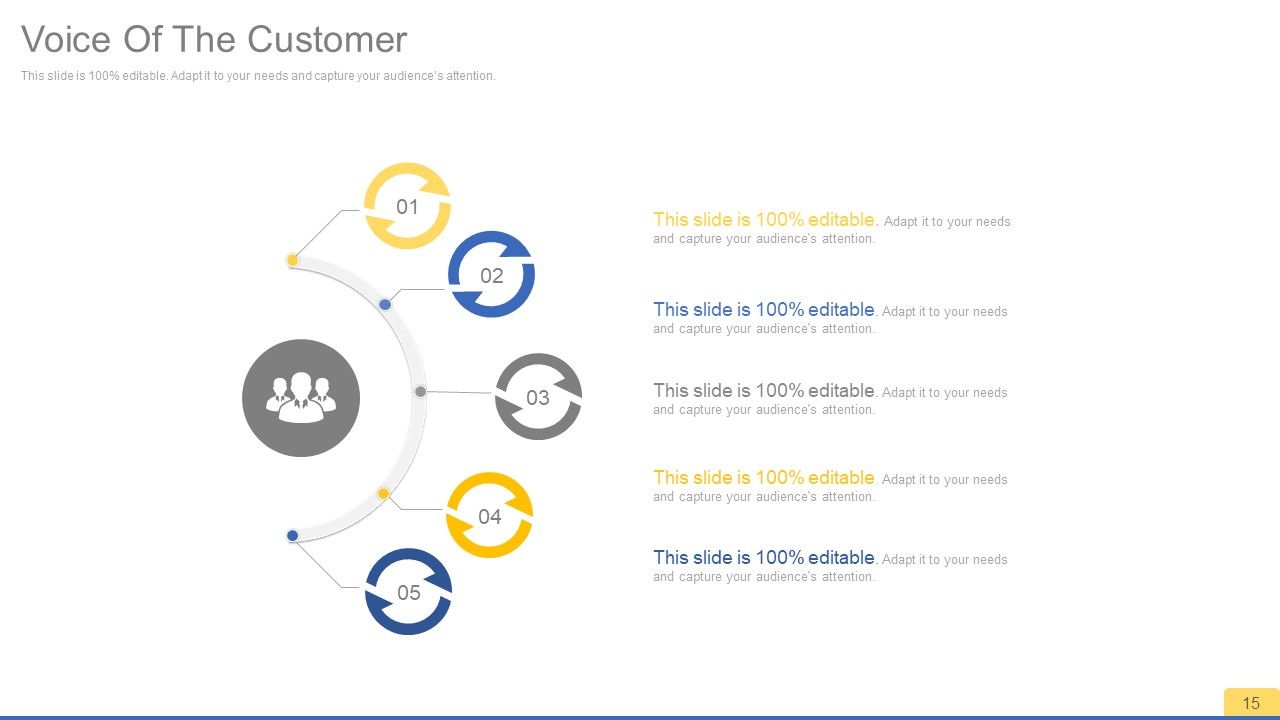
Slide 15: This slide presents Voice Of The Customer to be included.
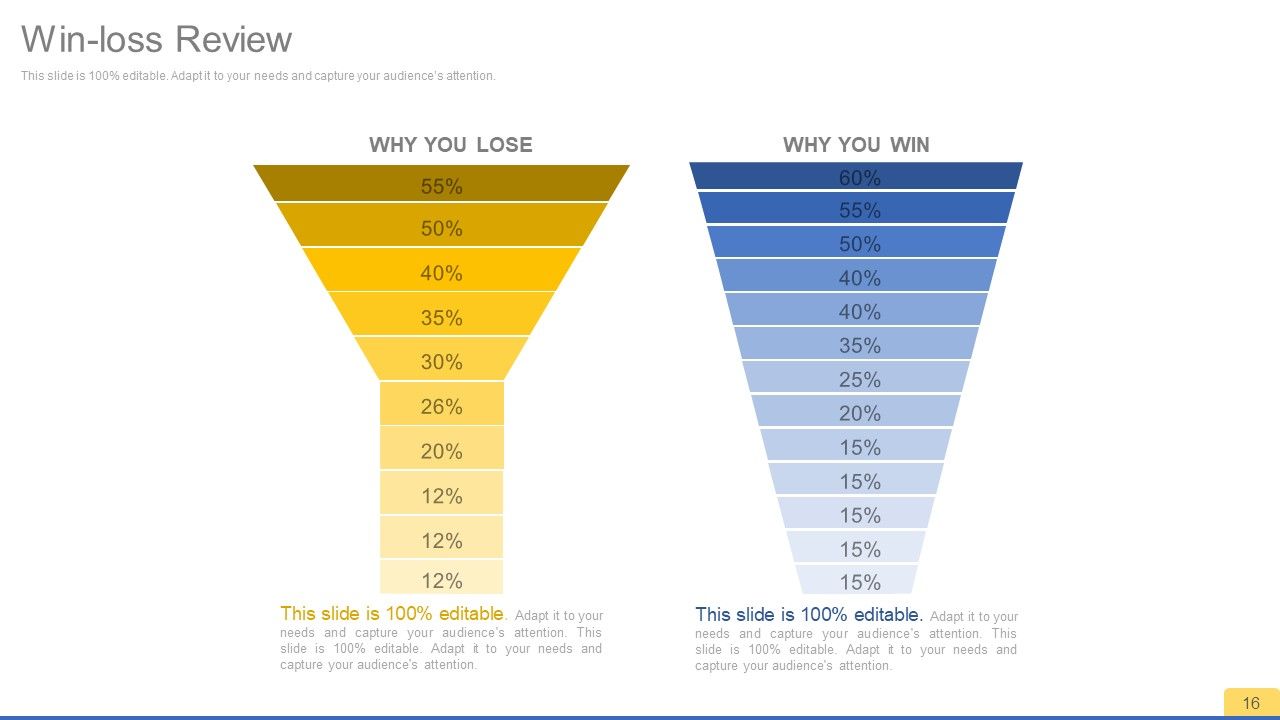
Slide 16: This is a Win-loss Review funnel image slide showing- Why You Win, Why You Lose.
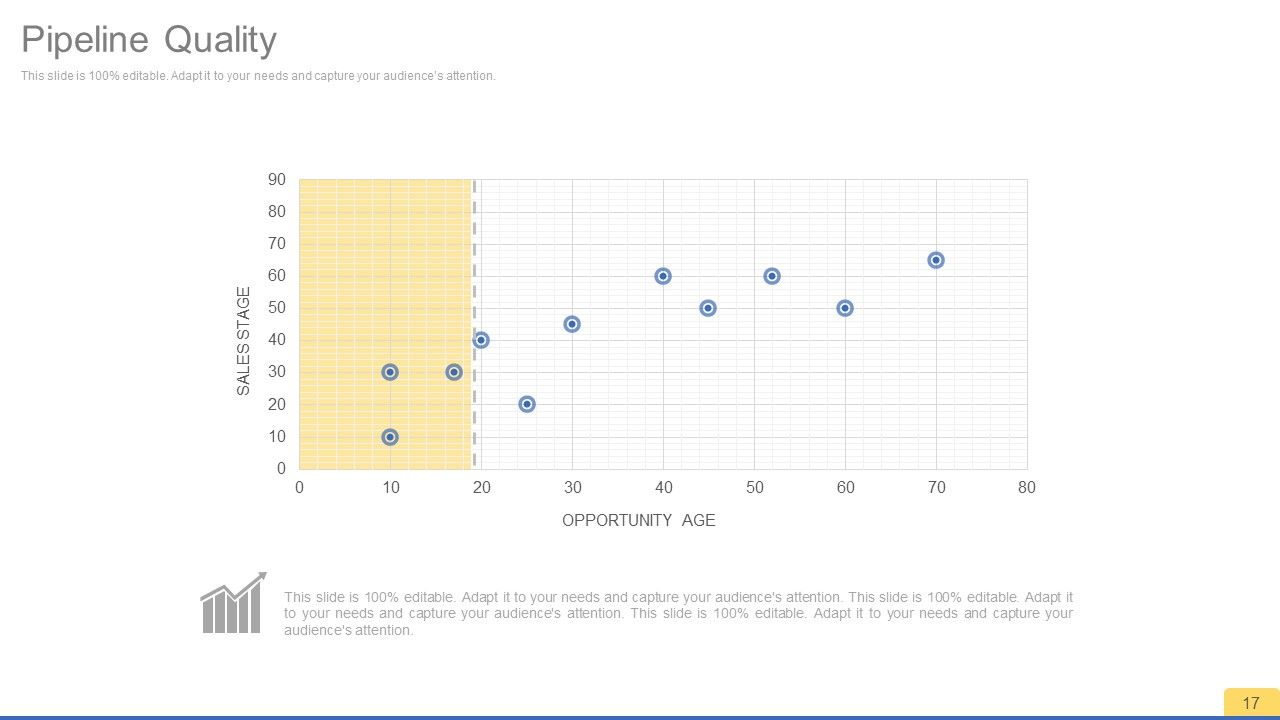
Slide 17: This slide showcases Pipeline Quality in graph form.
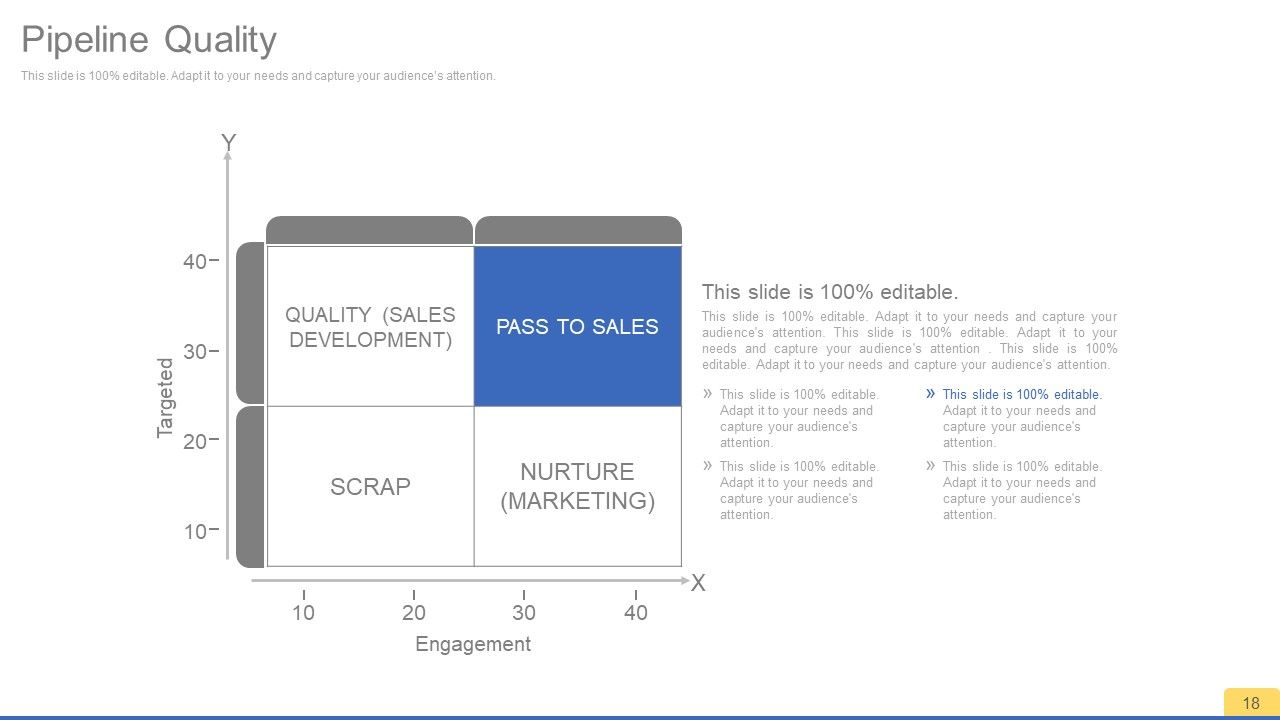
Slide 18: This slide shows Pipeline Quality in matrix form showing- Targeted and Engagement factors.
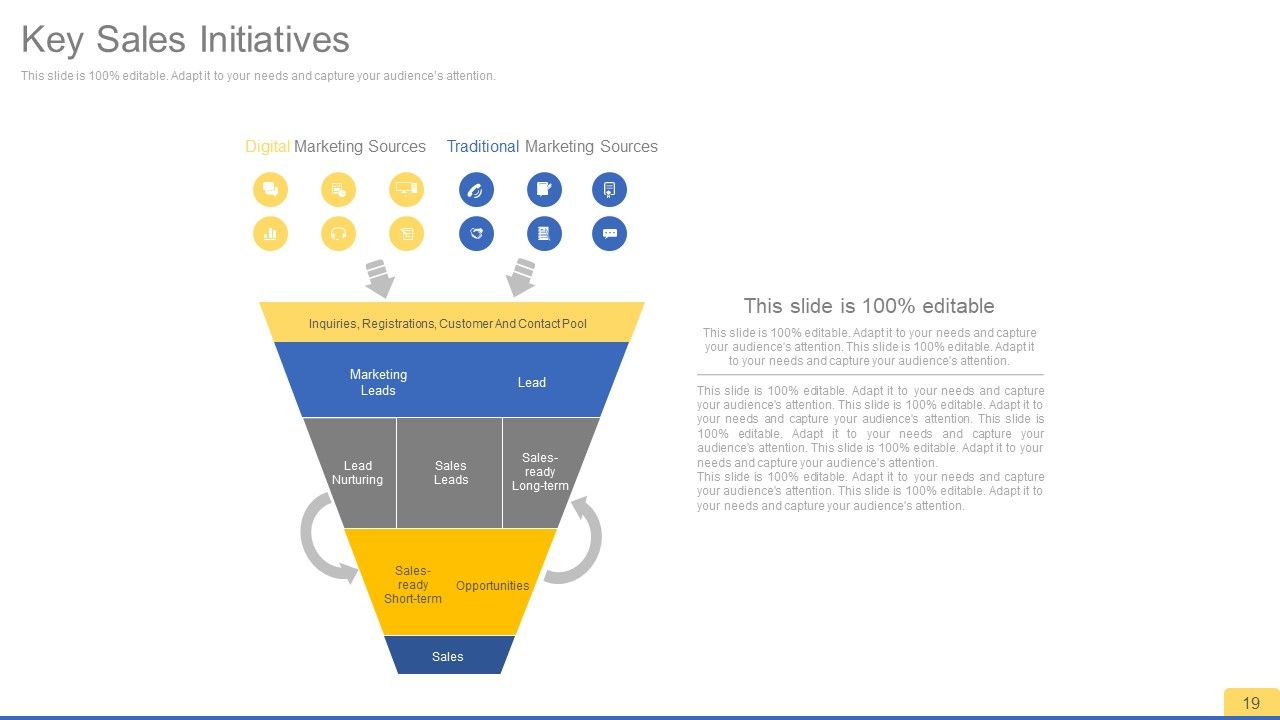
Slide 19: This slide presents Key Sales Initiatives displaying- Digital Marketing Sources, Traditional Marketing Sources, Inquiries, Registrations, Customer And Contact Pool, Marketing Leads, Lead, Lead Nurturing, Sales Leads, Sales-ready, Long-term, Sales-ready, Short-term, Opportunities, Sales.
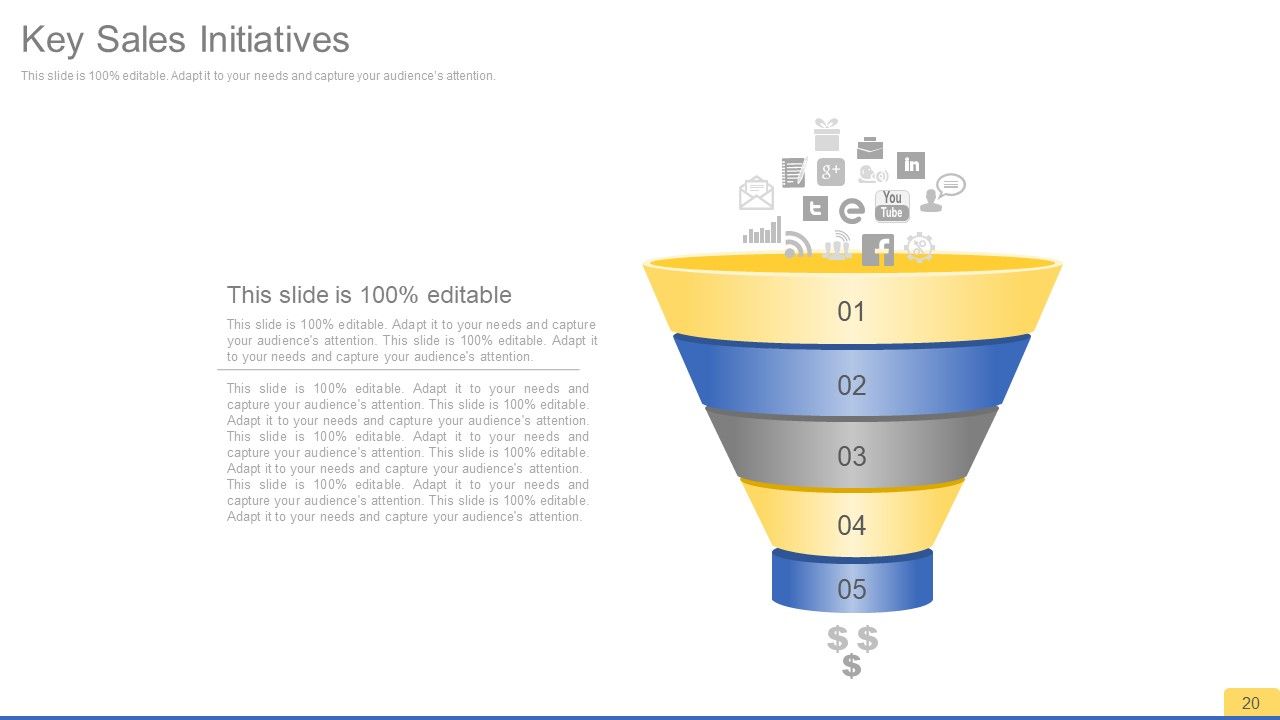
Slide 20: This slide presents Key Sales Initiatives in funnel form.
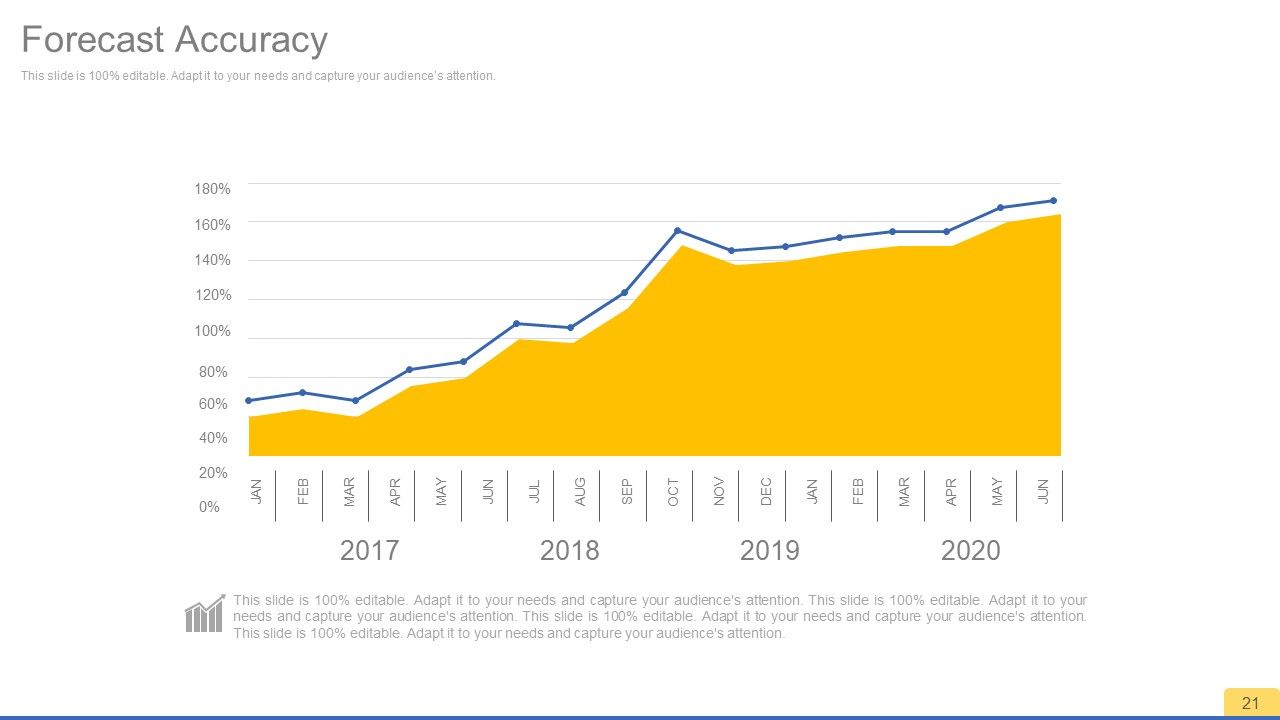
Slide 21: This slide showcases Forecast Accuracy in graph form.
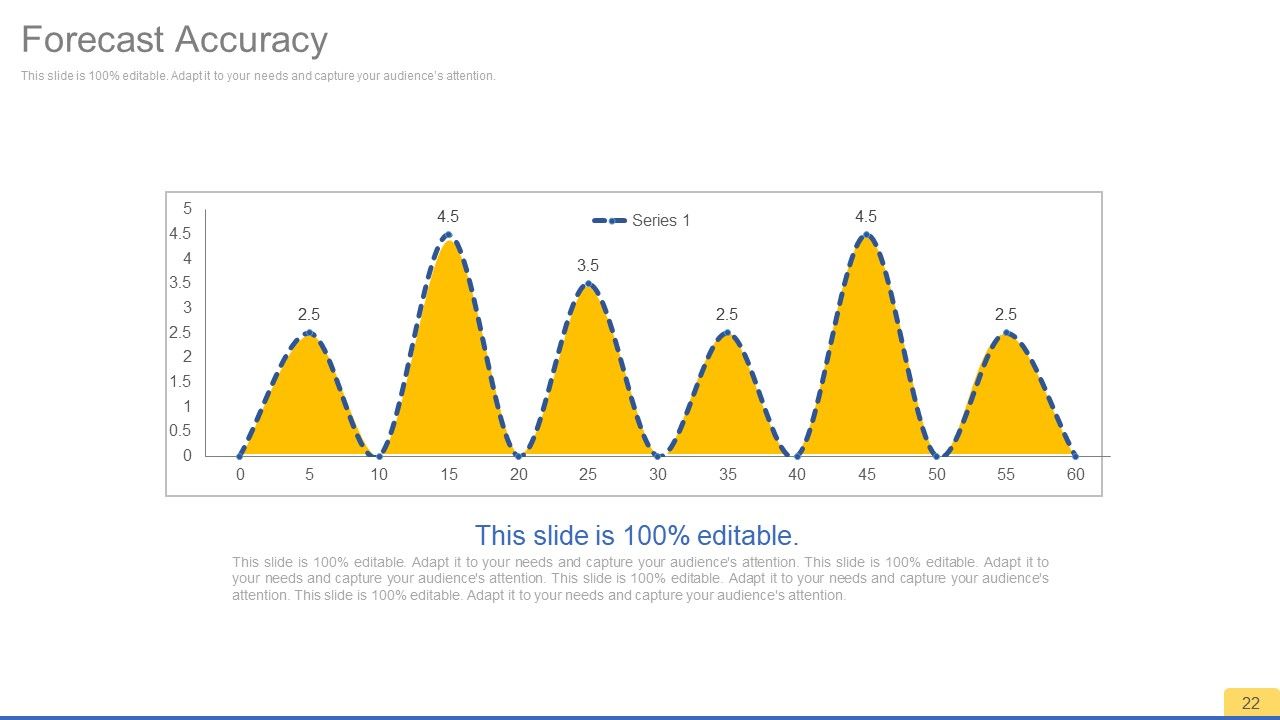
Slide 22: This slide also displays Forecast Accuracy in graph form.
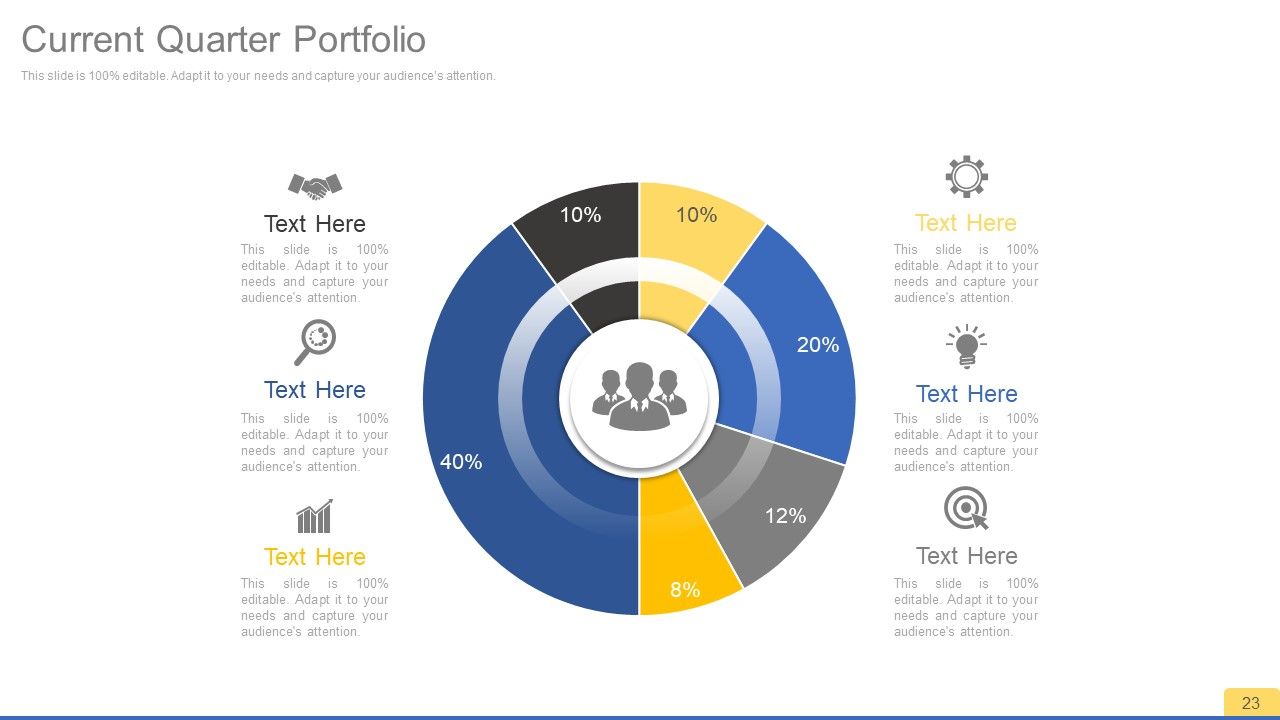
Slide 23: This slide showcases Current Quarter Portfolio in circular image form.
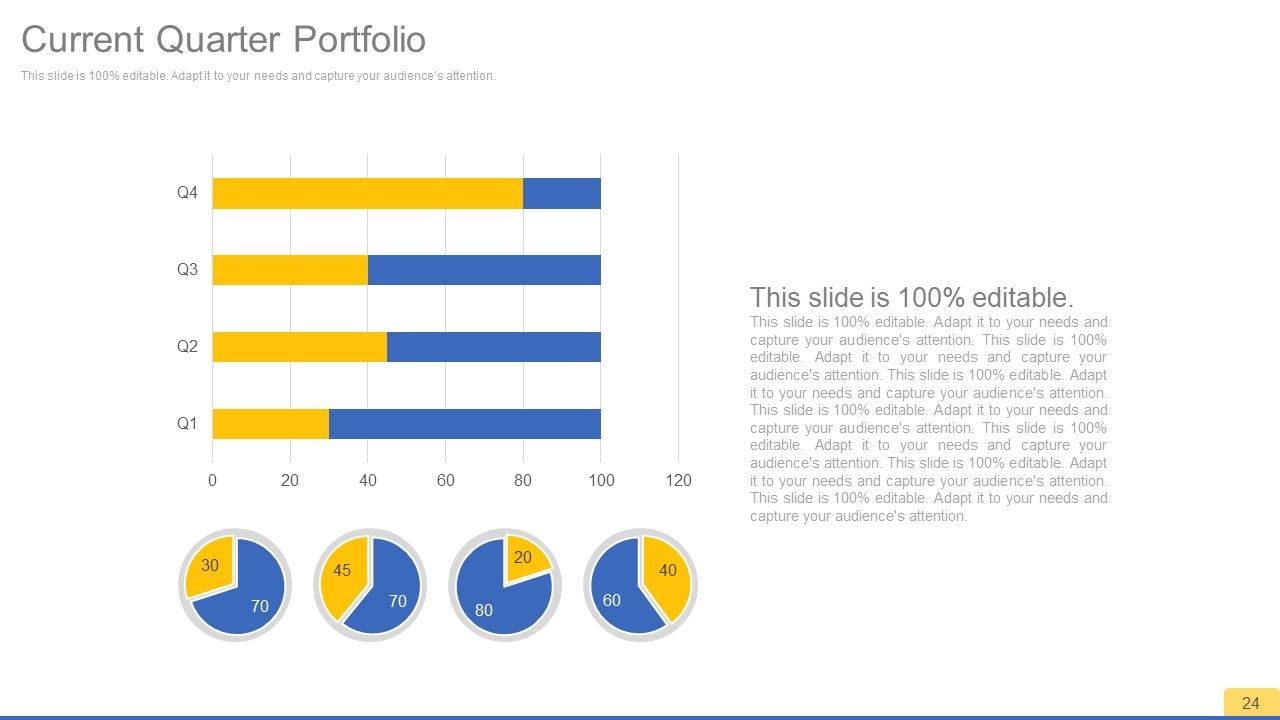
Slide 24: This slide showcases Current Quarter Portfolio in bar graph form.
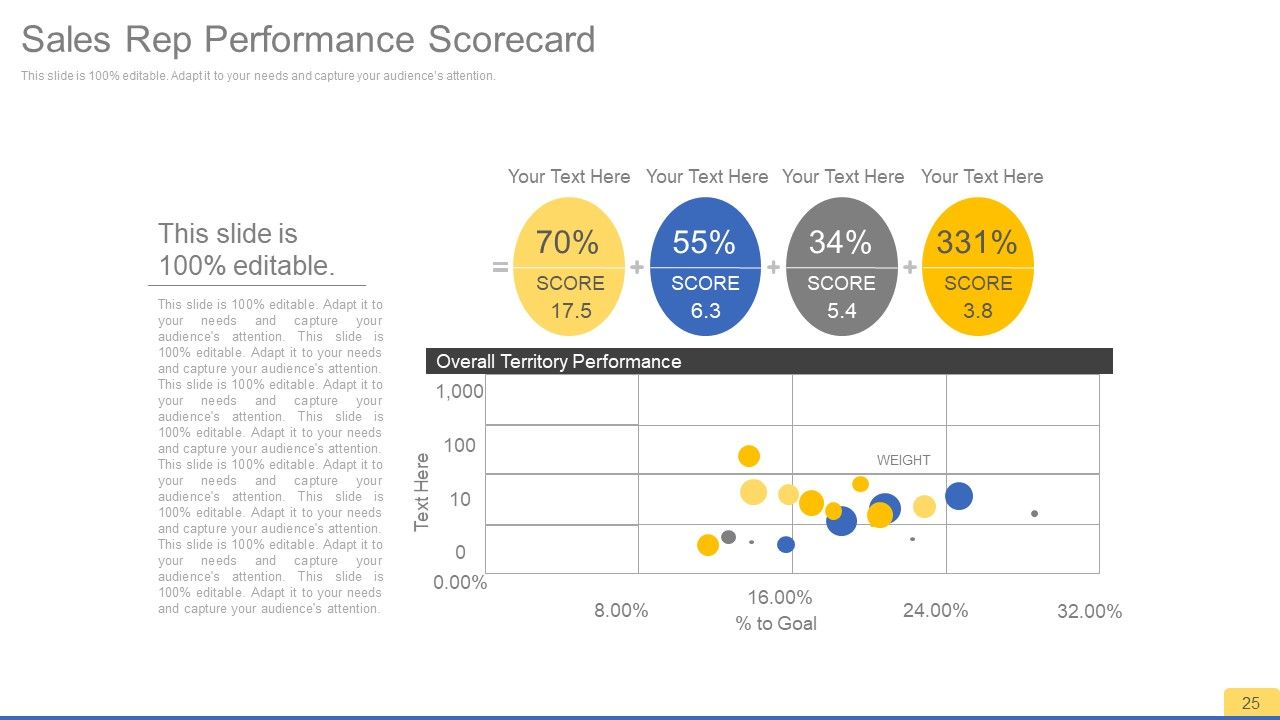
Slide 25: This is a Sales Rep Performance Scorecard slide.
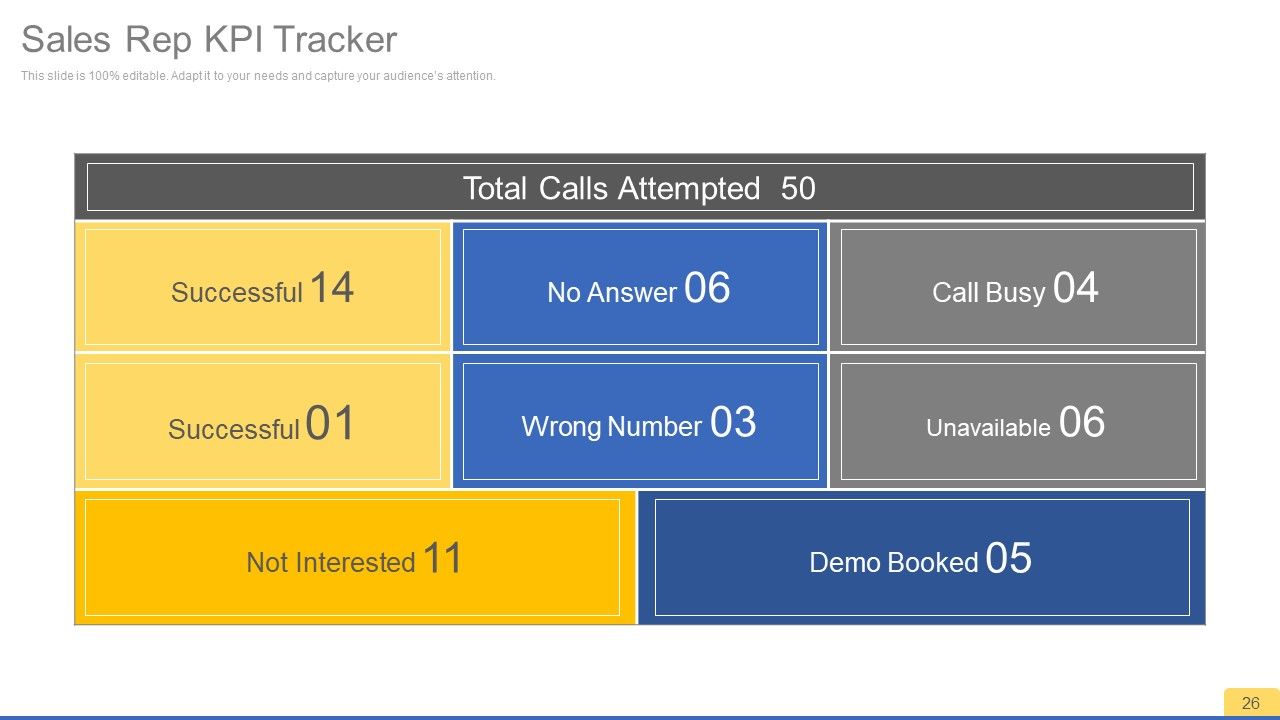
Slide 26: This slide shows Sales Rep KPI Tracker.
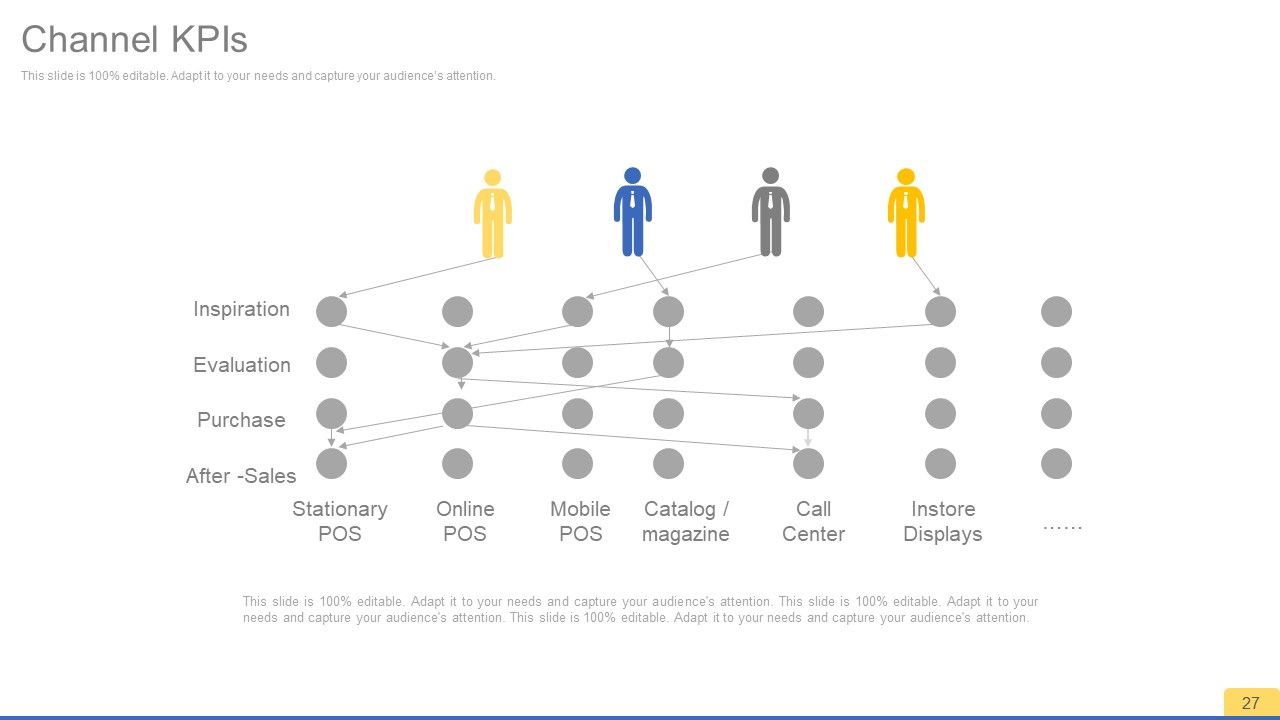
Slide 27: This slide showcases Channel KPIs displaying- Inspiration, Evaluation, Purchase, After -Sales, Stationary POS, Online POS, Mobile POS, Catalog / magazine, Call Center, Instore Displays.
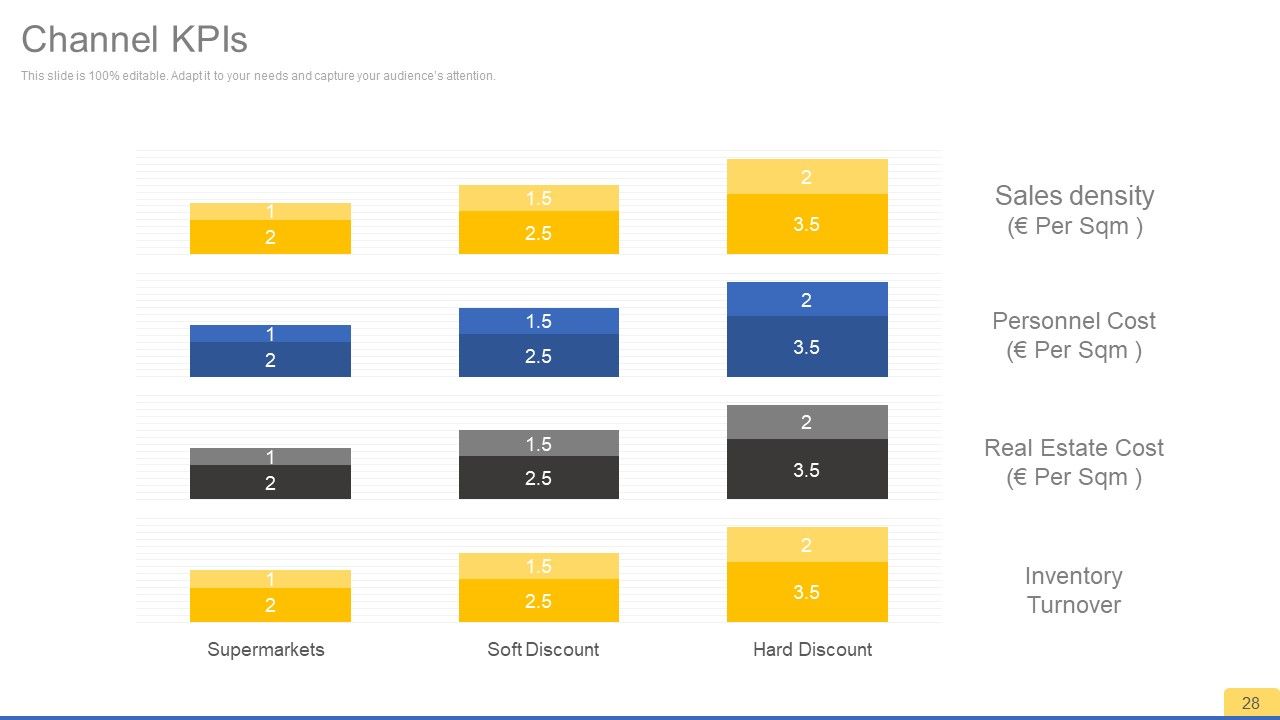
Slide 28: This slide shows Channel KPIs displaying- Sales density (€ Per Sqm ), Personnel Cost (€ Per Sqm ), Real Estate Cost (€ Per Sqm ), Inventory Turnover, Supermarkets, Soft Discount, Hard Discount.
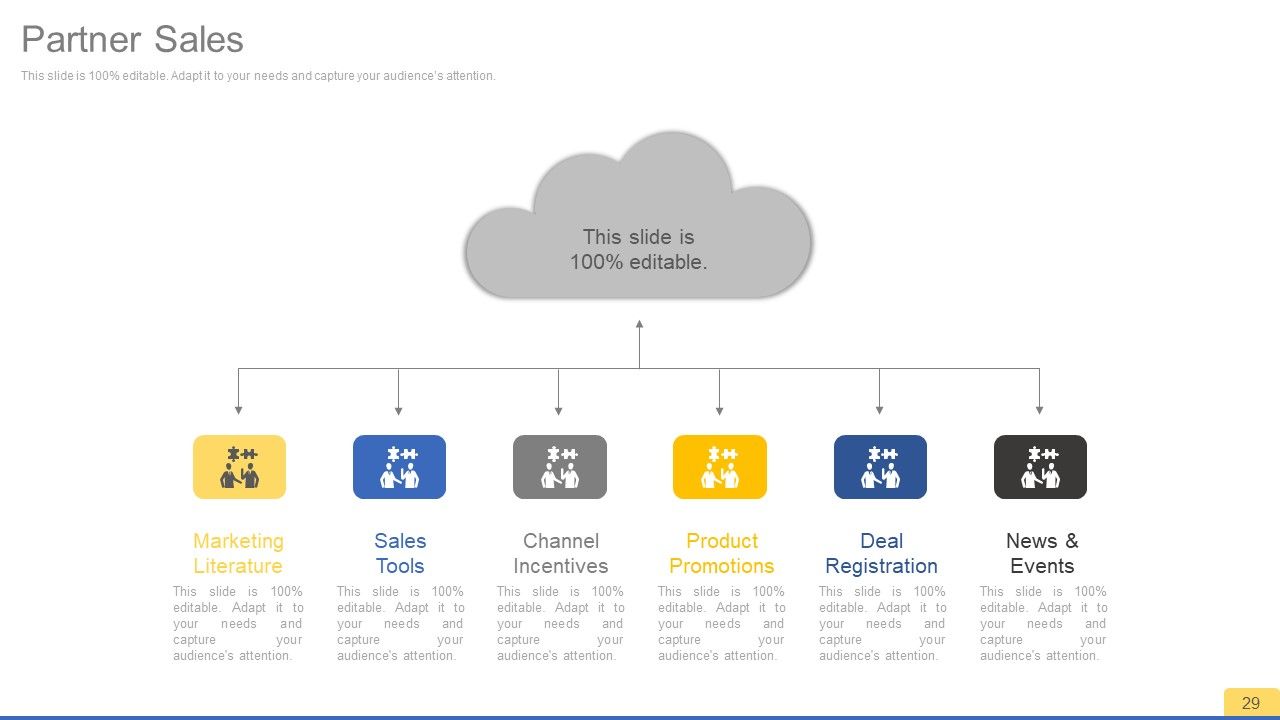
Slide 29: This slide shows Partner Sales showcasing- Marketing, Literature, Sales, Tools, Channel Incentives, Product, Promotions, Deal Registration, News & Events.
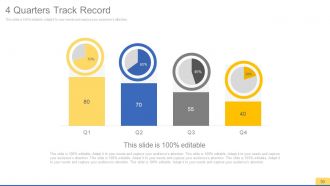
Slide 30: This slide showcases 4 Quarters Track Record.
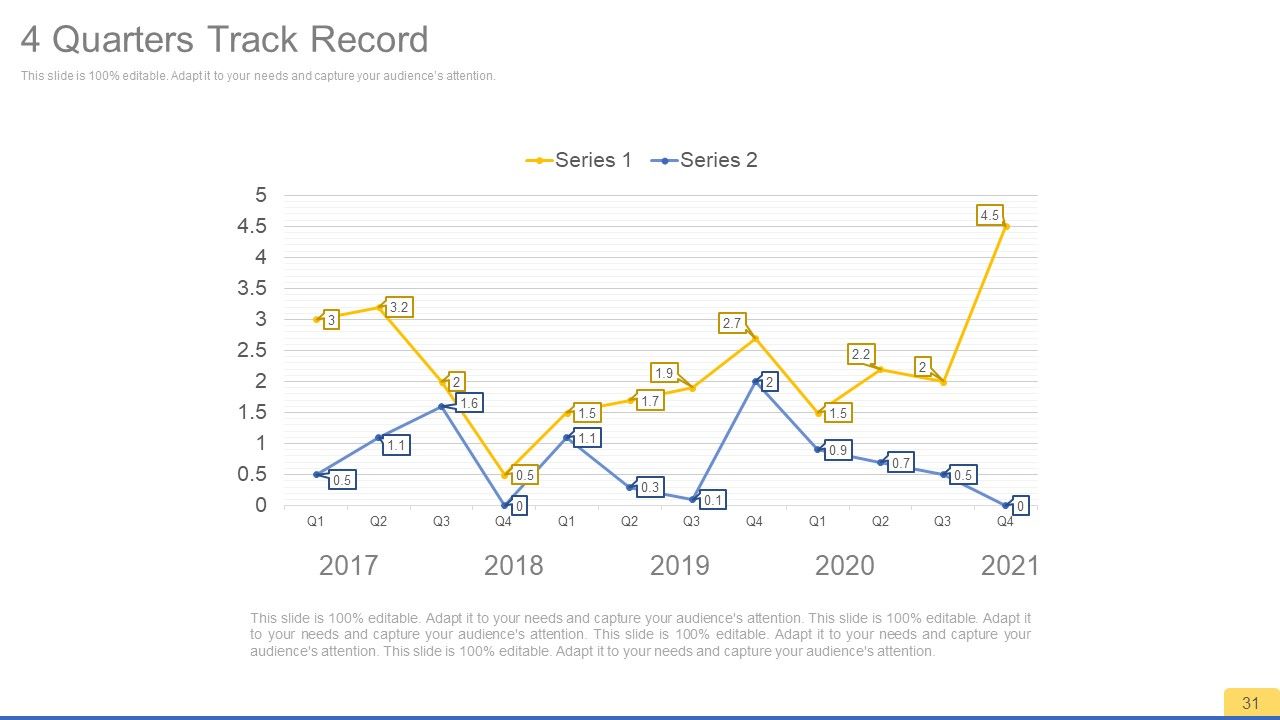
Slide 31: This slide showcases 4 Quarters Track Record in graph form.
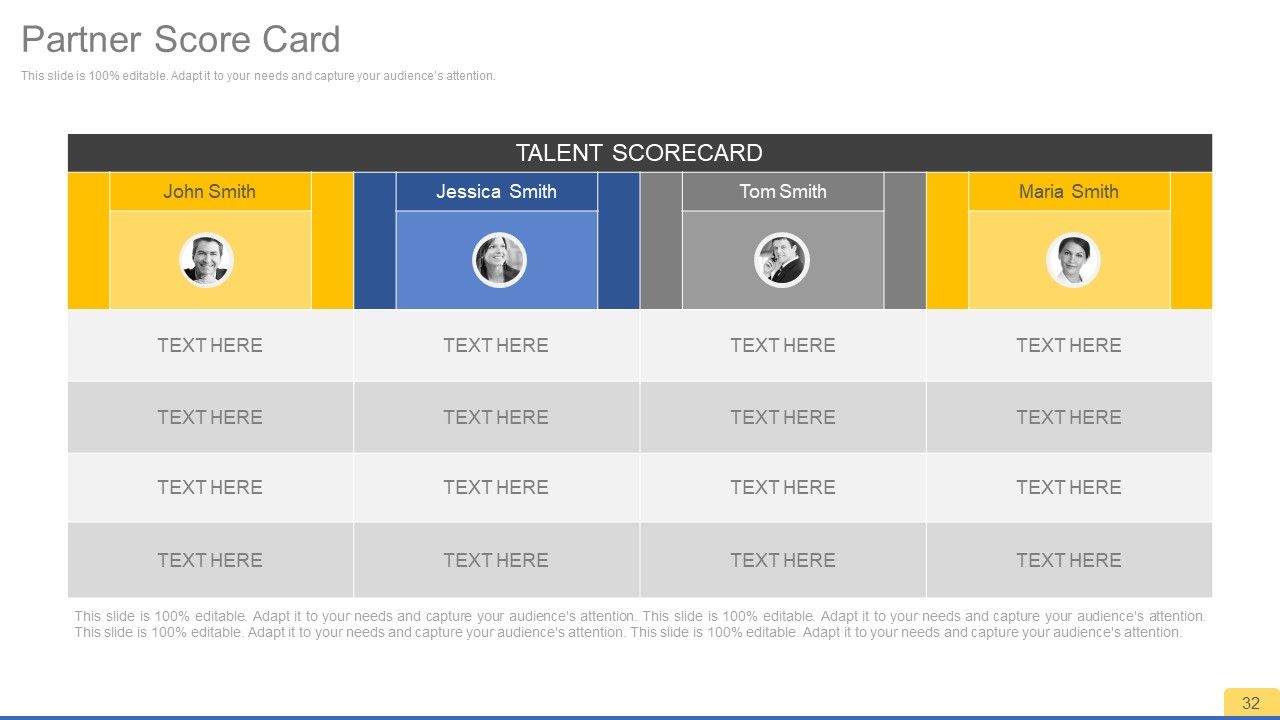
Slide 32: This is a Partner Score Card slide.
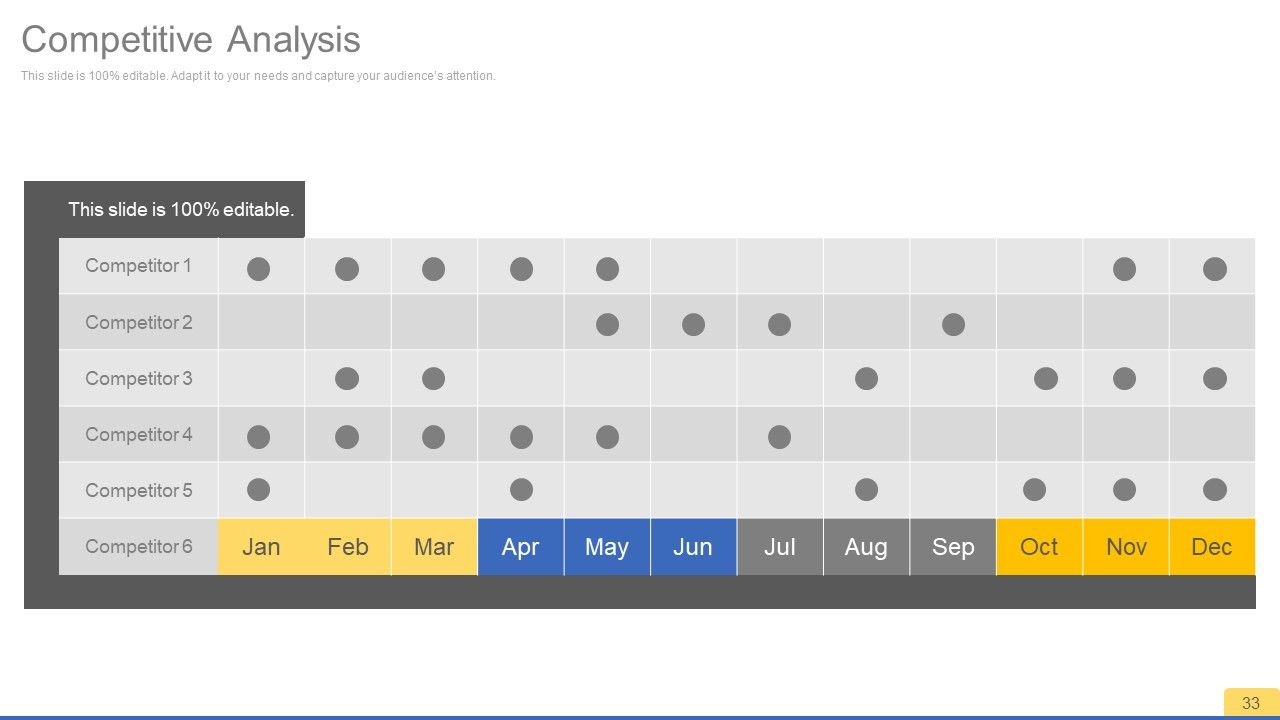
Slide 33: This is a Competitive Analysis table slide.
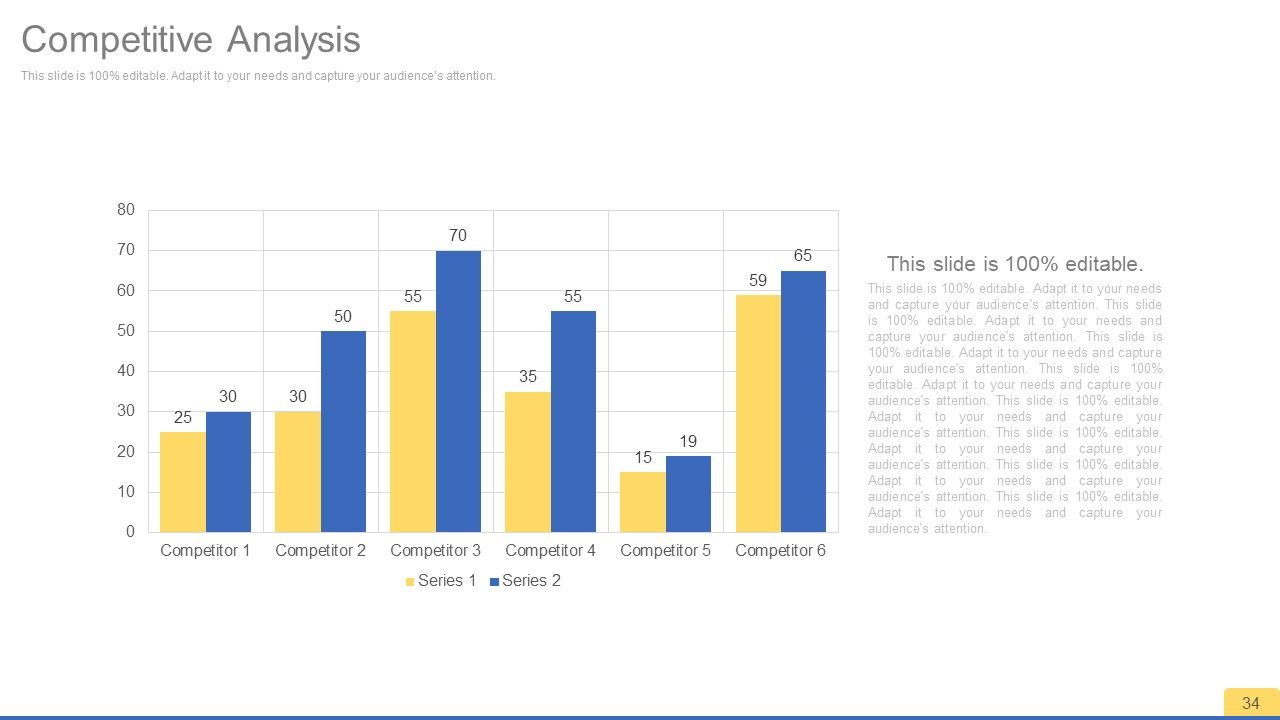
Slide 34: This is a Competitive Analysis bar graph slide
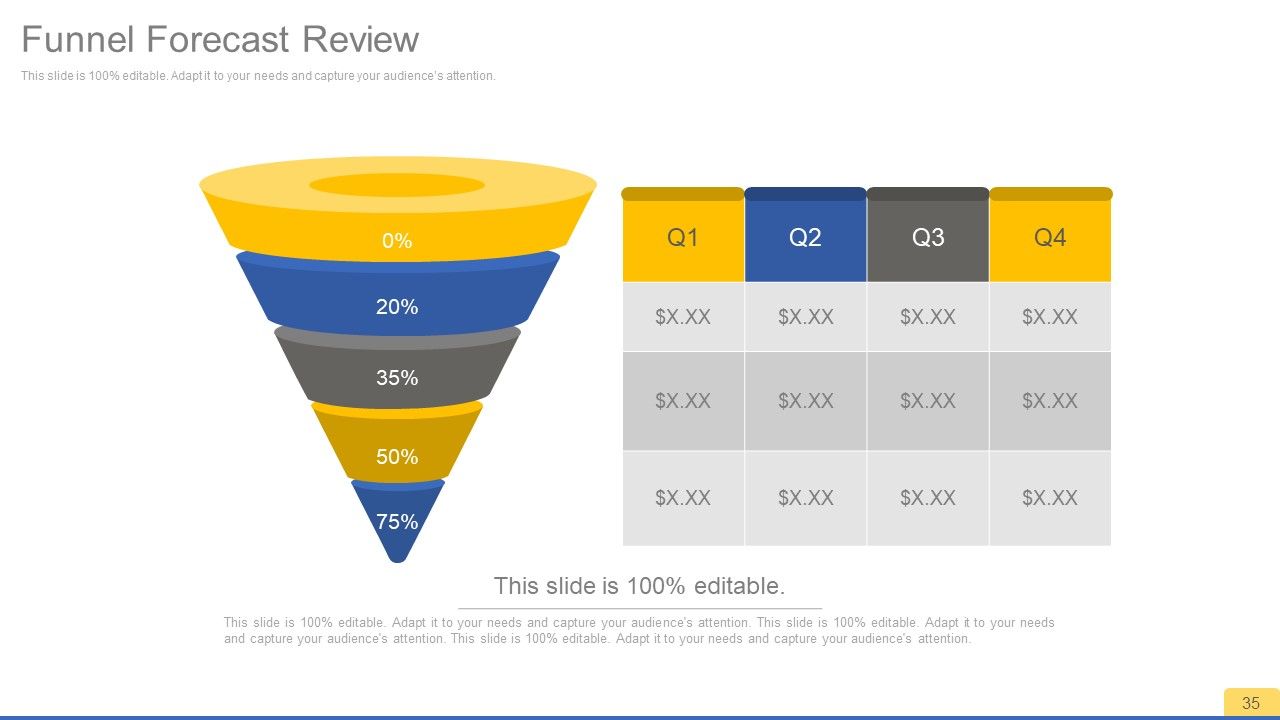
Slide 35: This slide presents Funnel Forecast Review to be displayed.
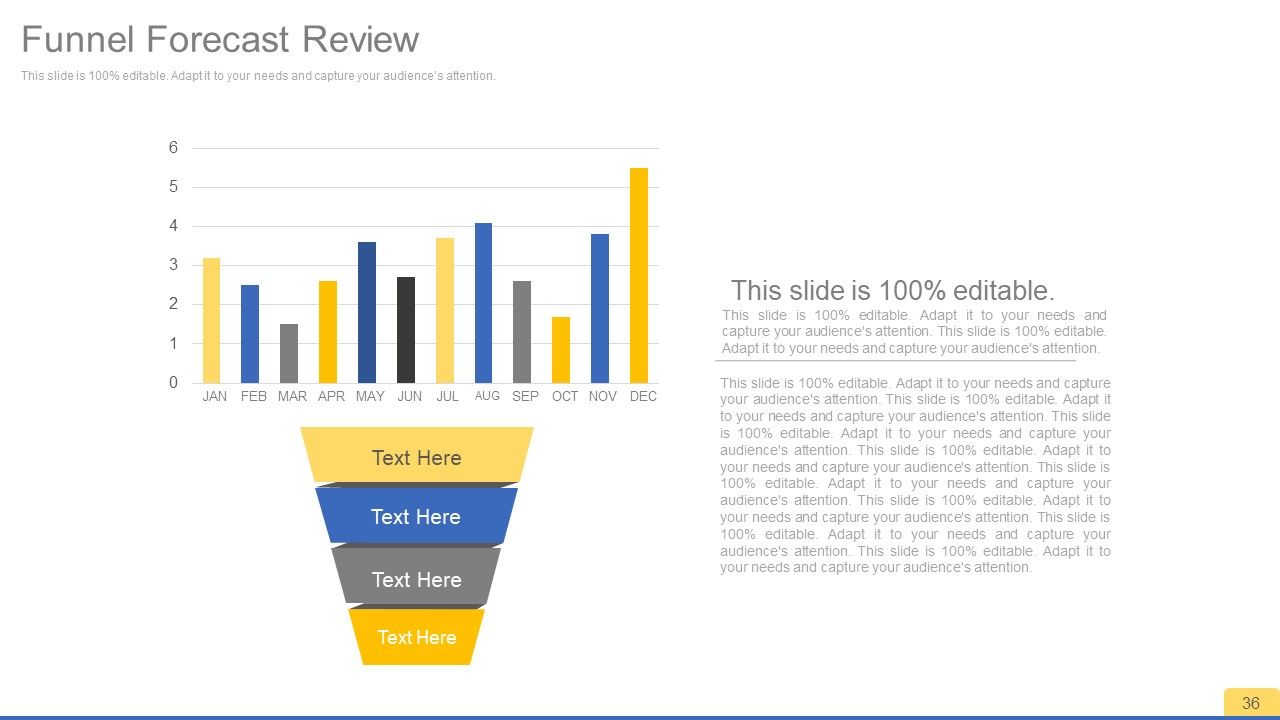
Slide 36: This slide also presents Funnel Forecast Review to be displayed.
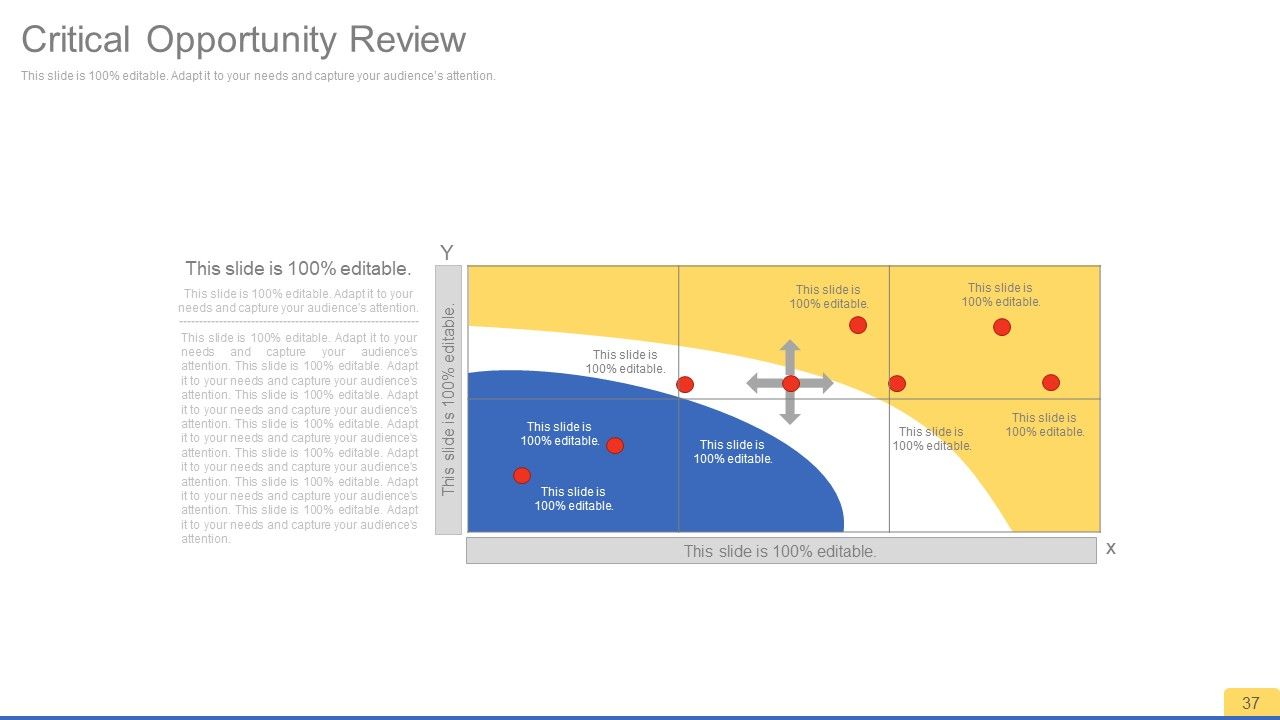
Slide 37: This slide shows Critical Opportunity Review in matrix form.
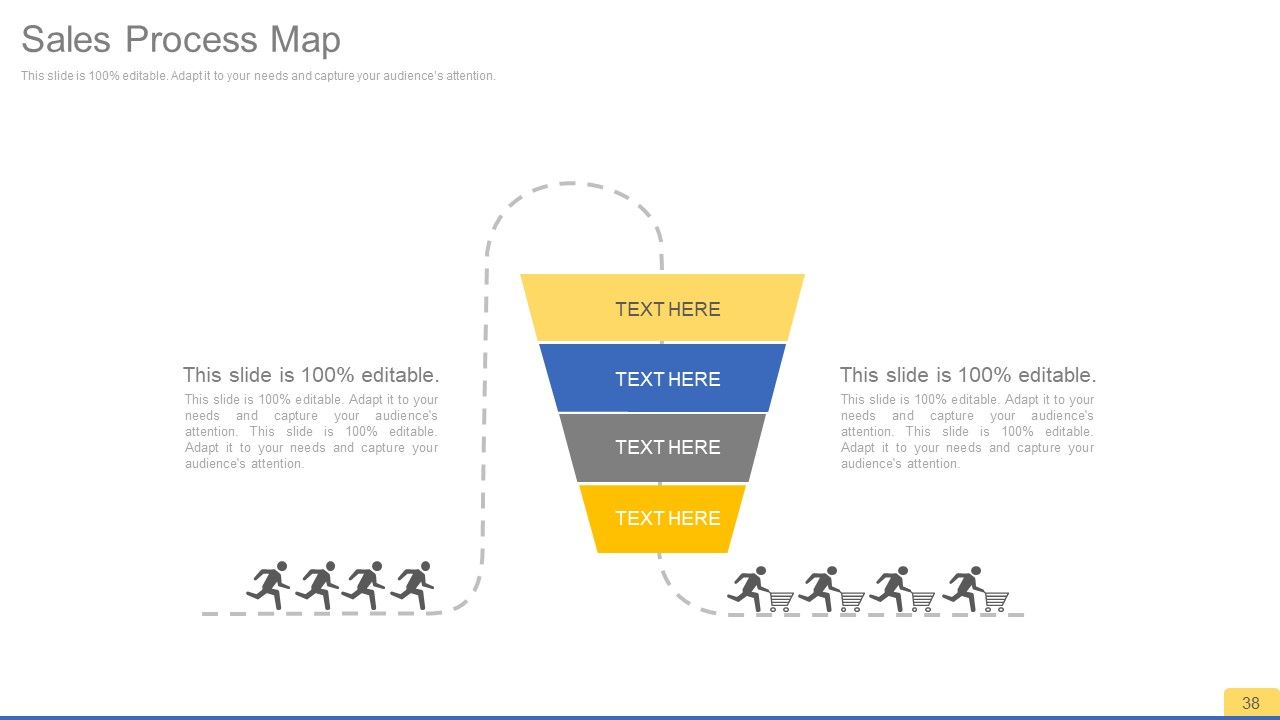
Slide 38: This slide showcases a Sales Process Map.
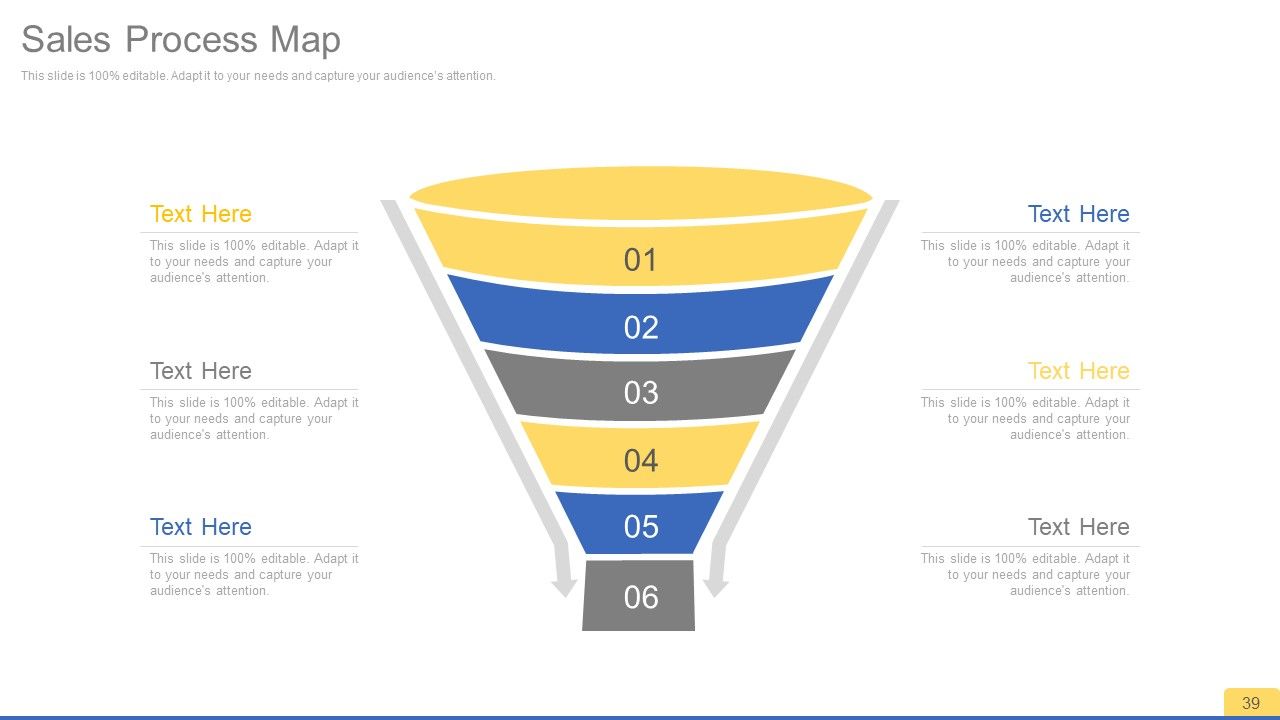
Slide 39:\ This slide also howcases a Sales Process Map in funnel form.
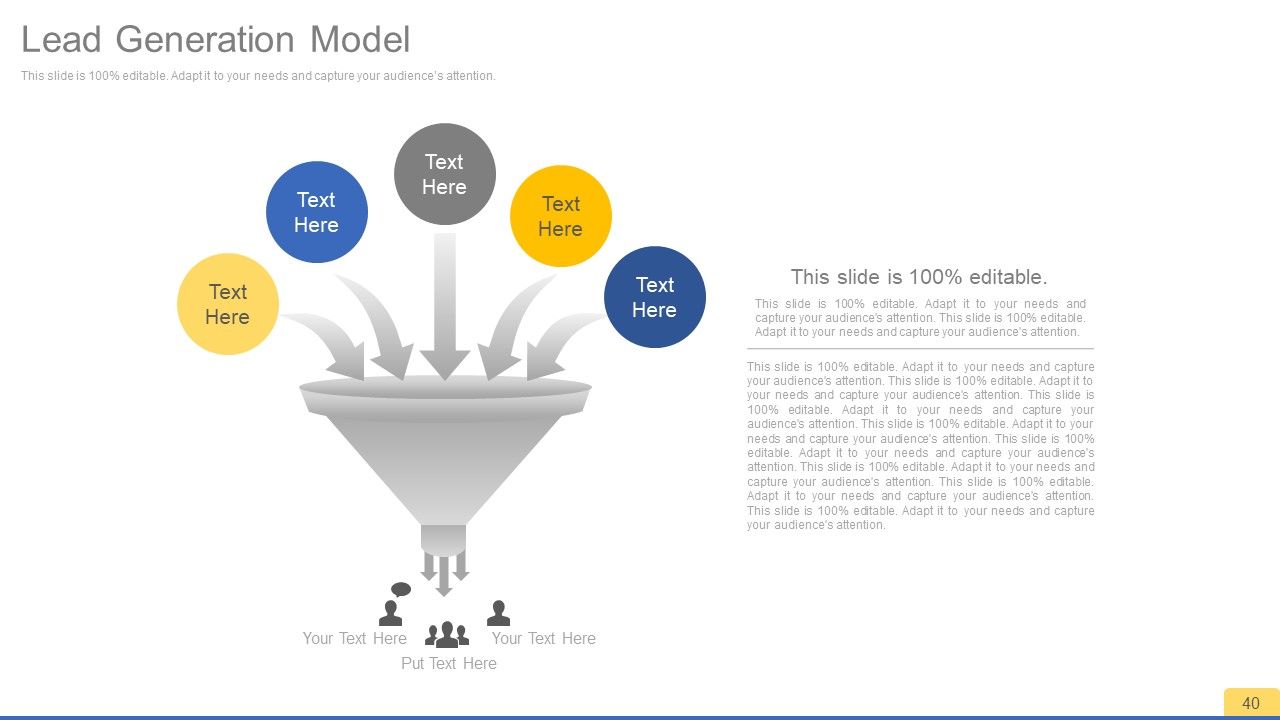
Slide 40: This slide presents a Lead Generation Model.
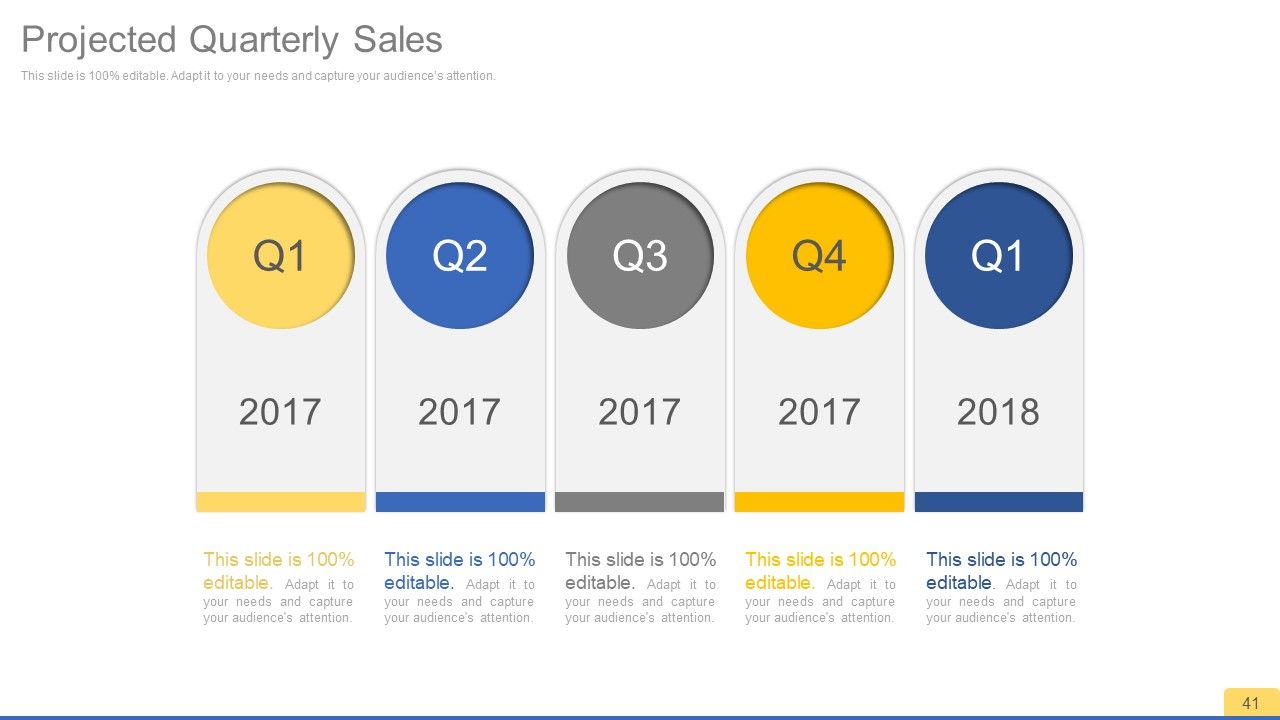
Slide 41: This slide showcases Projected Quarterly Sales.
Slide 42: This slide also showcases Projected Quarterly Sales.
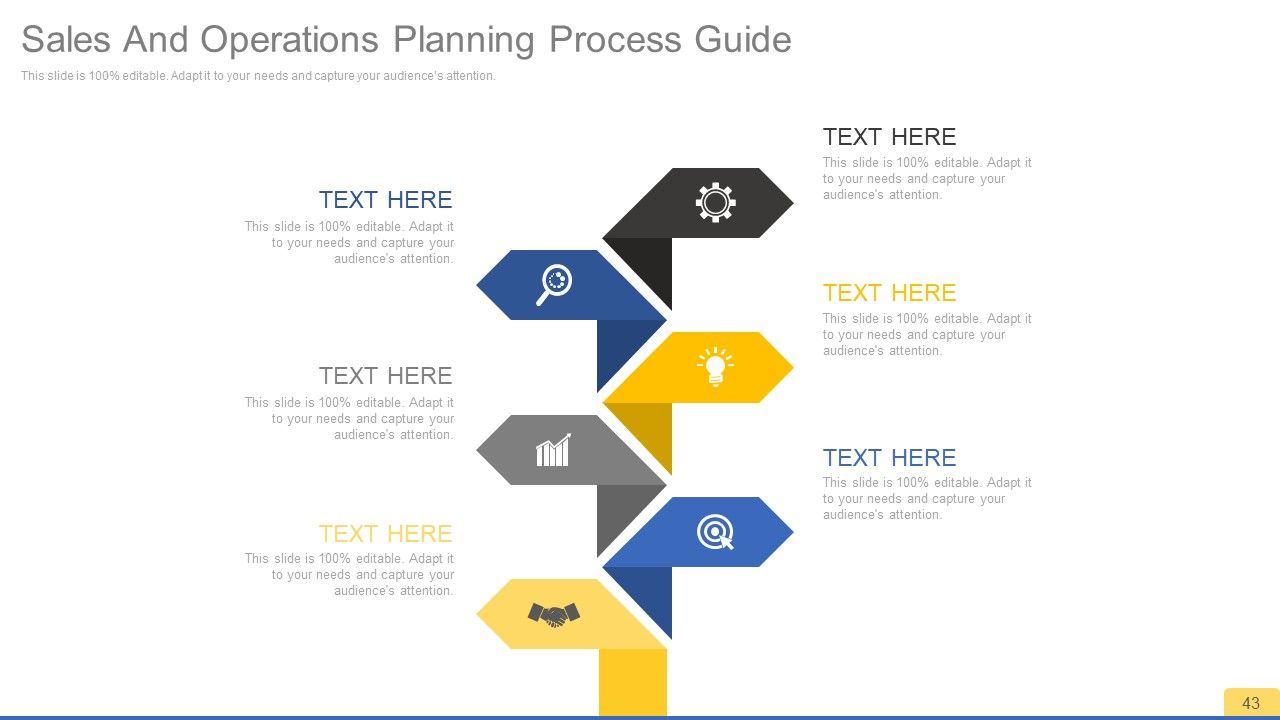
Slide 43: This slide presents Sales And Operations Planning Process Guide.
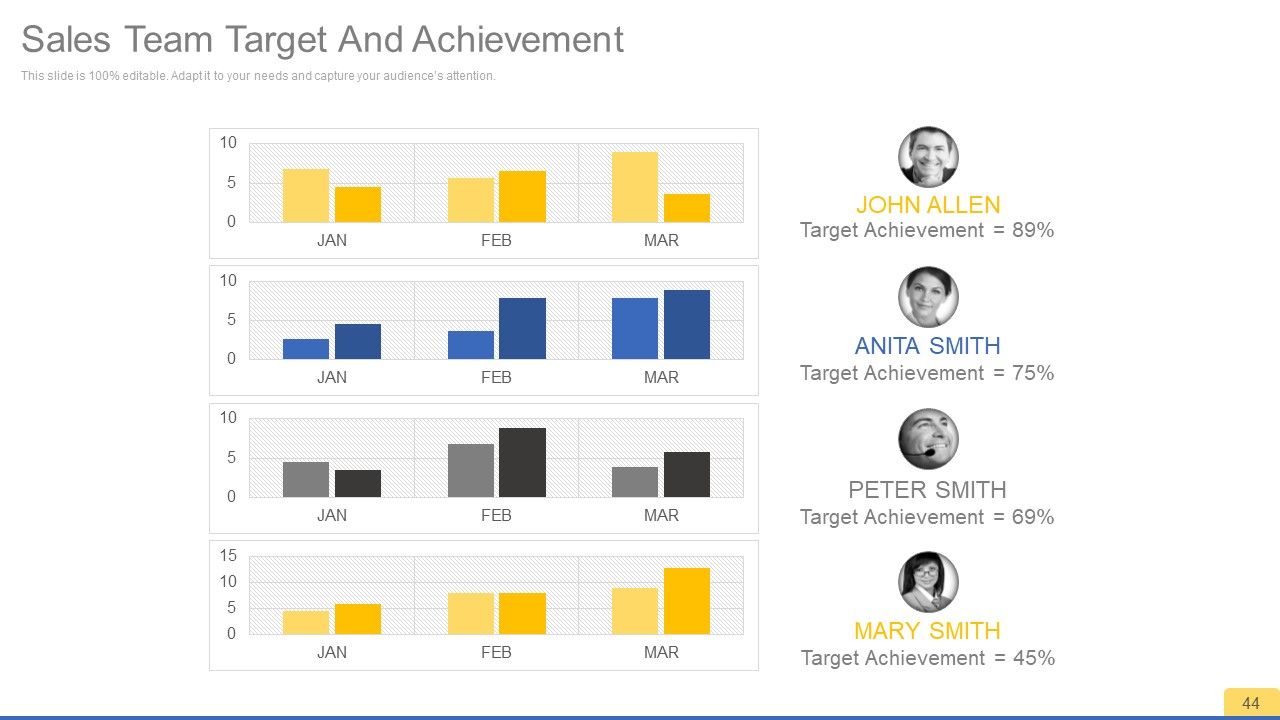
Slide 44: This slide presents Sales Team Target And Achievement in graph form.
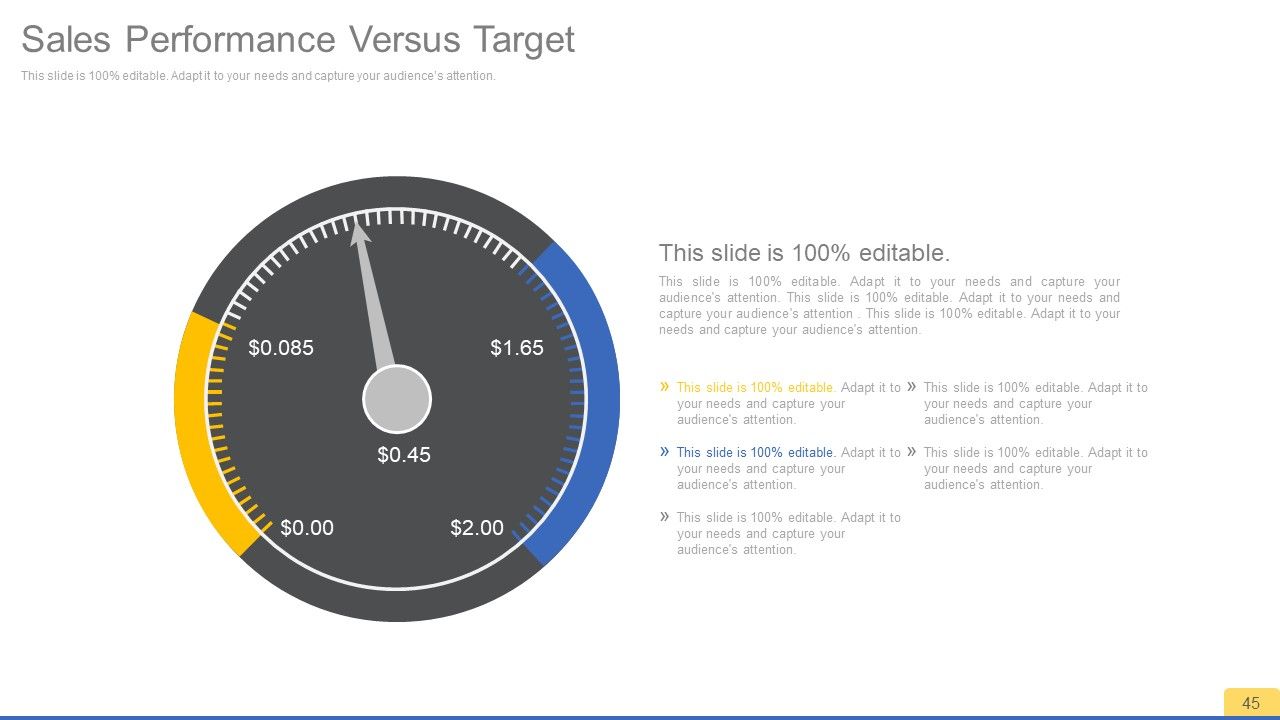
Slide 45: This slide showcases Sales Performance Versus Target in creative dashboard metric imagery.
Slide 46: This slide is titled Additional Slides. You may change the slide content as per your need.
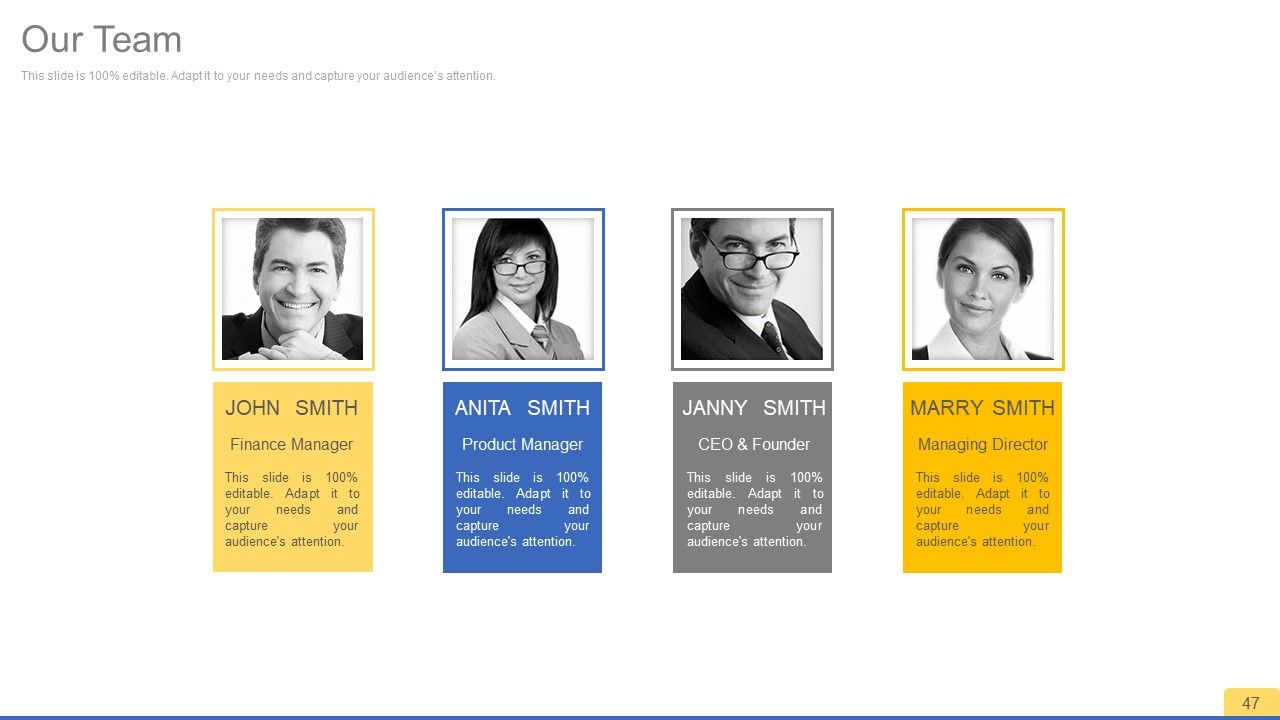
Slide 47: This slide shows Our Team with image boxes to fill information.
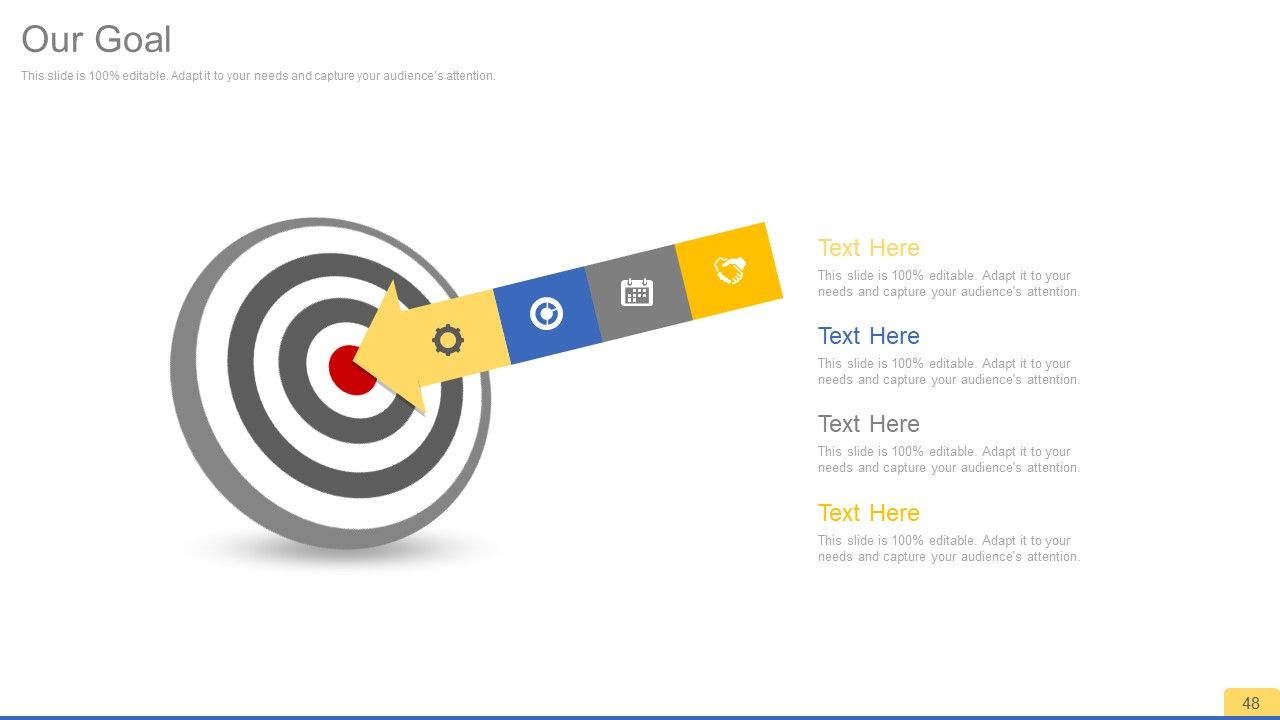
Slide 48: This is Our Goal slide. State goals etc. here.
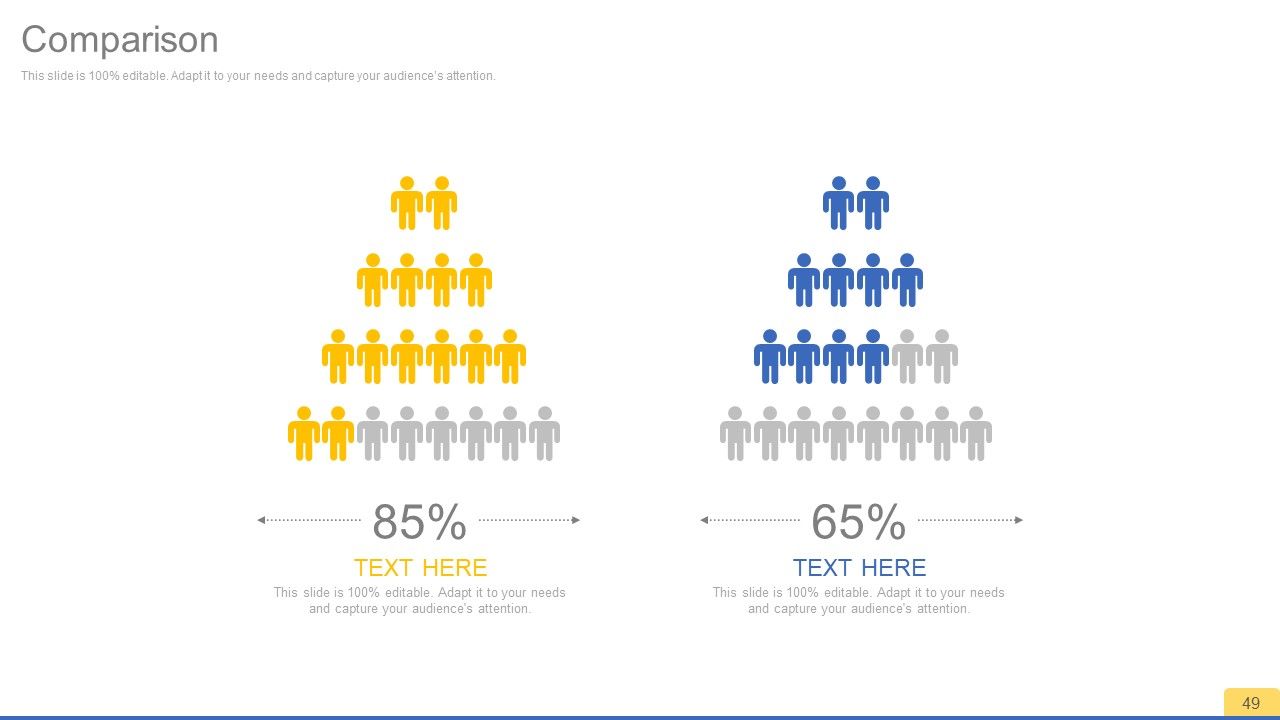
Slide 49: This slide shows Comparison in a creative manner displaying male and female imagery. State comparing aspects here.
Slide 50: This is a Dashboard slide to display metrics, kpis, etc.
Slide 51: This is a Timeline slide to show growth, evolution, journey etc.
Slide 52: This is a Target With Arrow image slide to show targets, plans etc.
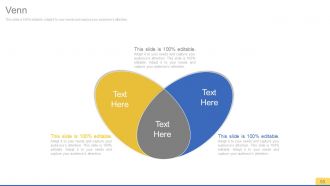
Slide 53: This is a Venn diagram image slide to show information, specifications etc.
Slide 54: This is a Mind map image slide to show information, specifications etc.
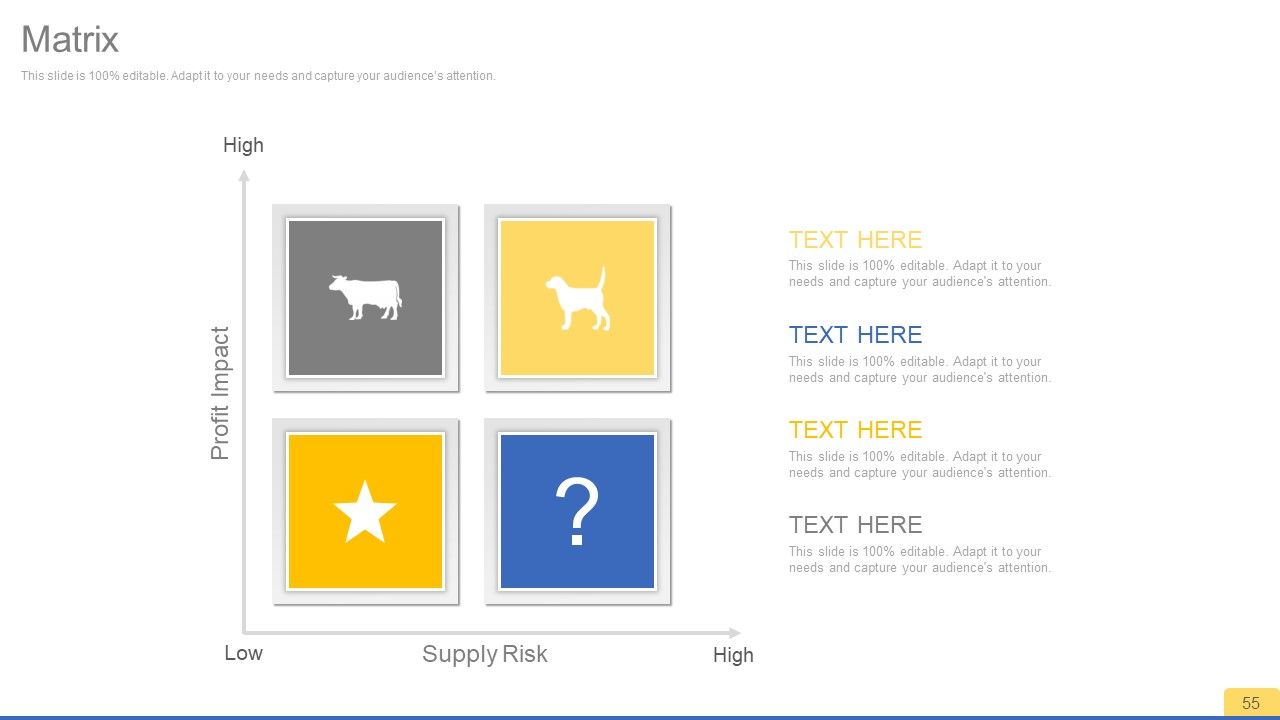
Slide 55: This is a Matrix slide to show information, specifications etc.
Slide 56: This is a Bulb or Idea image slide to show information, innovation, specifications etc.
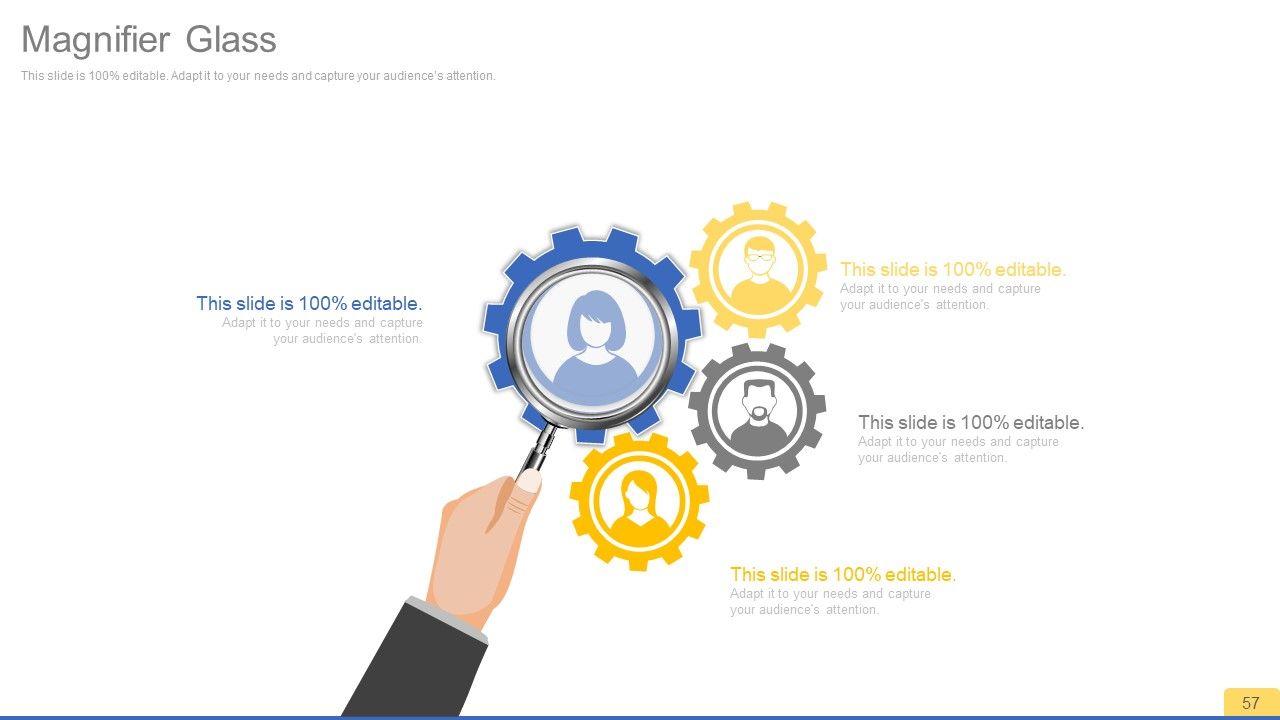
Slide 57: This slide shows a Magnifier glass image with text boxes. State information etc. here.
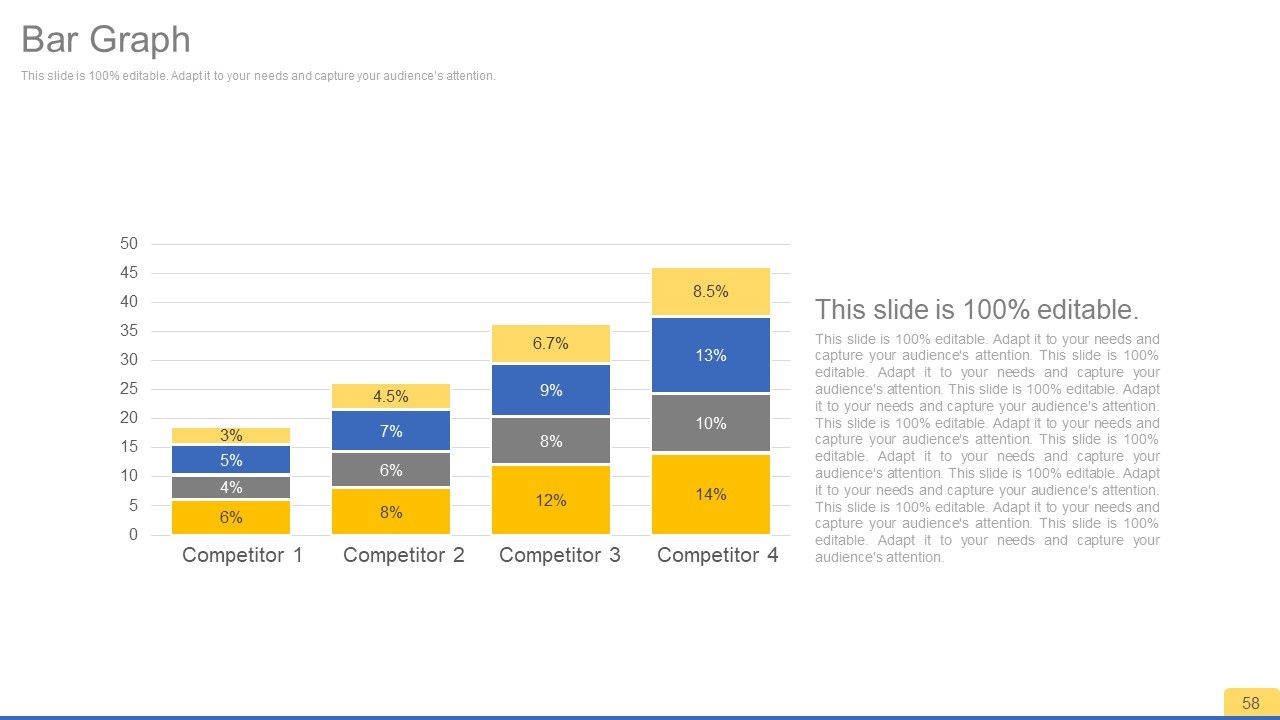
Slide 58: This slide presents a Bar Graph for two product/entity comparison, information, specifications etc.
Slide 59: This is a Thanks For Watching slide with Address# street number, city, state, Contact Numbers, Email Address.
Sales process improvement consulting powerpoint presentation with slides with all 59 slides:
Analyze business dynamics with our Sales Process Improvement Consulting Complete Powerpoint Deck With Slides. Establish conditions that create growth.
-
Qualitative and comprehensive slides.
-
Helpful product design for delivering presentation.


