Market segmentation strategy solutions powerpoint presentation with slides
Transform your next market segmentation strategy solutions PowerPoint slide deck into an example of great PPT. To further help you out here are few ideas to use this pre designed PPT example. With help of this PowerPoint show you can successfully explain the concept of market segmentation or customer segmentation to your team. In addition, our PPT model supports to emphasize different ways of segmenting customer groups for better alignment of products with prospective customers. Apart from this, by using our PPT sample file you can cast spotlight on advantages of market segmentation to exert pull on new customers for enhancing market share. Crux here is that a symbolic visual communication can be established to precisely penetrate market and reach customers with specific needs. This is certainly not the end, as by utilizing this pictorial symphony you can portray related concepts like categorizing, industry classification, target market, market research, competitor analysis, precision marketing etc. In short, this is a complete package of presentation images having everything you need to make a stunning communication.Bring down the hype with our Market Segmentation Strategy Solutions Complete Powerpoint Deck With Slides. Don't allow heightened expectations to build.
You must be logged in to download this presentation.
 Impress your
 audience
Editable
of Time
PowerPoint presentation slides
Ready to use deck having 58 high resolution presentation graphics . Best for strategy planners, business developers, sales and marketing professionals. No limited space. Vibrant color template themes. Innovative graphics and diagrams to explain various concepts. Editing option to modify presentation background color, layout and font. Works well with all software’s. Well supports Google slides.The stages in this process are demographic segmentation, geographic segmentation, behavioral segmentation, psychographic segmentation, segmentation variables.
People who downloaded this PowerPoint presentation also viewed the following :
Content of this Powerpoint Presentation
Slide 1: This slide introduces Segmentation, Targeting & Positioning Model. State Your Company Name and get started.
Slide 2: This is an Agenda slide. State your agendas here.
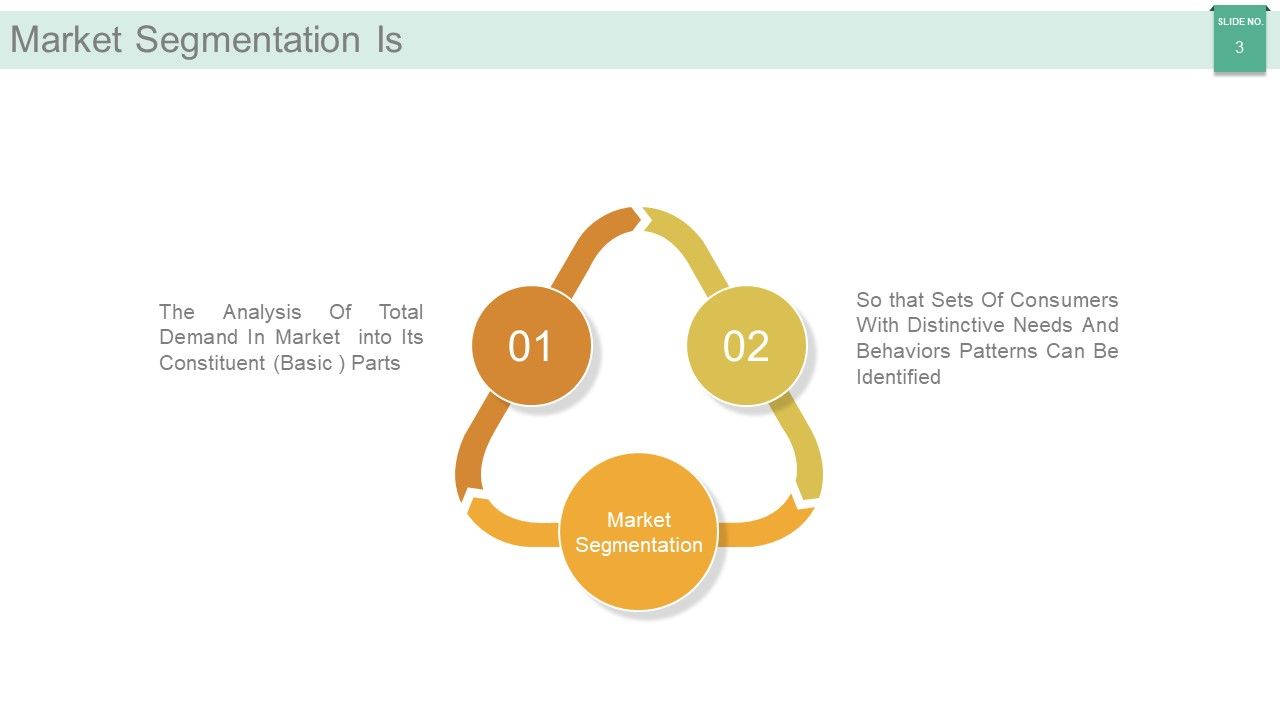
Slide 3: This slide defines what Market Segmentation Is in detail.
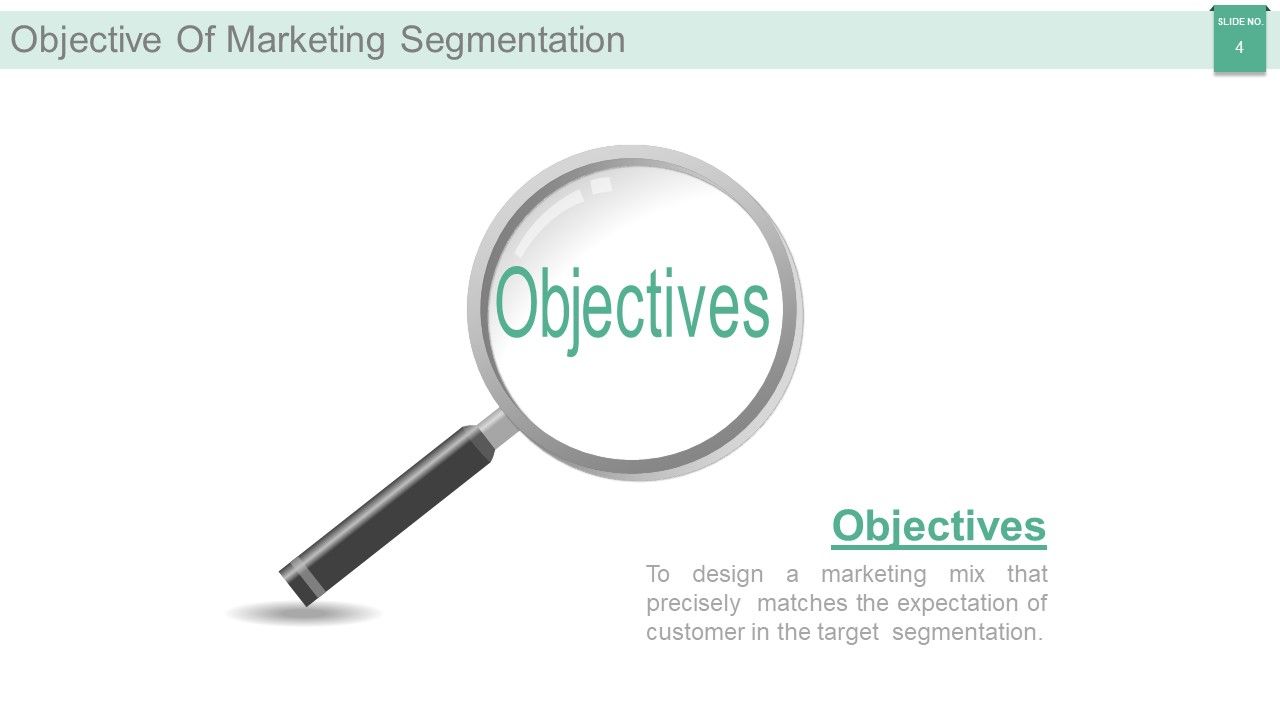
Slide 4: This slide showcases Objective Of Marketing Segmentation. State them here.
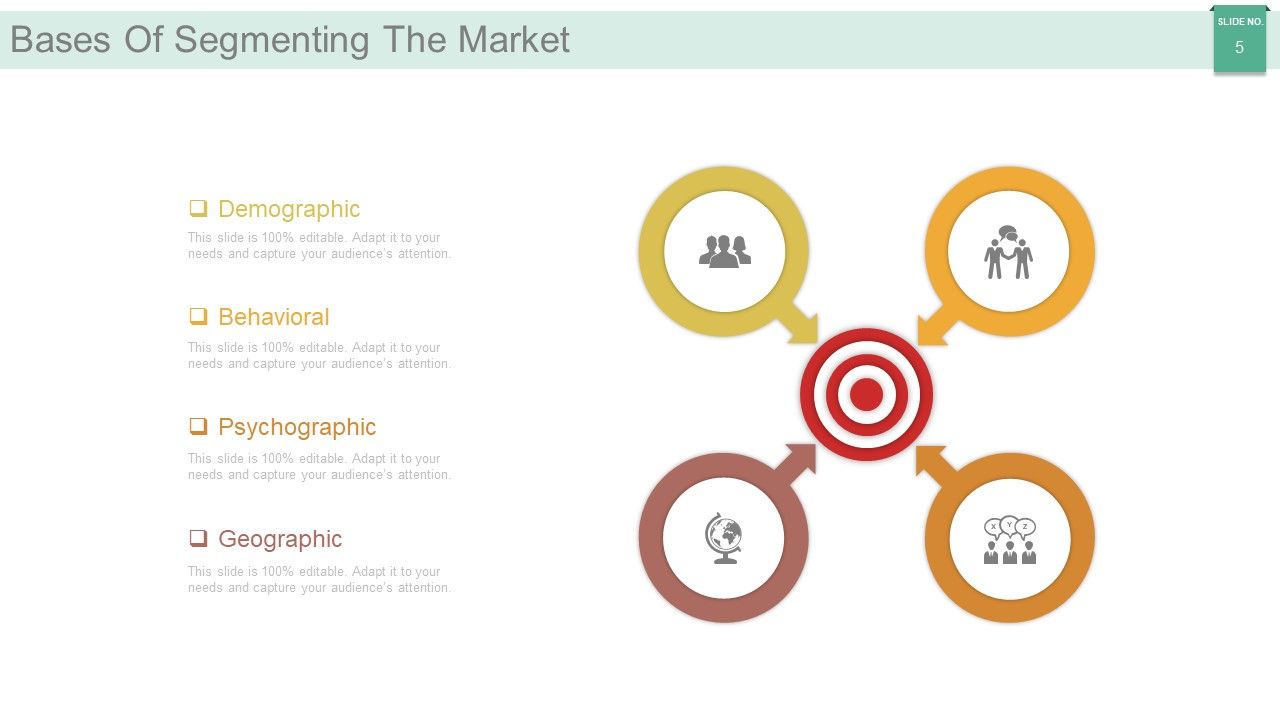
Slide 5: This slide showcases the Bases Of Segmenting The Market into- Demographic, Behavioral, Psychographic, Geographic.
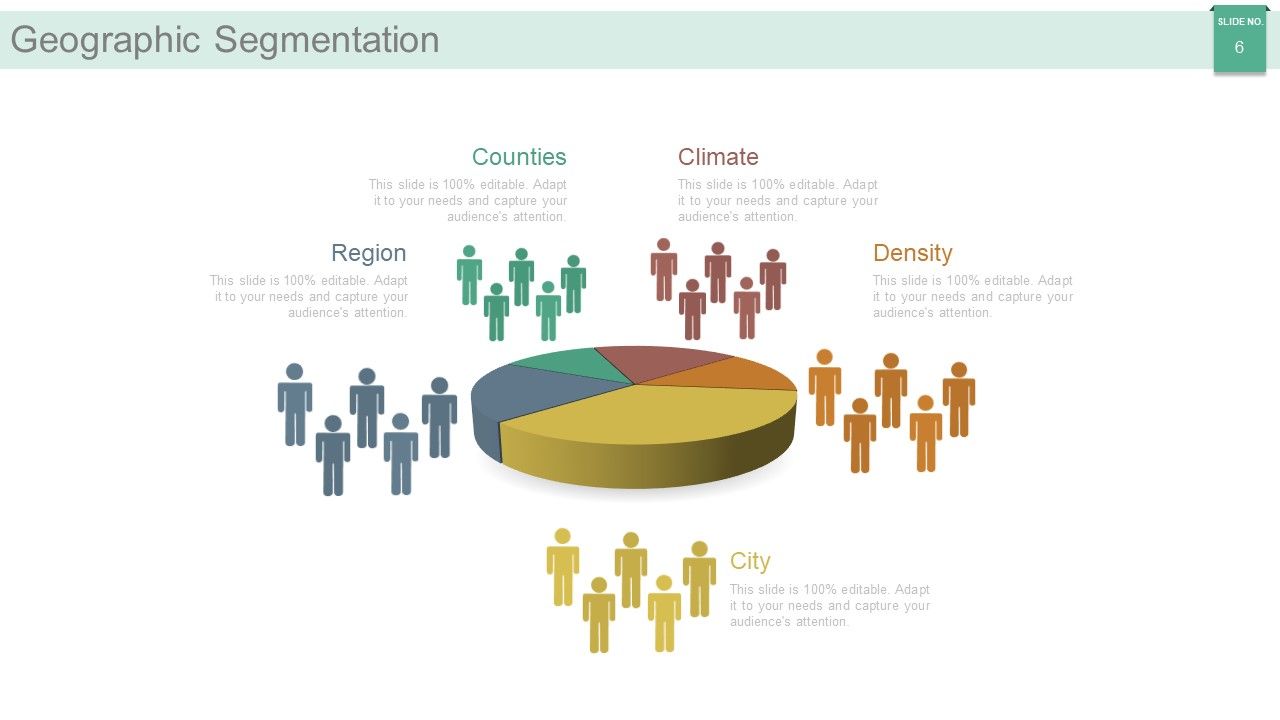
Slide 6: This slide shows Geographic Segmentation- Region, City, Density, Climate. State these aspects here.
Slide 7: This slide shows Demographic Segmentation- Age, Education, Family Size, Religion, Gender, Nationality, Income, Occupation. State these aspects here.
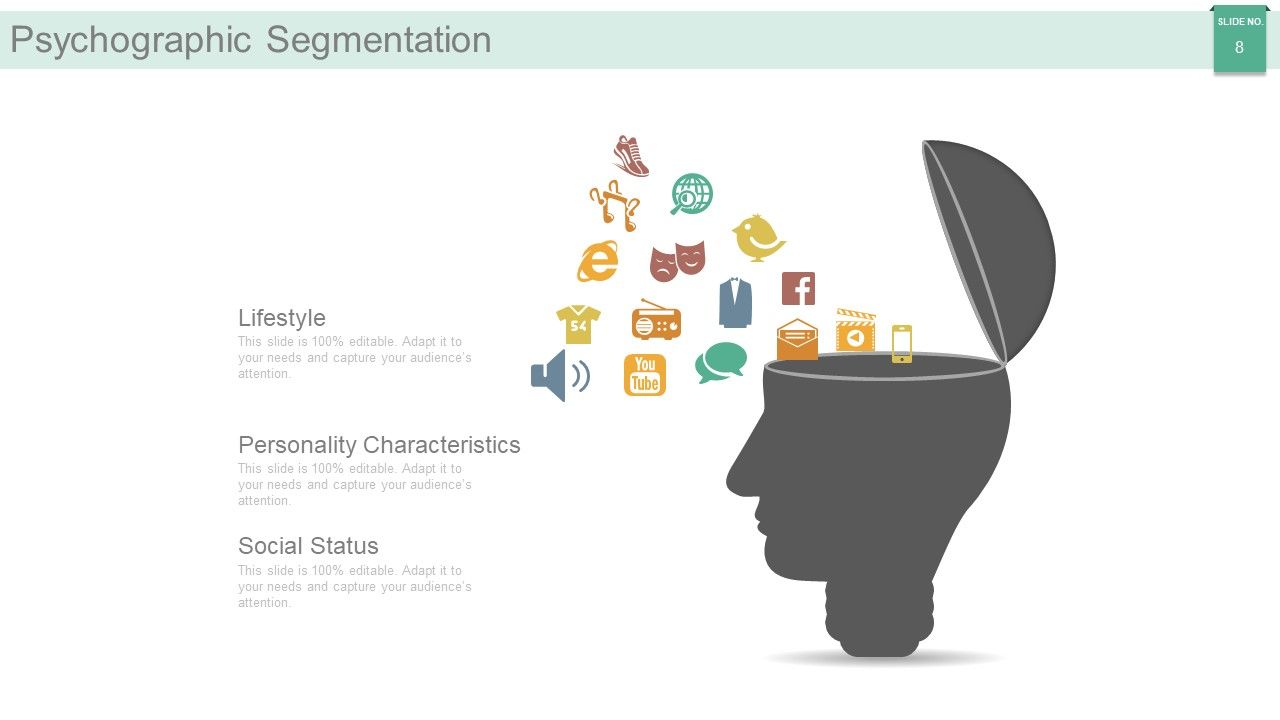
Slide 8: This slide shows Psychographic Segmentation- Lifestyle, Personality Characteristics, Social Status. State these aspects here.
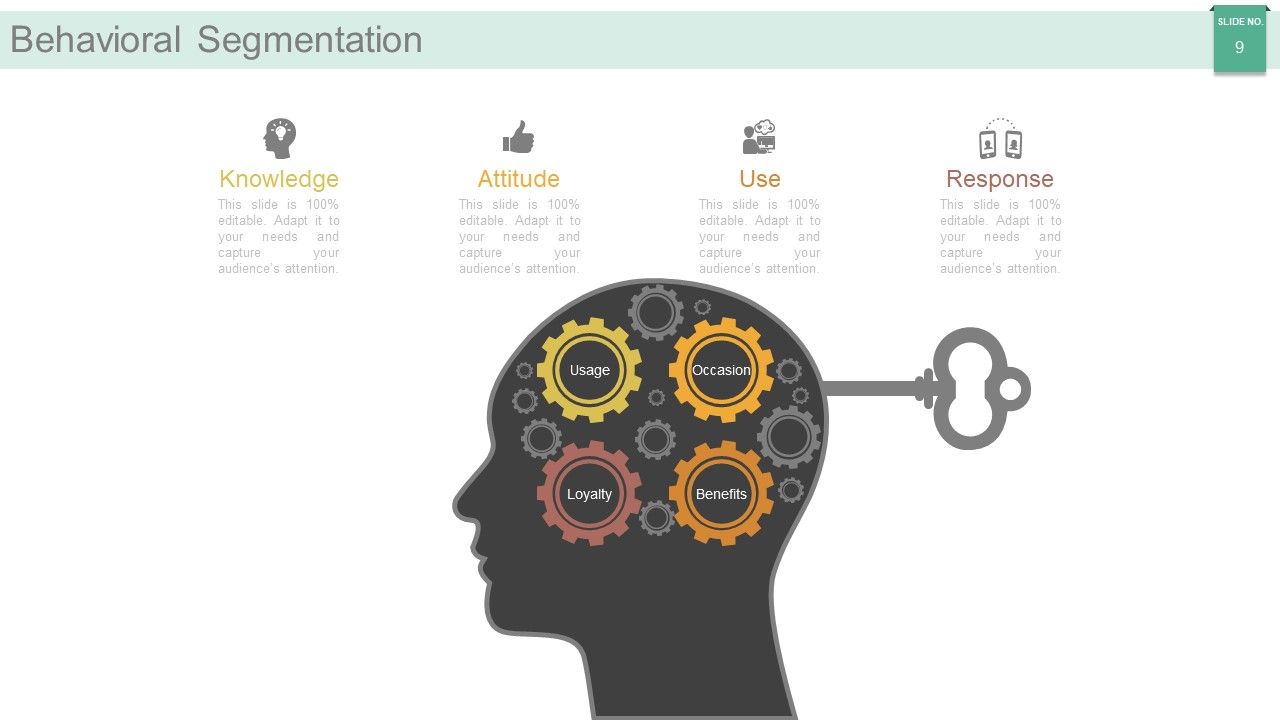
Slide 9: This slide shows Behavioral Segmentation Knowledge Attitude Use Response Usage Occasion Benefits. State these aspects here.
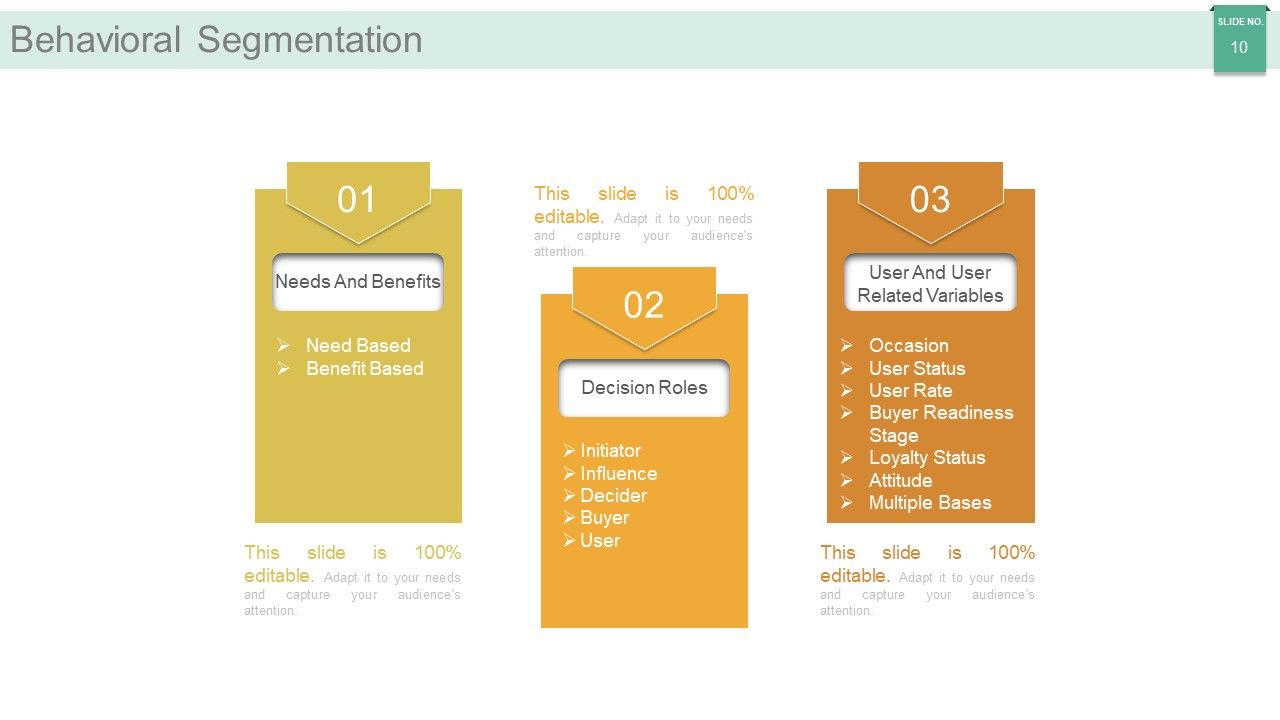
Slide 10: This slide presents Behavioral Segmentation showcasing- Needs And Benefits: Need Based, Benefit Based. Decision Roles: Initiator, Influence, Decider, Buyer, User. User And User Related Variables: Occasion, User Status, User Rate, Buyer Readiness Stage, Loyalty Status, Attitude Multiple Bases.
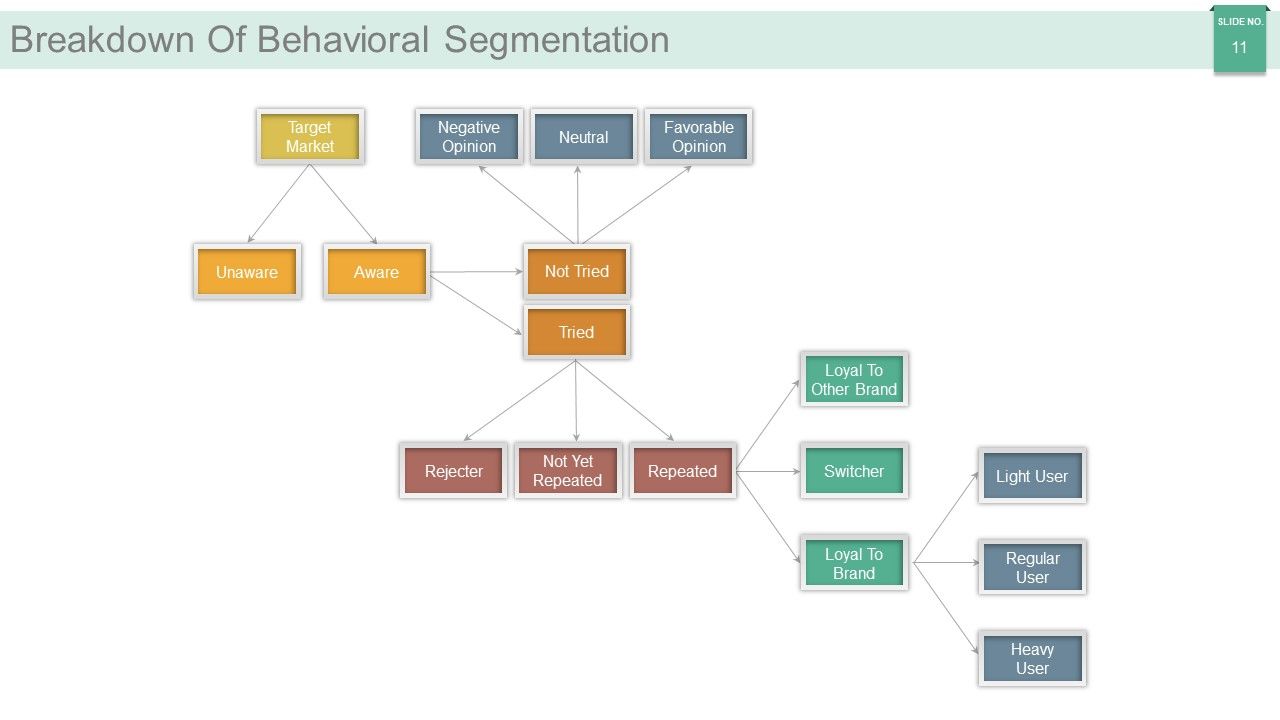
Slide 11: This slide presents Breakdown Of Behavioral Segmentation into- Unaware- Target Market-Aware- Not Tried: Tried: Negative Opinion, Neutral, Favorable Opinion, Rejecter, Not Yet Repeated, Repeated, Loyal To Other Brand, Switcher, Loyal To Brand, Light User, Regular User, Heavy User.
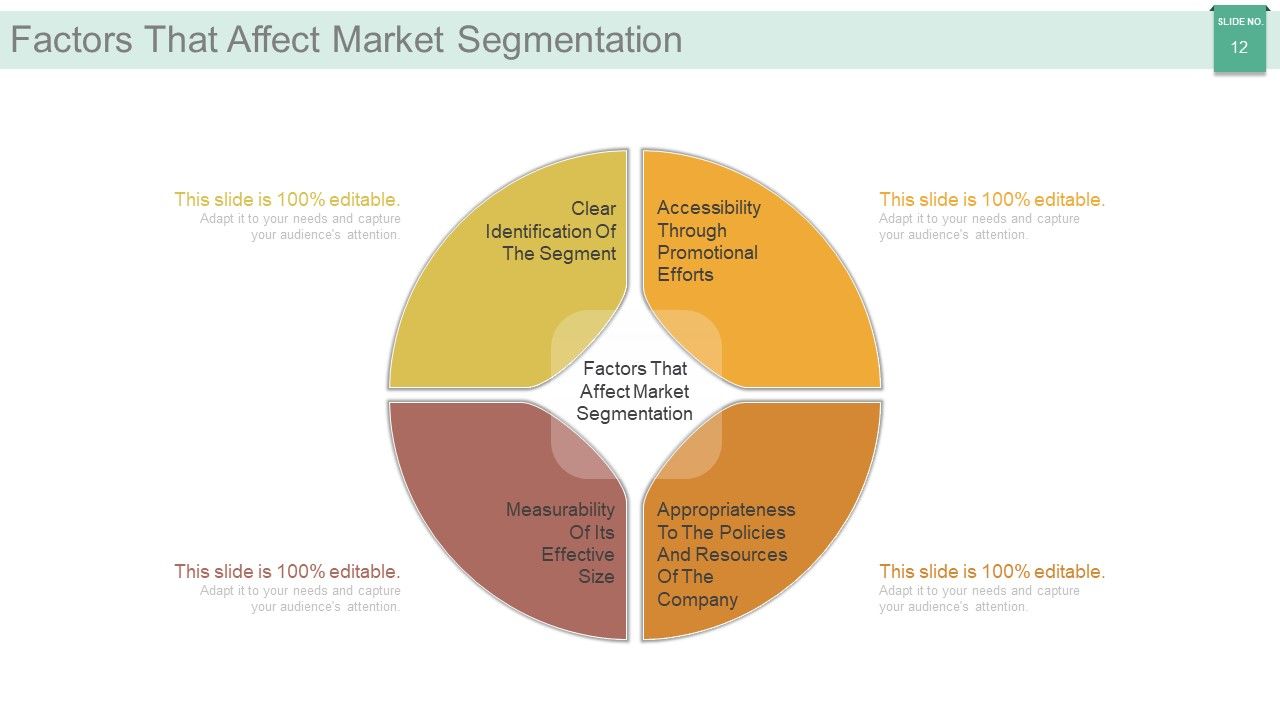
Slide 12: This slide presents Factors That Affect Market Segmentation- Appropriateness To The Policies And Resources Of The Company, Accessibility Through Promotional Efforts, Measurability Of Its Effective Size, Clear Identification Of The Segment, Factors That Affect Market Segmentation.
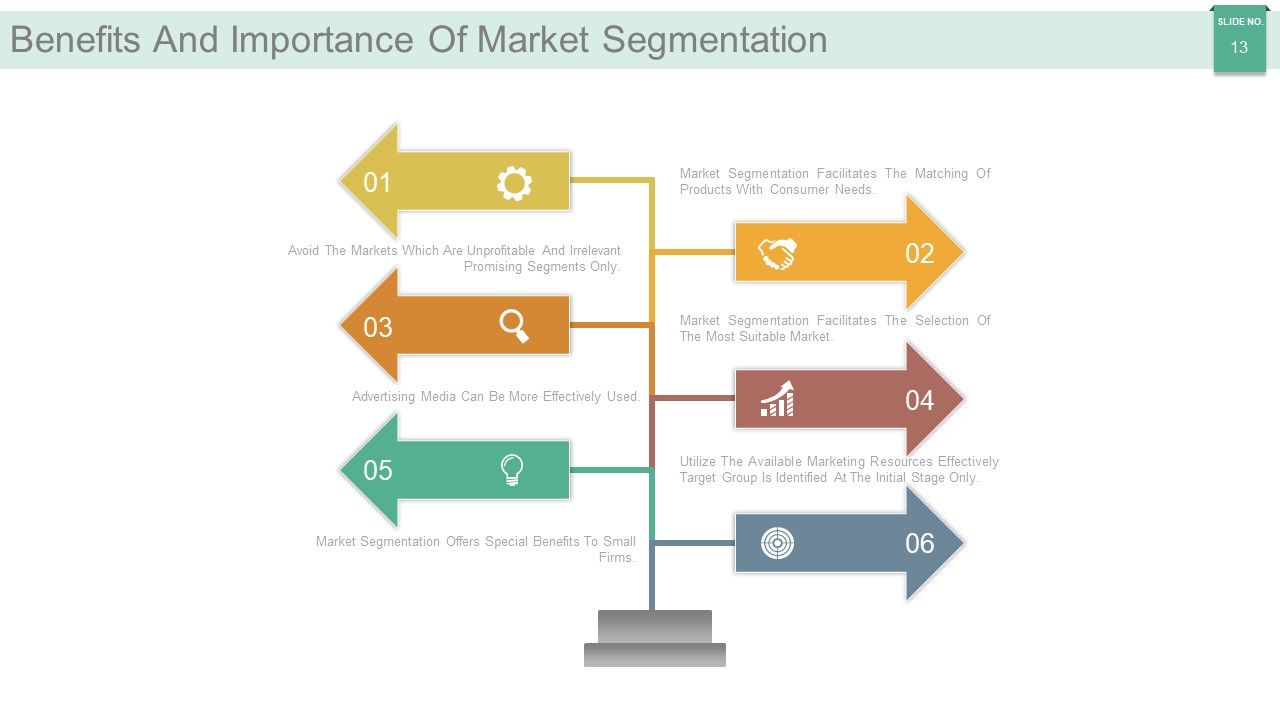
Slide 13: This slide presents Benefits And Importance Of Market Segmentation such as- Market Segmentation Facilitates The Matching Of Products With Consumer Needs, Market Segmentation Facilitates The Selection Of The Most Suitable Market, Utilize The Available Marketing Resources Effectively Target Group Is Identified At The Initial Stage Only, Avoid The Markets Which Are Unprofitable And Irrelevant Promising Segments Only, Advertising Media Can Be More Effectively Used, Market Segmentation Offers Special Benefits To Small Firms.
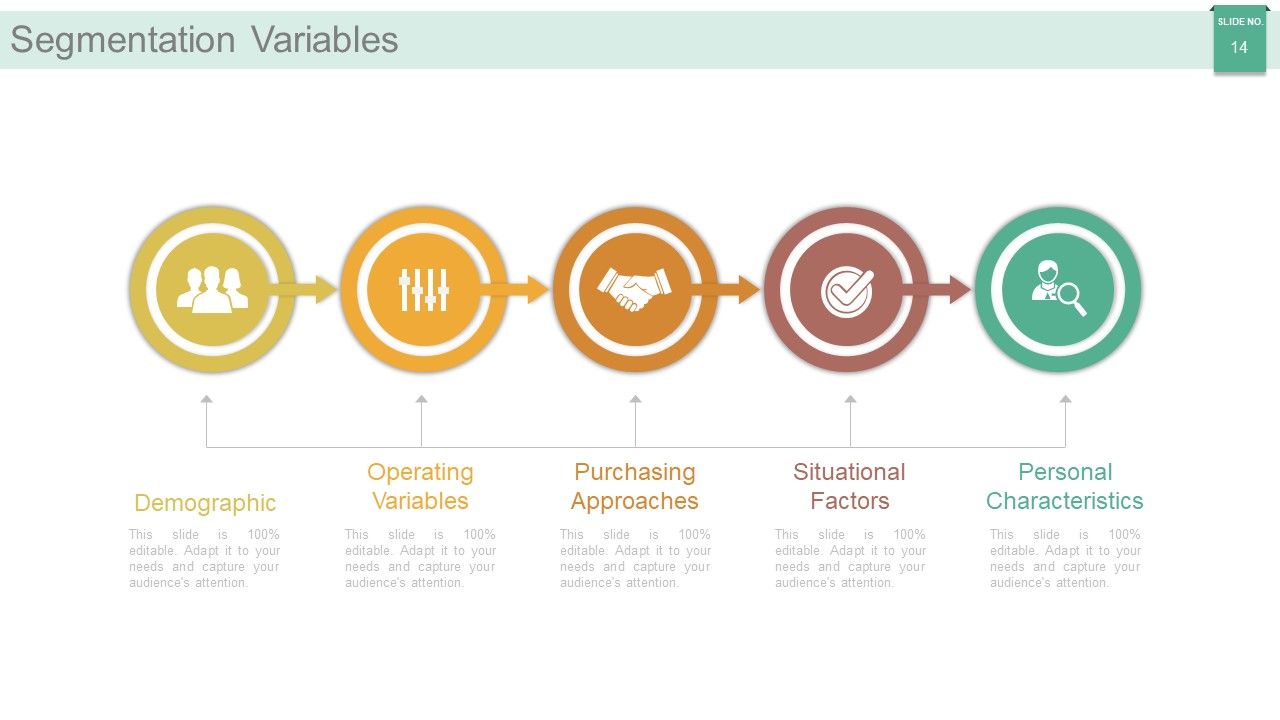
Slide 14: This slide showcases Segmentation Variables- Demographic, Purchasing Approaches, Personal Characteristics, Situational Factors, Operating Variables.
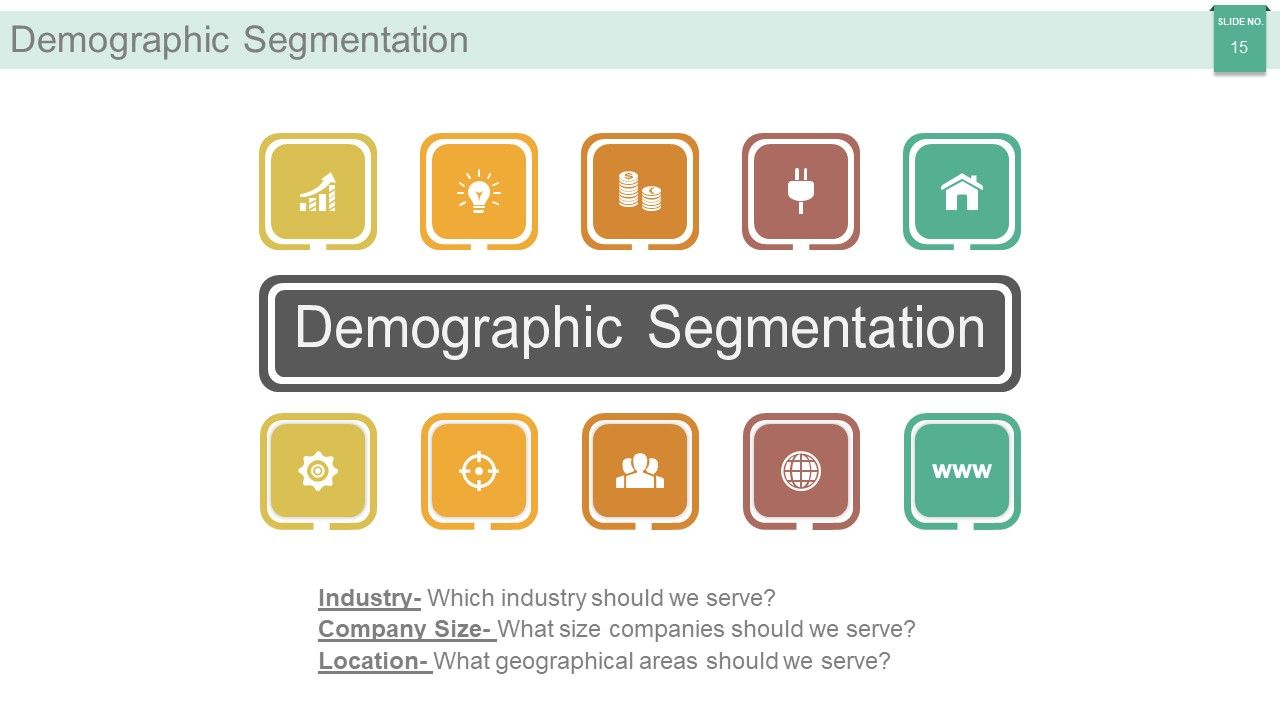
Slide 15: This slid shows Demographic Segmentation with- Industry- Which industry should we serve? Company size- What size companies should we serve? Location- What geographical areas should we serve?
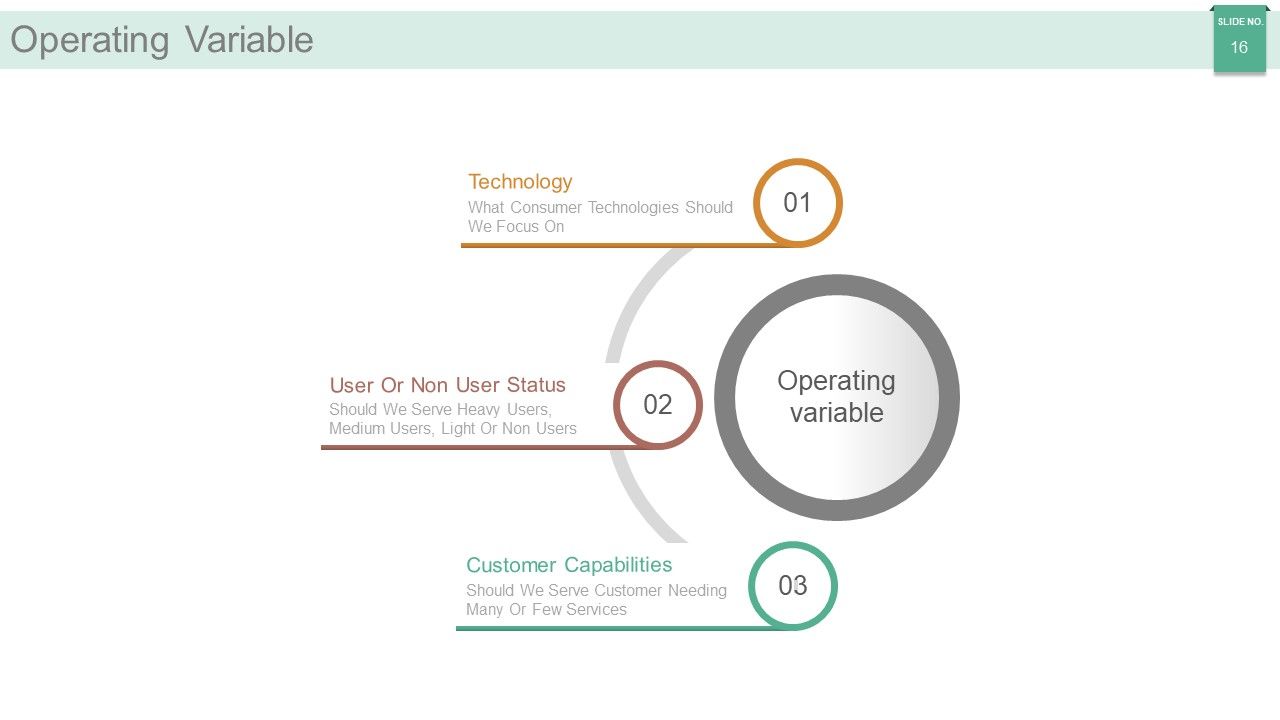
Slide 16: This slide displays Operating Variable in terms of Customer Capabilities: Should we serve customer needing many or few services? User Or Non User Status: Should we serve heavy users, medium users, light or non users? Technology: What consumer technologies should we focus on?
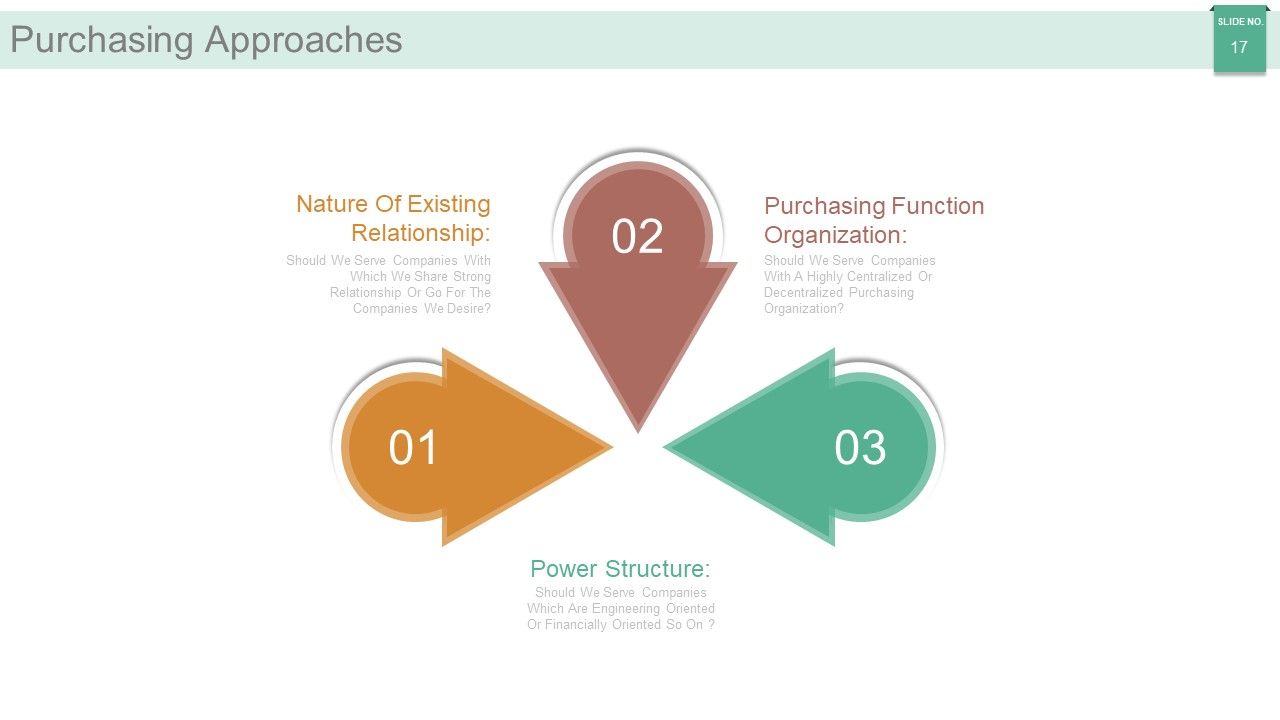
Slide 17: This slide shows Purchasing Approaches such as- Purchasing Function Organization, Nature Of Existing Relationship, Power Structure.
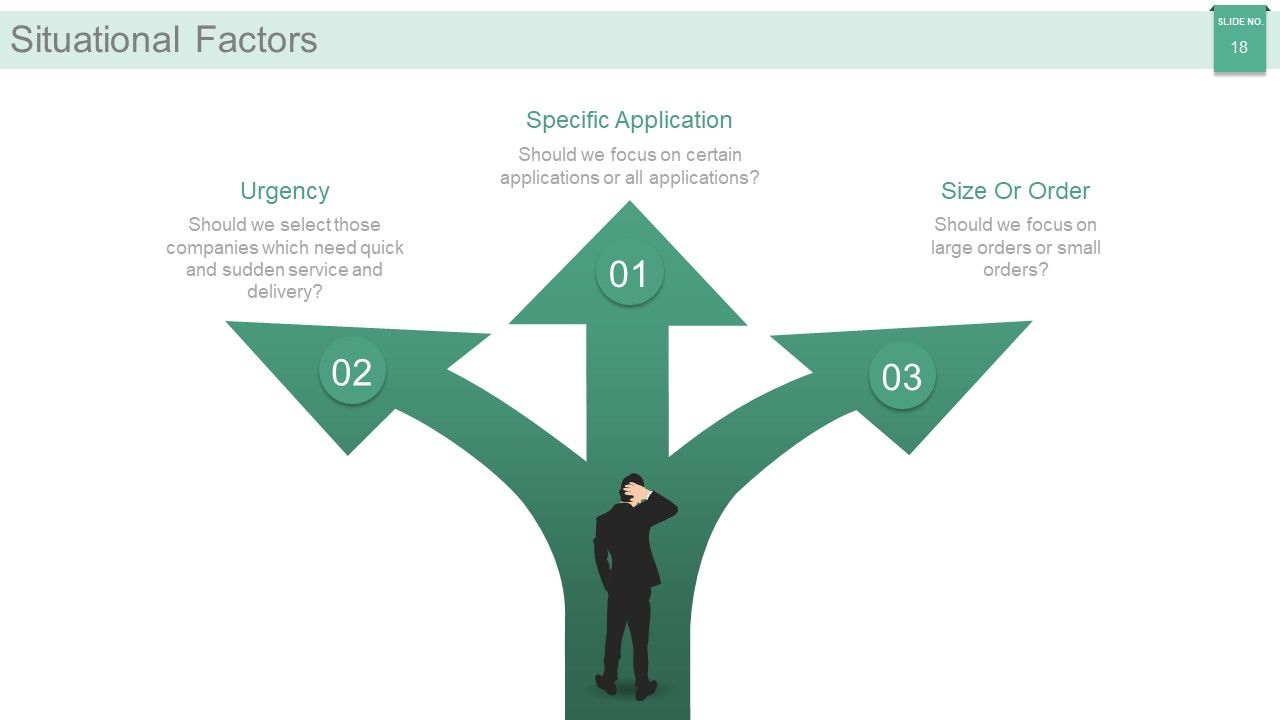
Slide 18: This slide shows Situational Factors such as- Specific Application, Urgency, Size Or Order.
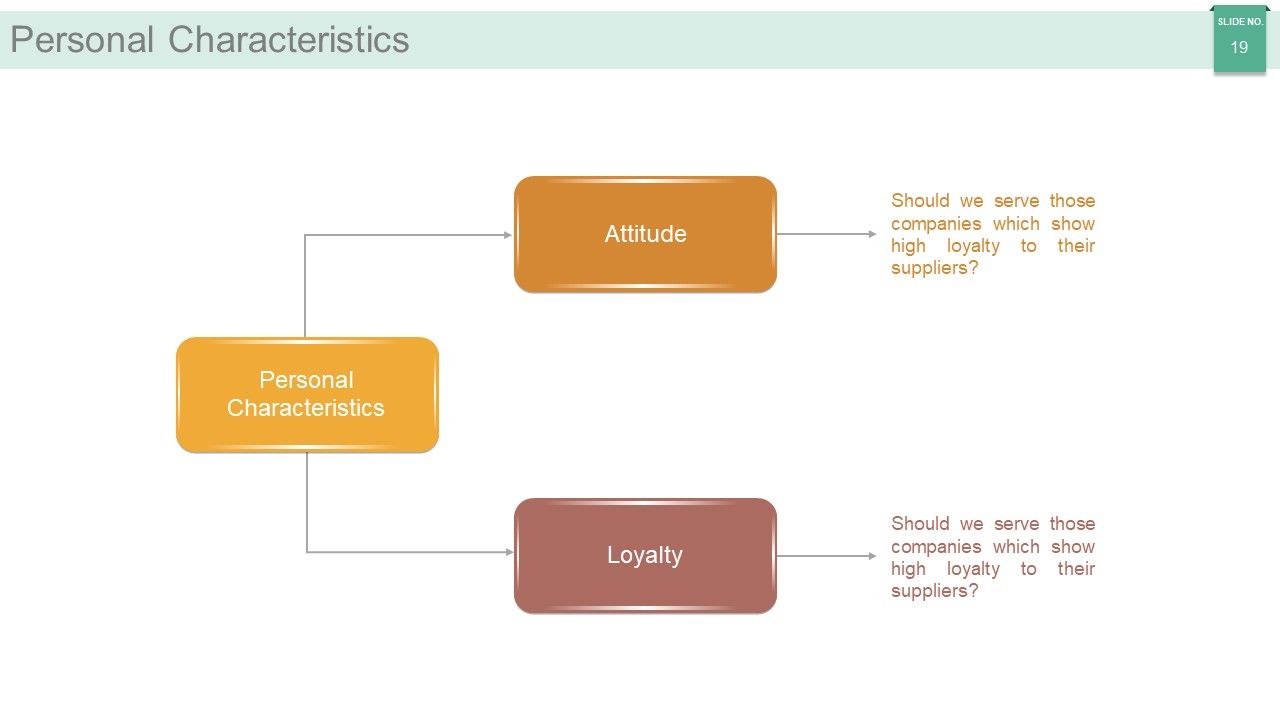
Slide 19: This slide showcases Personal Characteristics divided into- Loyalty, Attitude.
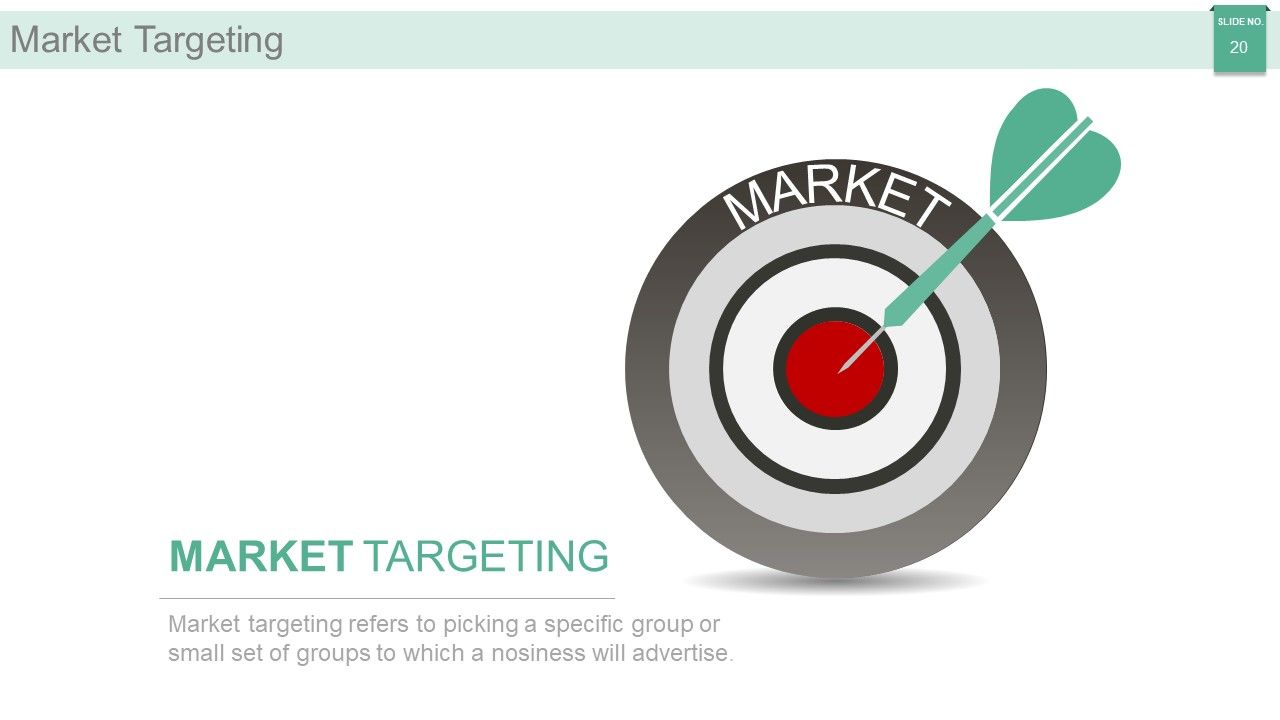
Slide 20: This slide presents Market Targeting with dart arrow imagery. State market's targeting points here.
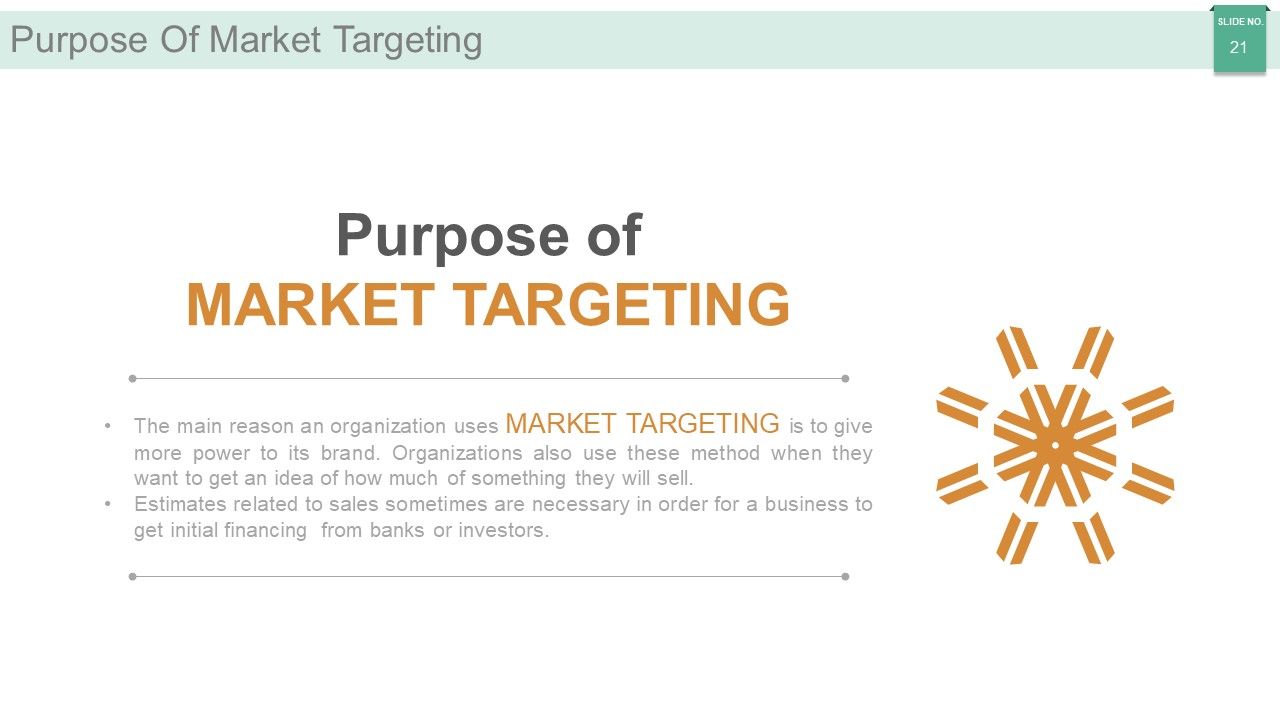
Slide 21: This slide showcases Purpose Of Market Targeting such as- The main reason an organization uses MARKET TARGETING is to give more power to its brand. Organizations also use these method when they want to get an idea of how much of something they will sell. Estimates related to sales sometimes are necessary in order for a business to get initial financing from banks or investors.
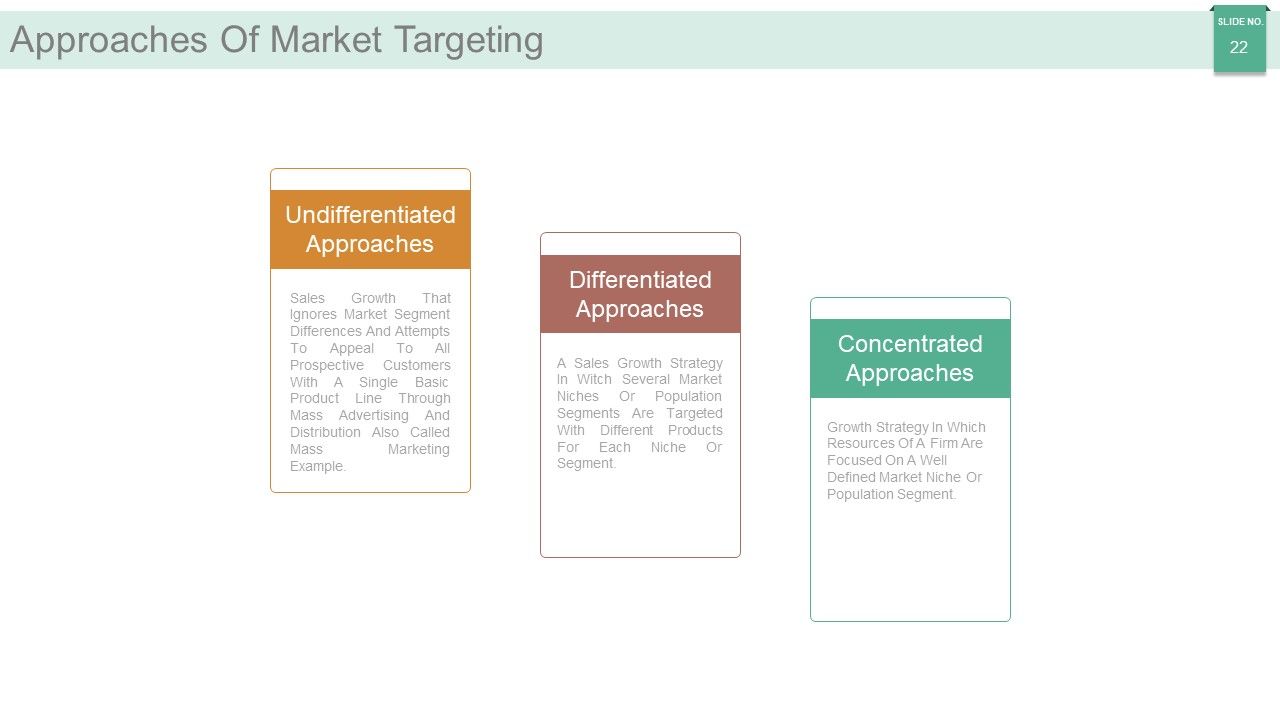
Slide 22: This slide shows Approaches Of Market Targeting such as- Undifferentiated Approaches, Differentiated Approaches, Concentrated Approaches.
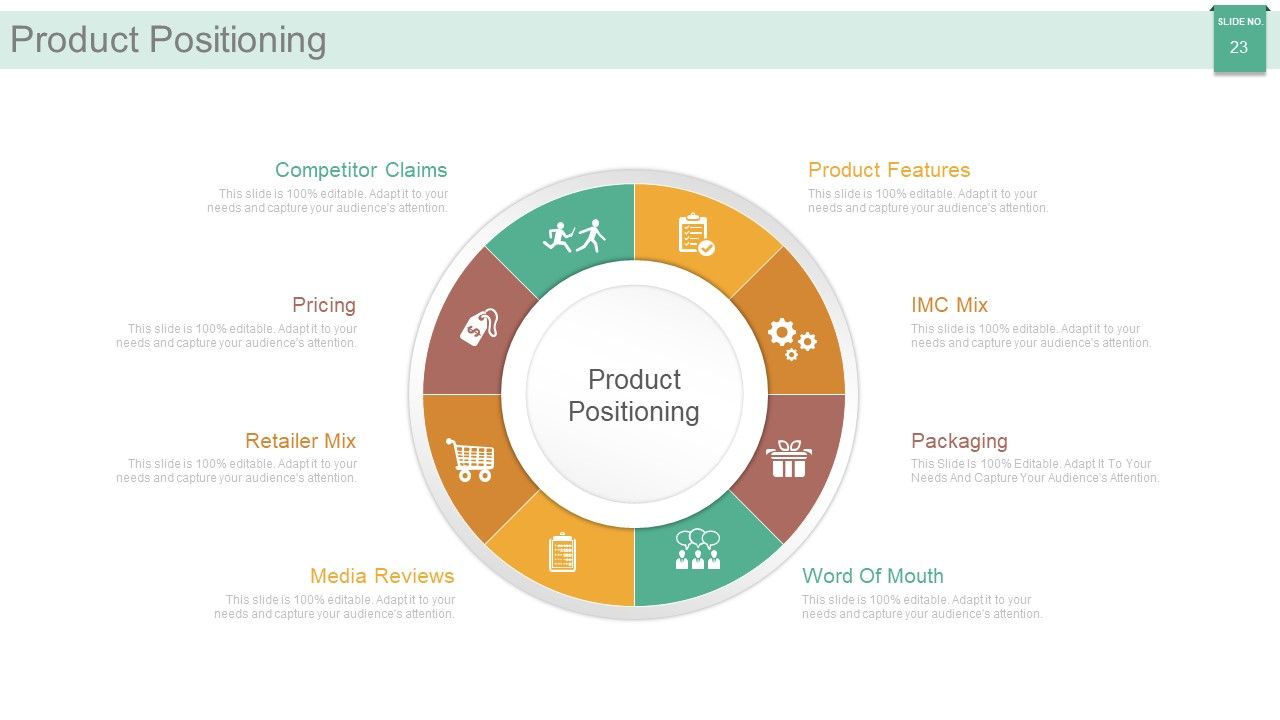
Slide 23: This slide shows Product Positioning with the following points- Packaging, Product Features, Competitor Claims, IMC Mix, Pricing, Retailer Mix, Word Of Mouth, Media Reviews.
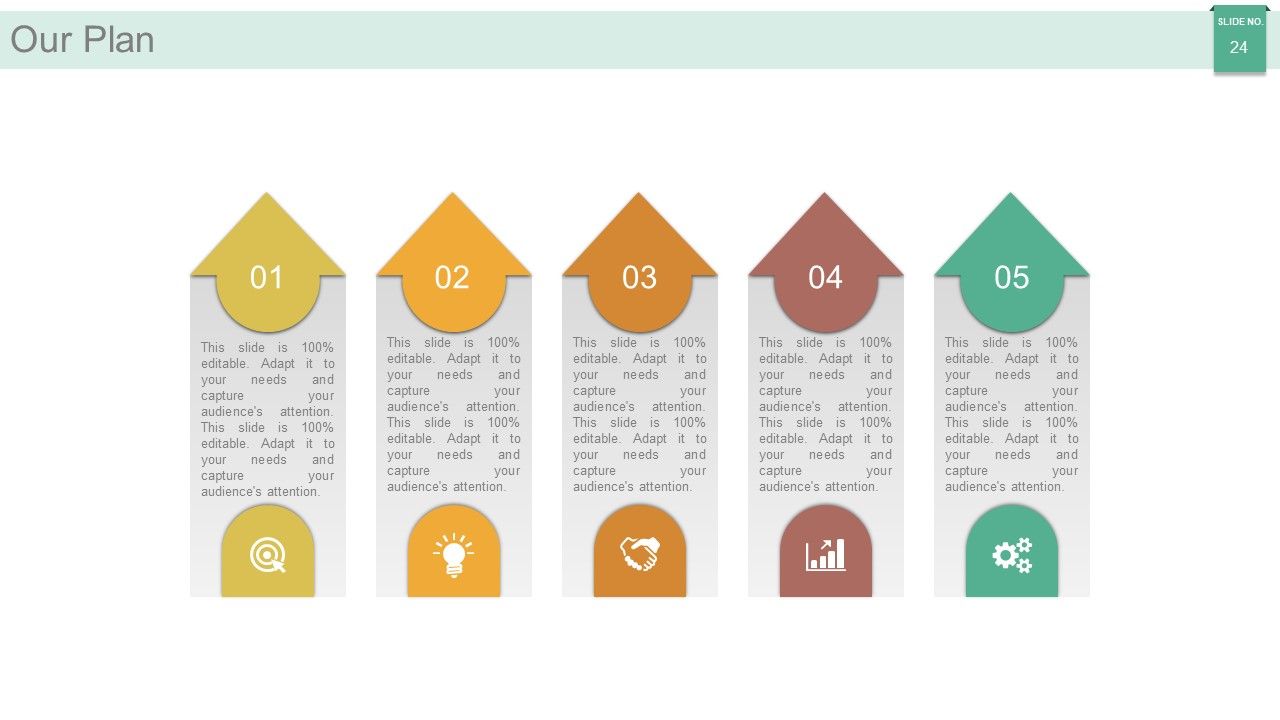
Slide 24: This slide shows Our Plan with creative arrow imagery.
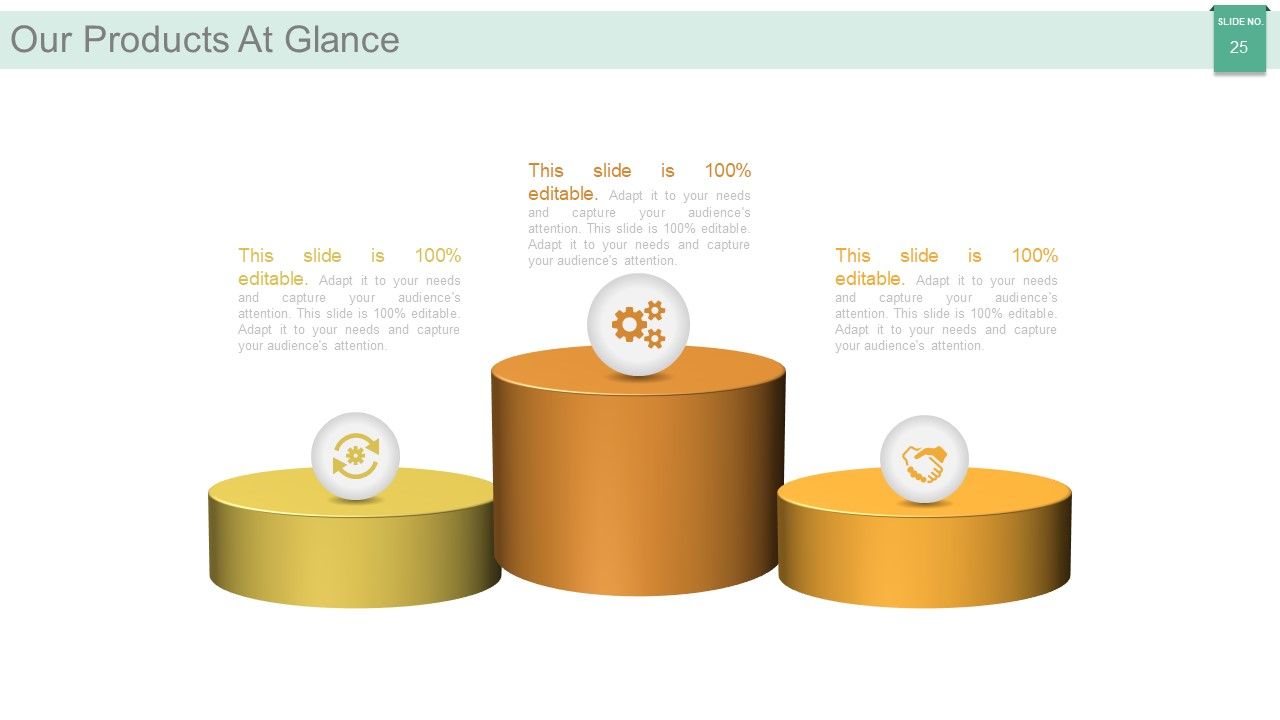
Slide 25: This slide showcases Our Products At Glance. State product aspects, features etc. here.
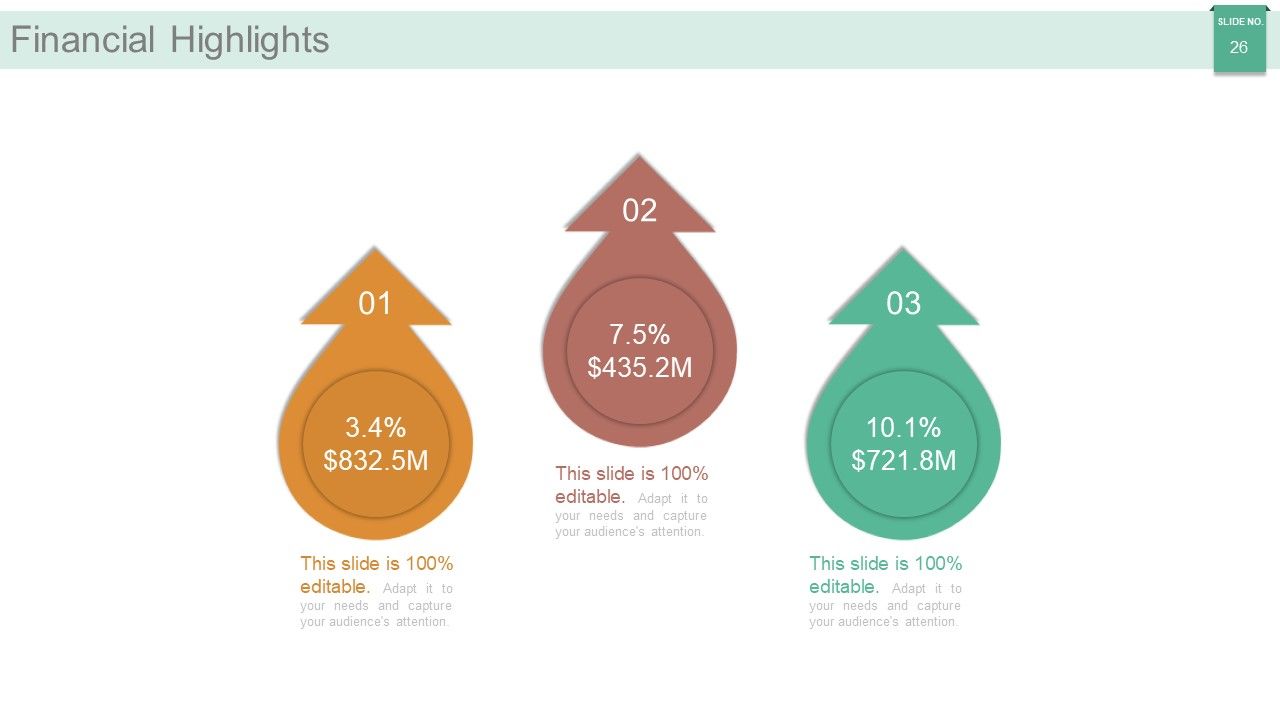
Slide 26: This slide shows Financial Highlights. State financial aspects here.
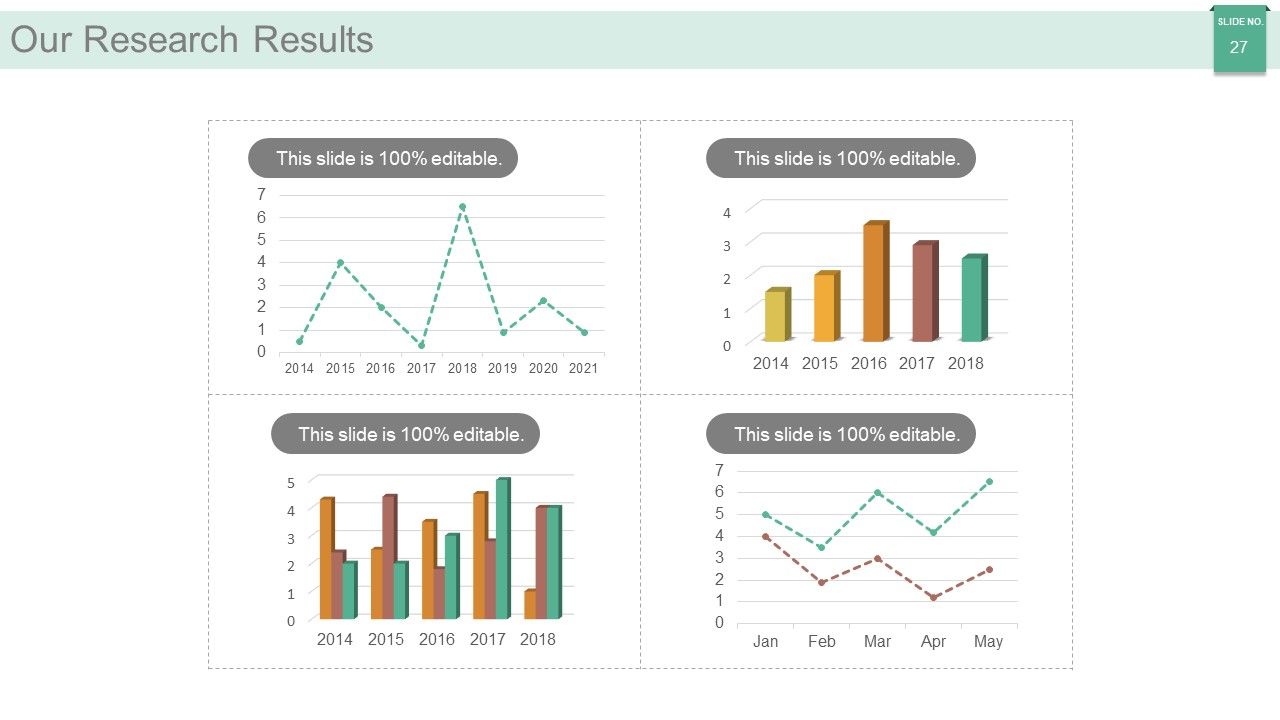
Slide 27: This slide shows Research Results. State in graph form here.
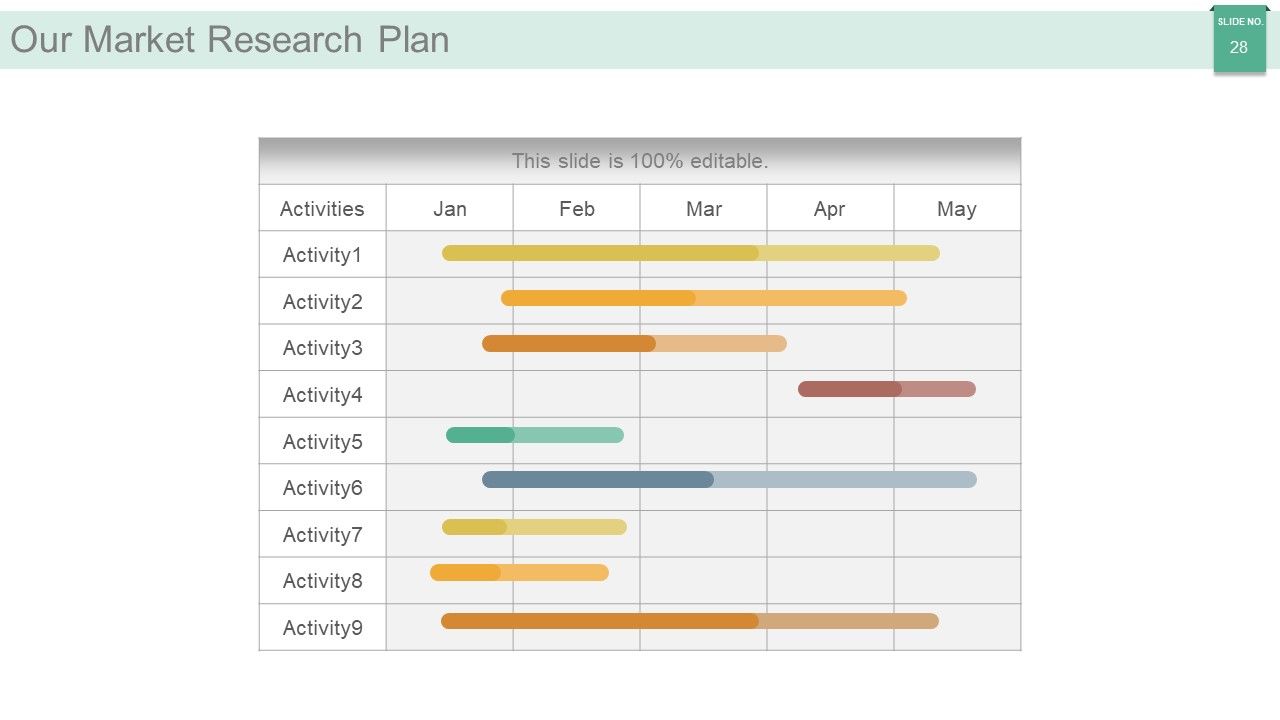
Slide 28: This slide presents Our Market Research Plan. State planning aspects here.
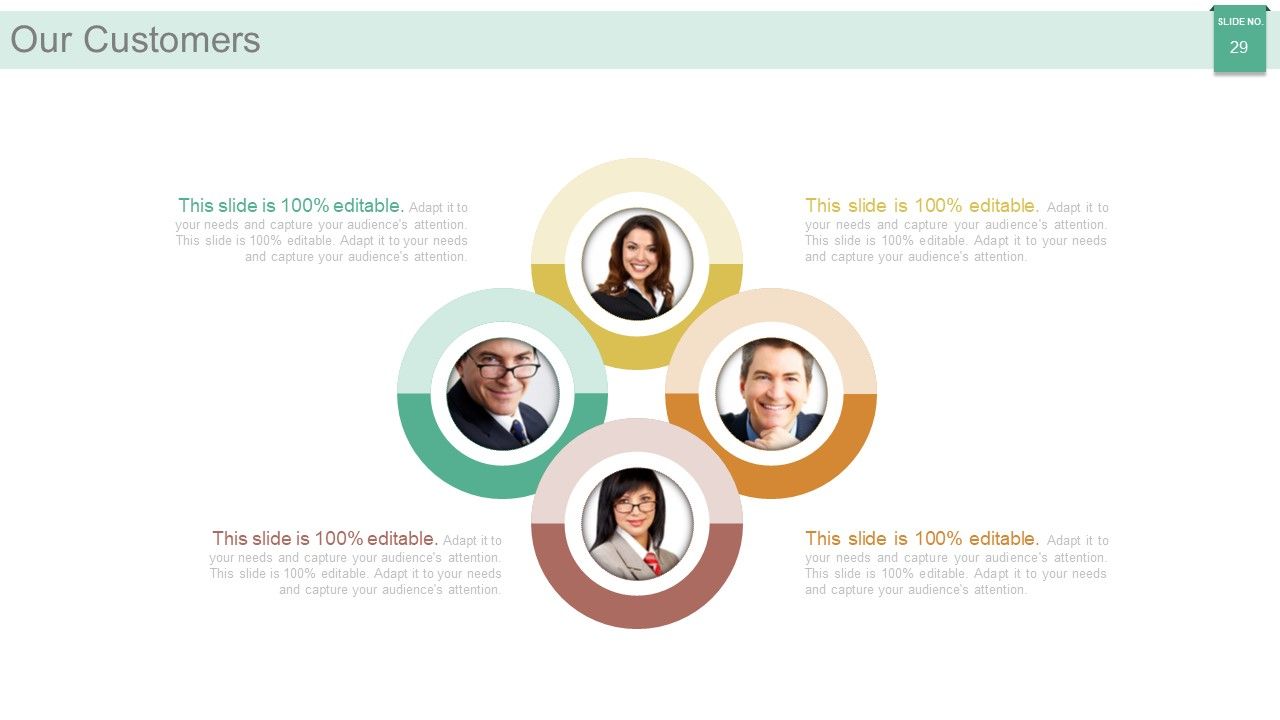
Slide 29: This is Our Customers slide with name, image and text boxes.
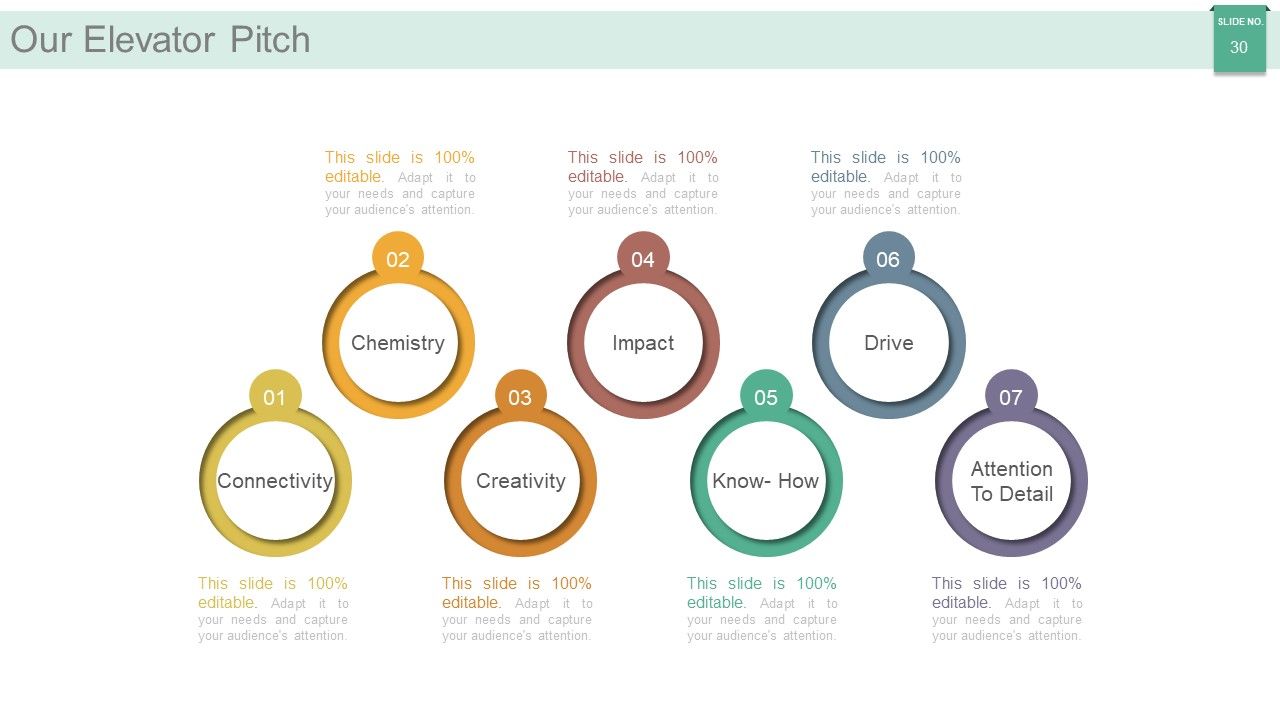
Slide 30: This slide shows Our Elevator Pitch to display- Connectivity Chemistry Creativity Impact Know- How Drive Attention To Detail as the highlighting factors.
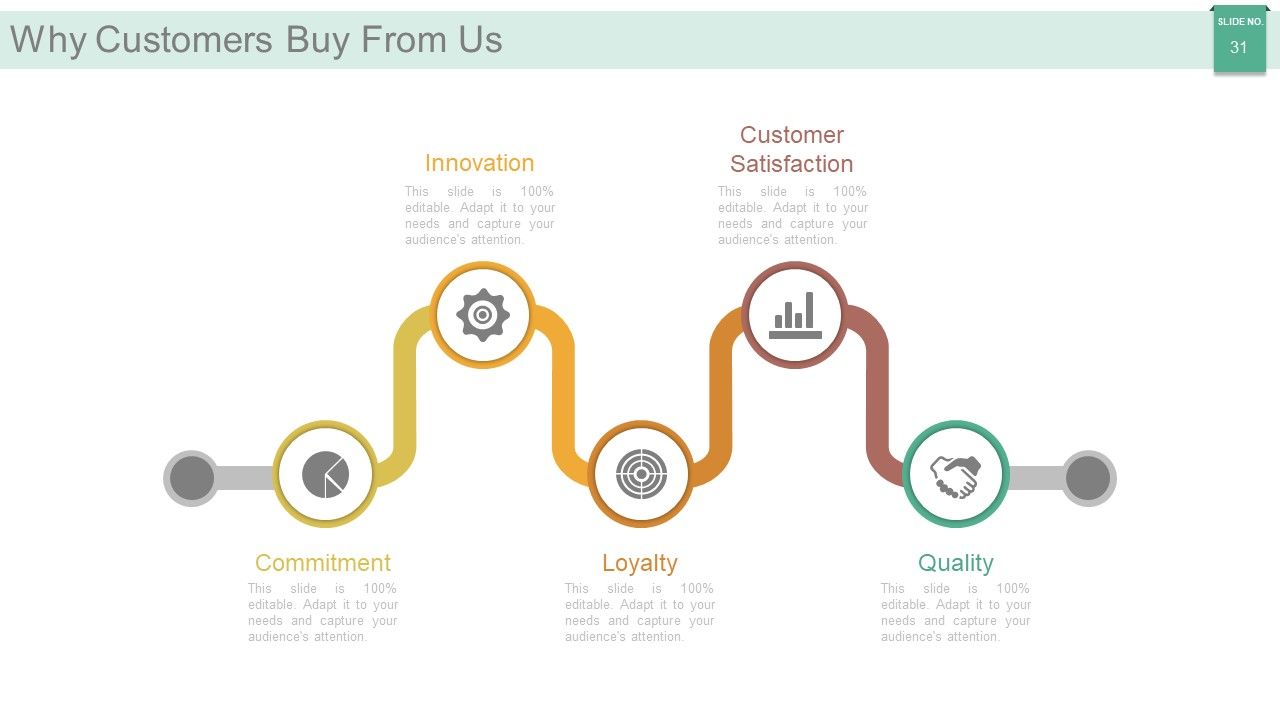
Slide 31: This slide shows Why Customers Buy From Us in terms of- Commitment, Innovation, Loyalty, Customer Satisfaction, Quality.
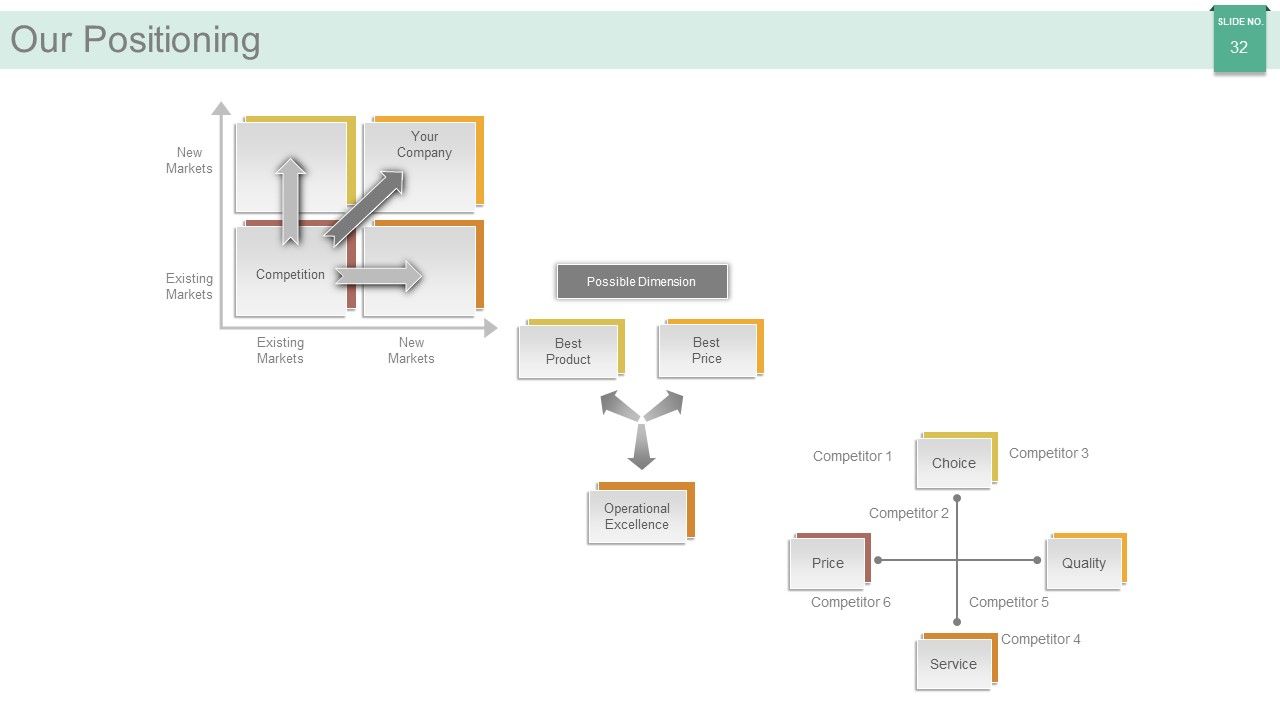
Slide 32: This slide shows Our Positioning displaying- Competition, New Markets, Existing Markets, New Markets, Existing Markets, Possible Dimension, Best Price, Best Product, Operational Excellence, Choice, Quality, Service, Price, Competitor.
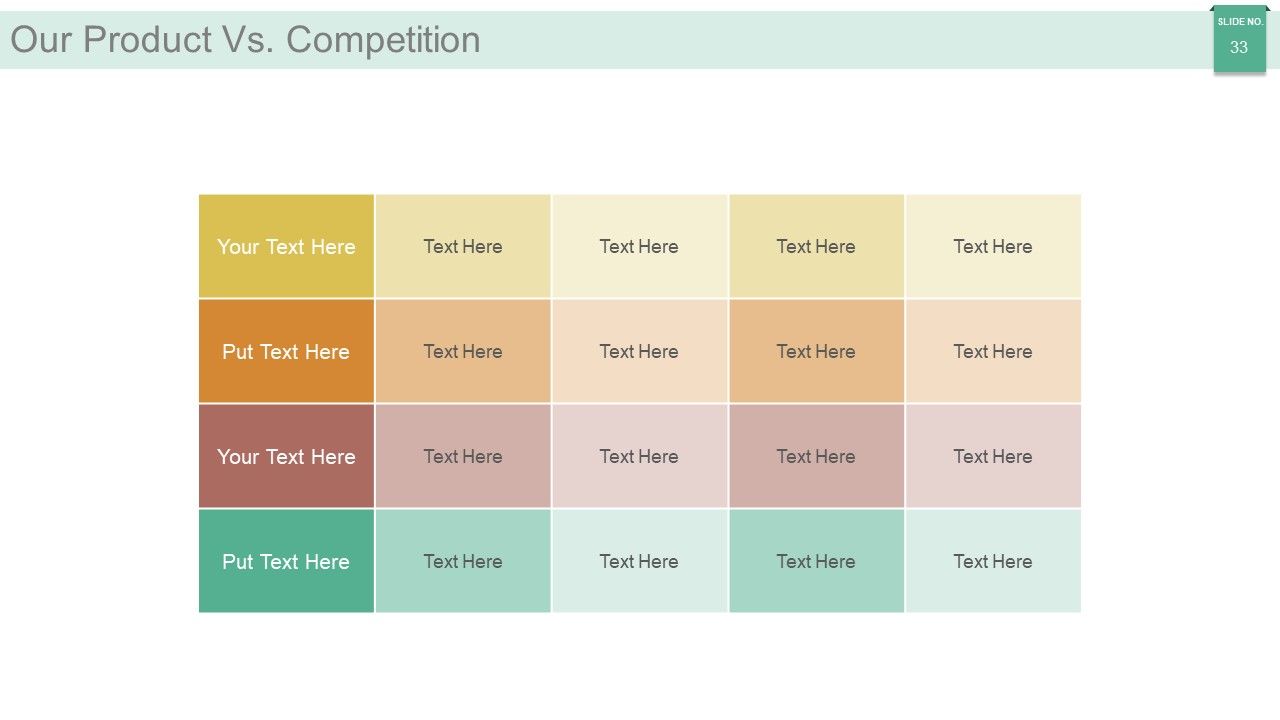
Slide 33: This slide shows Our Product Vs. Competition in tabular form.
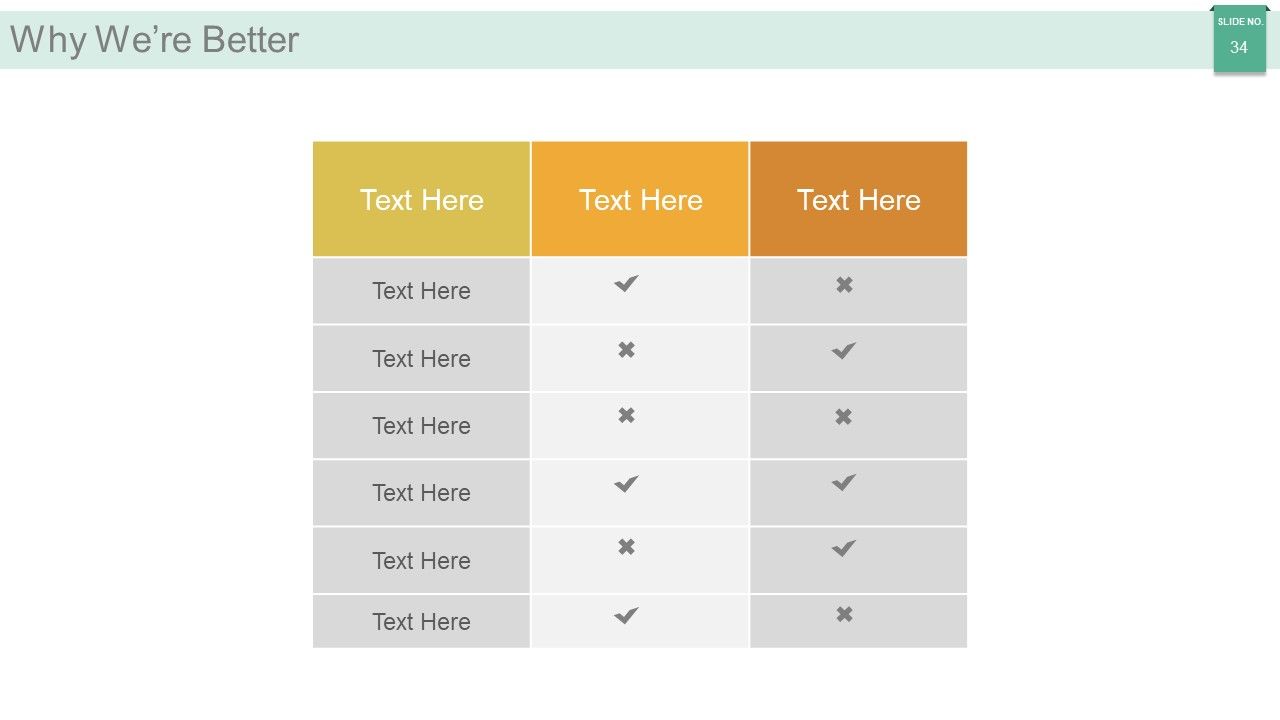
Slide 34: This slide displays Why We’re Better. State your USP here.
Slide 35: This slide is titled Additional Slides to move forward. You can change the slide content as per need.
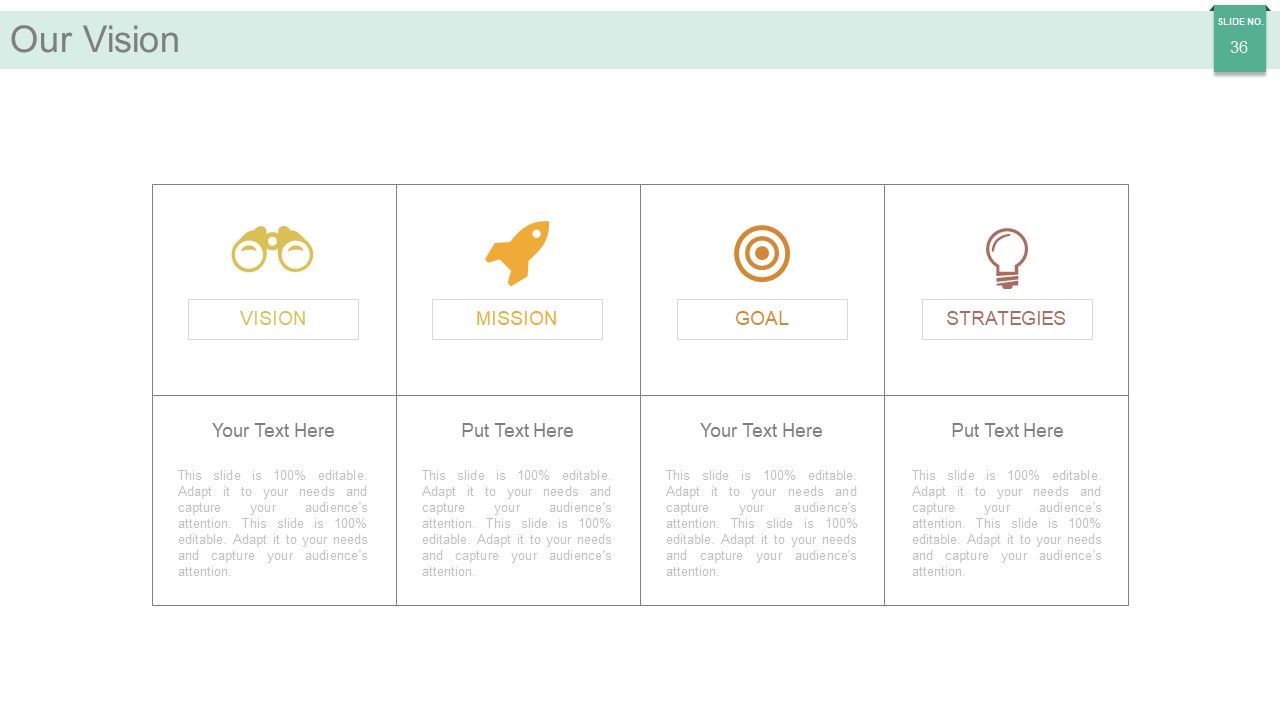
Slide 36: This is Our Mission with Vision and Strategy slide. State them here.
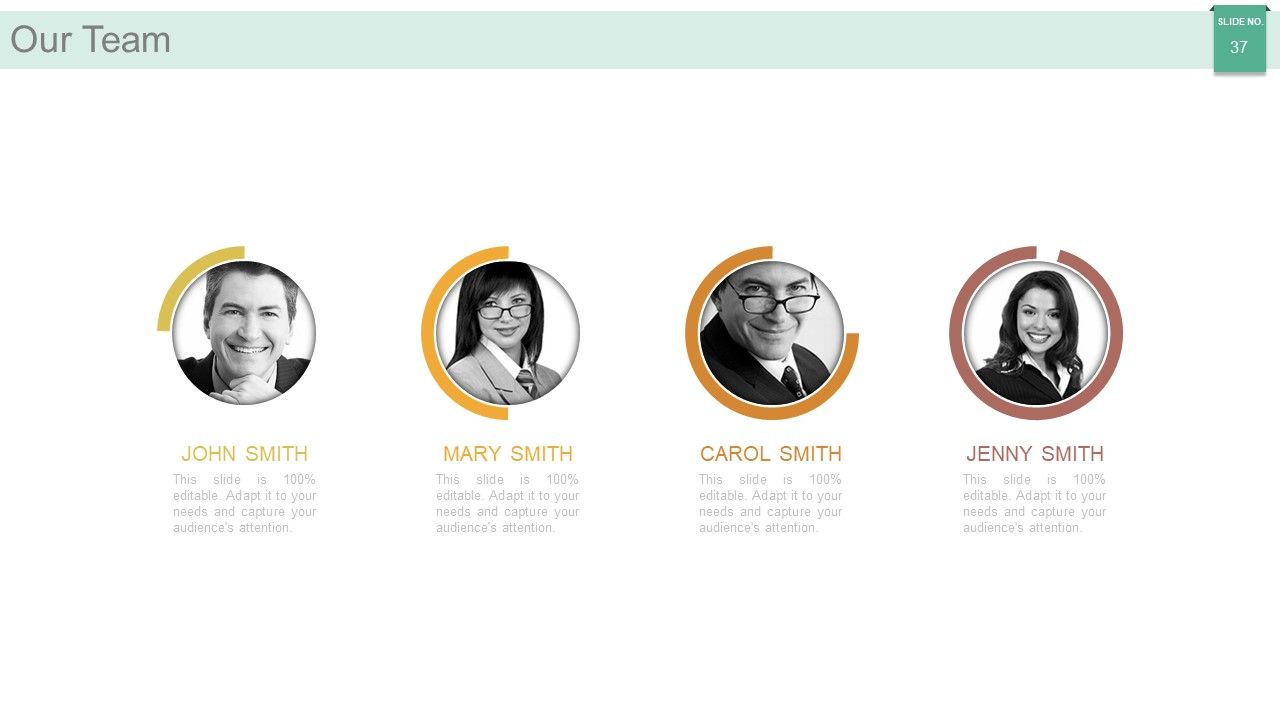
Slide 37: This is Our Team slide with names, designation and text boxes to fill information.
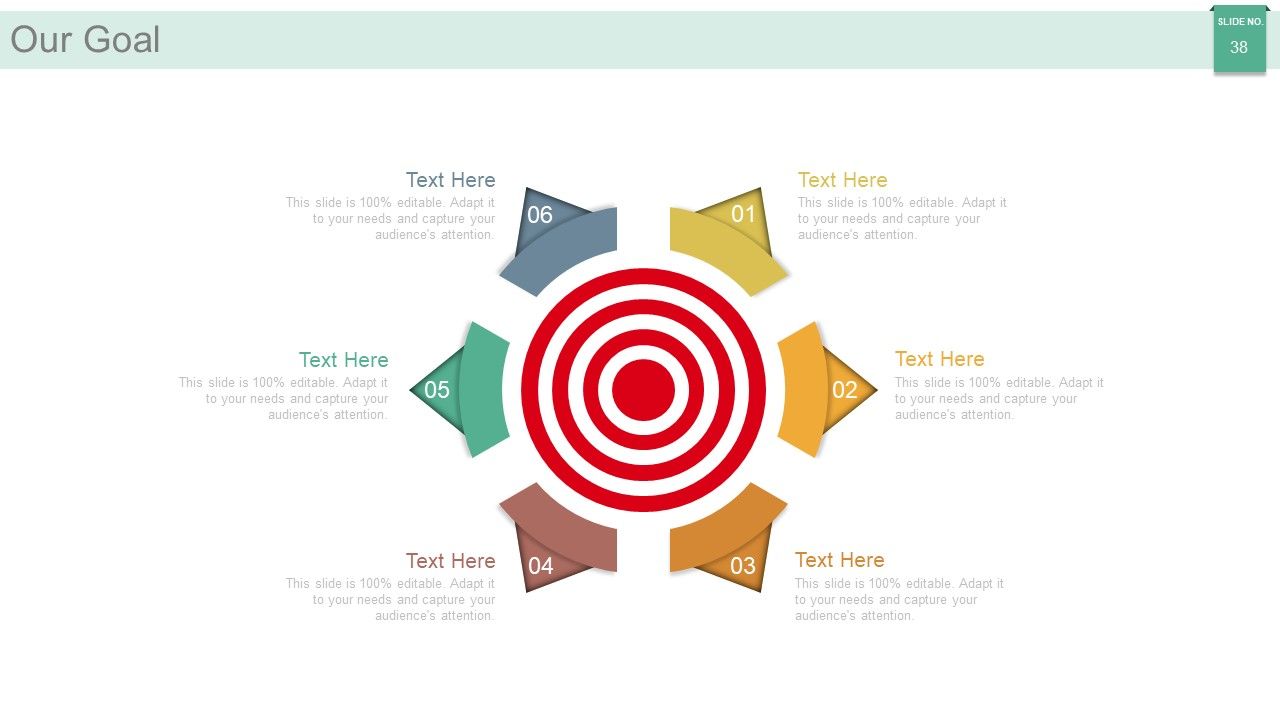
Slide 38: This is Our Goal slide. State your goals here.
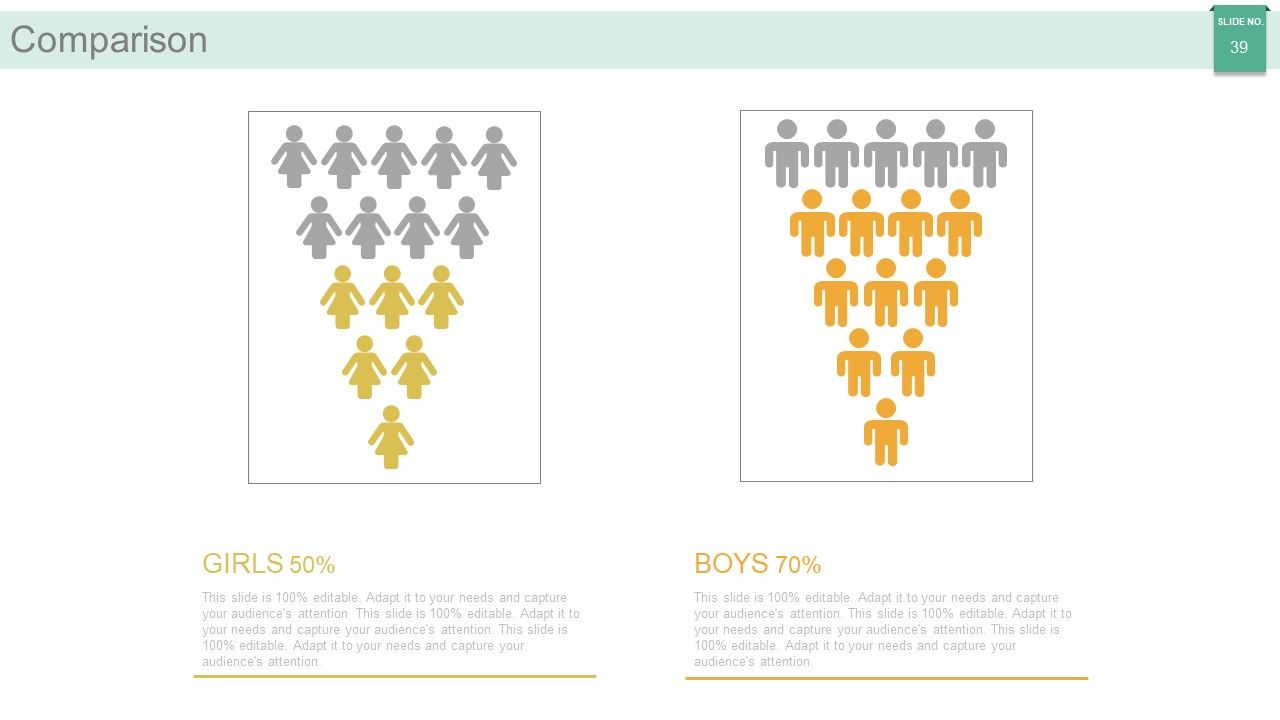
Slide 39: This is a Comparison slide in creative form. State comparison, specifications etc. here.
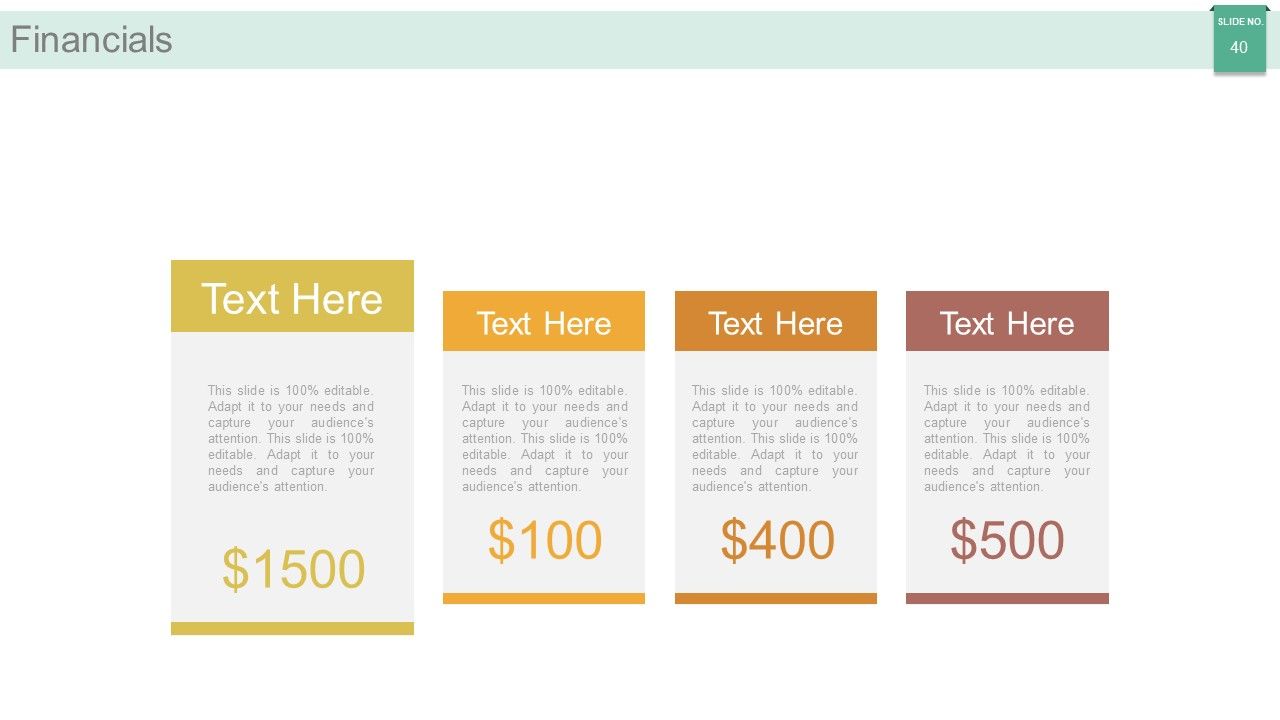
Slide 40: This is a Financials score slide to state financial aspects etc.
Slide 41: This is a Quotes slide to show something you want to convey. You may change the slide content as required.
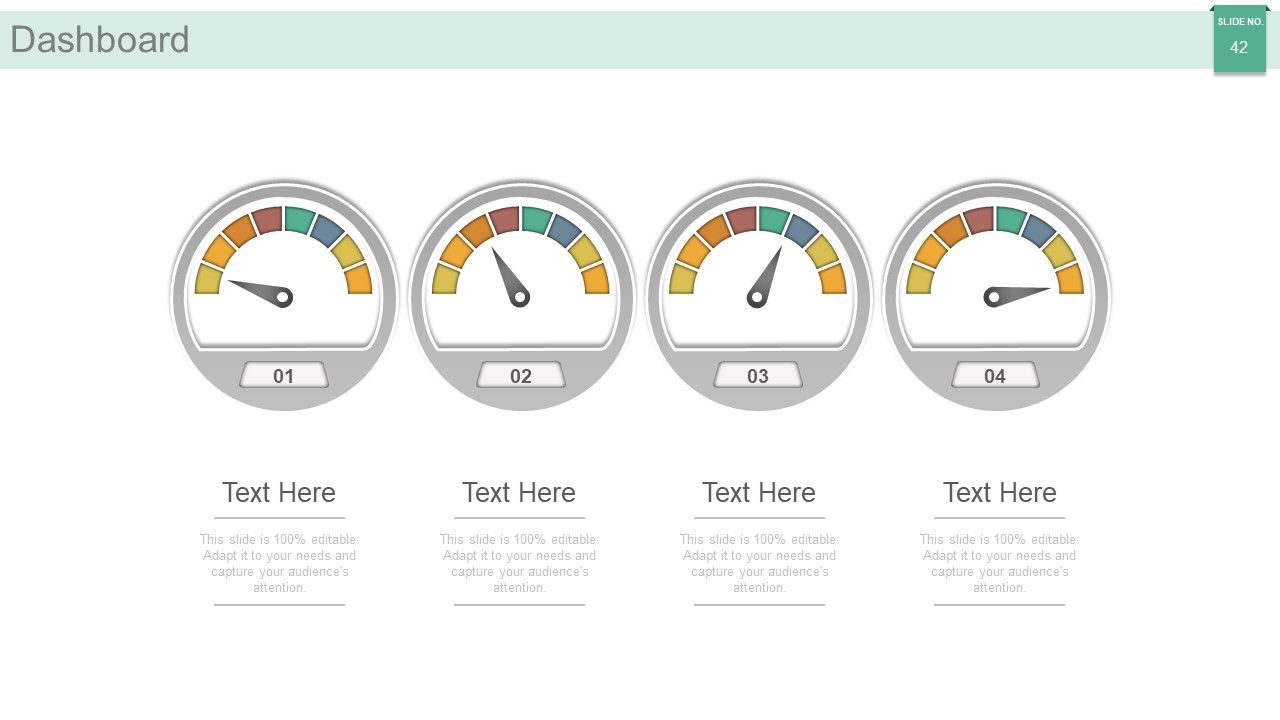
Slide 42: This is a Dashboard slide to state Low, medium and High aspects, kpis, metrics etc.
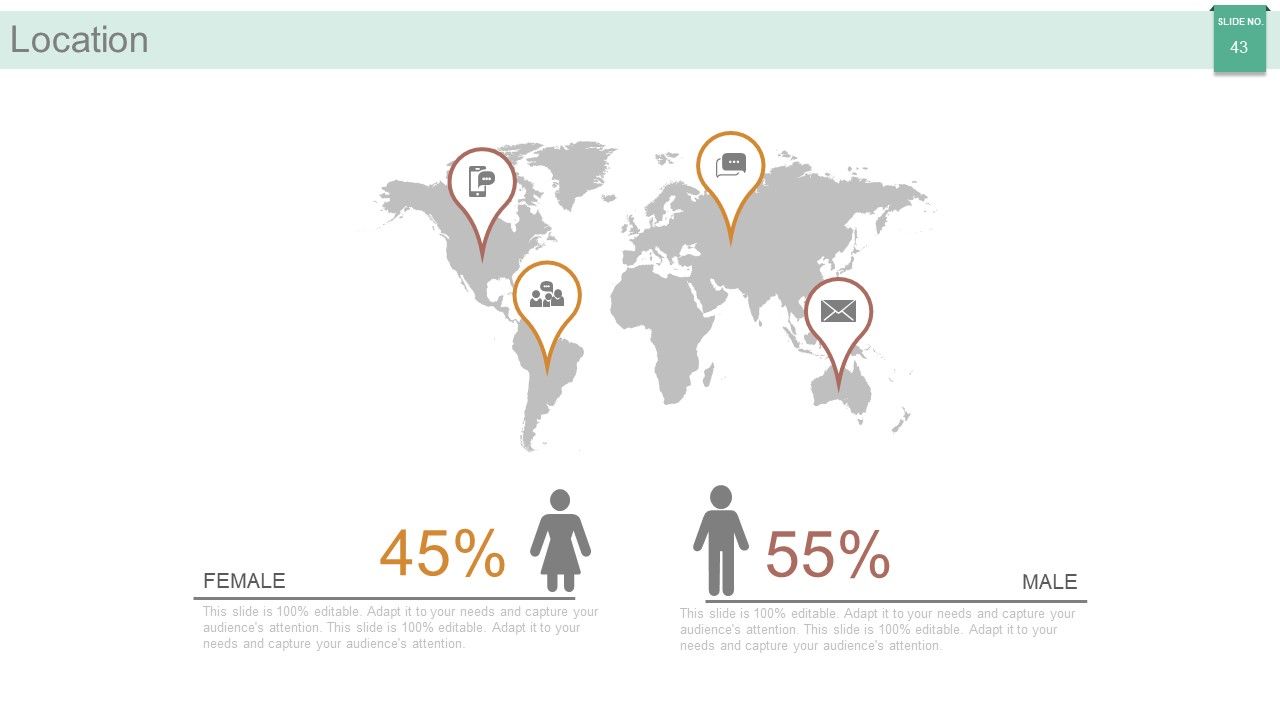
Slide 43: This is a Location slide displaying male & female and world map image. Mark specific locations for company growth, market etc. here.
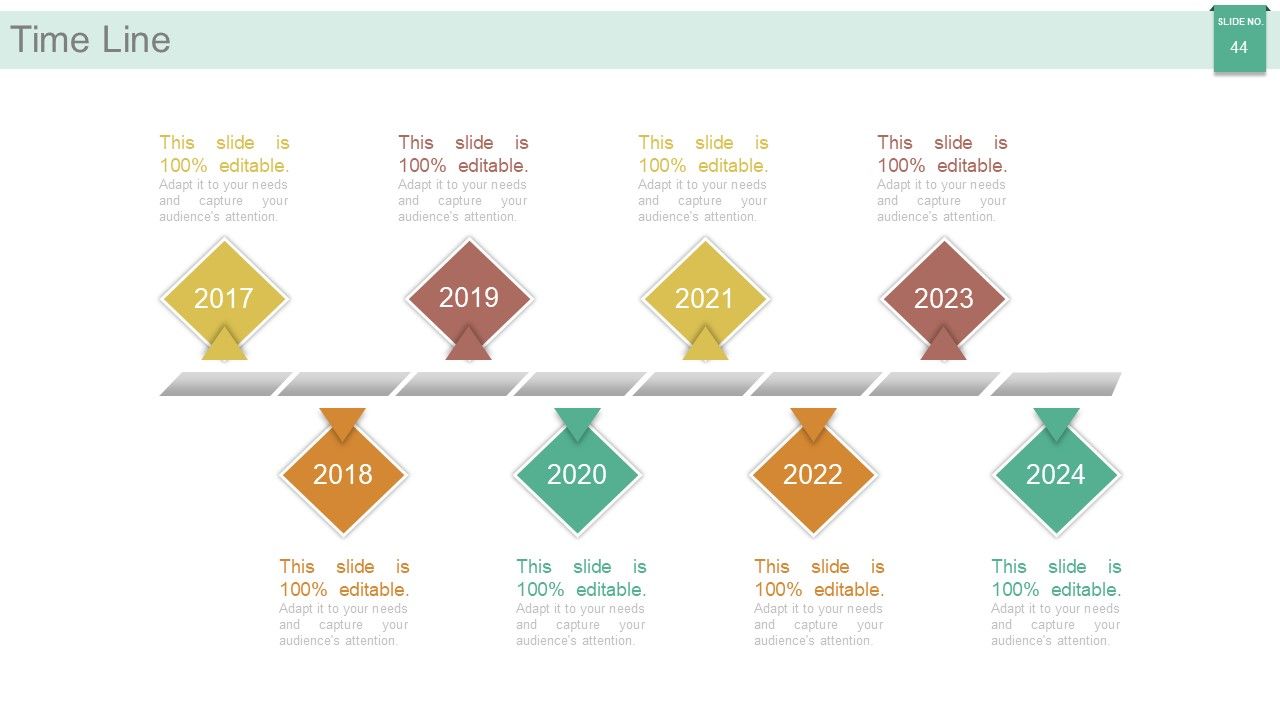
Slide 44: This slide showcases a Timeline to show milestones, important highlights etc.
Slide 45: This is a Newspaper image slide to show important information, events etc. Pin your information here.
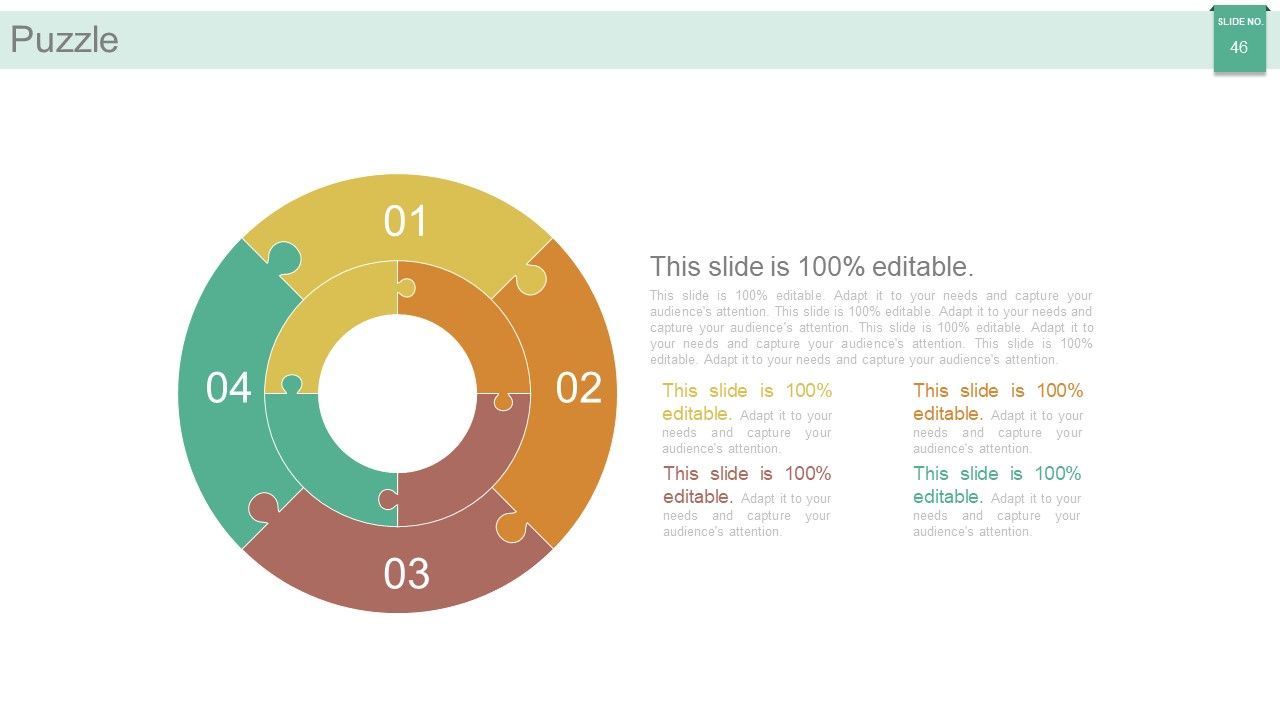
Slide 46: This is a Puzzle image slide. State information, specifications etc. here.
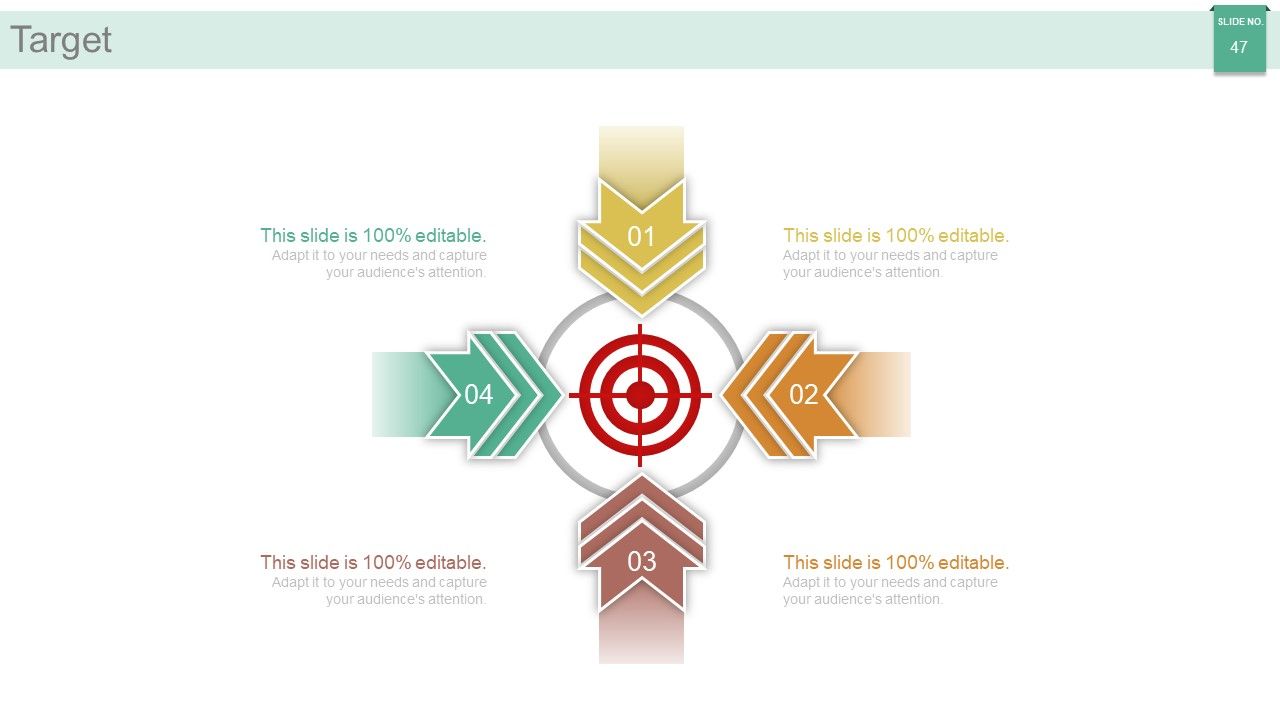
Slide 47: This is a Target slide. State here your targets.
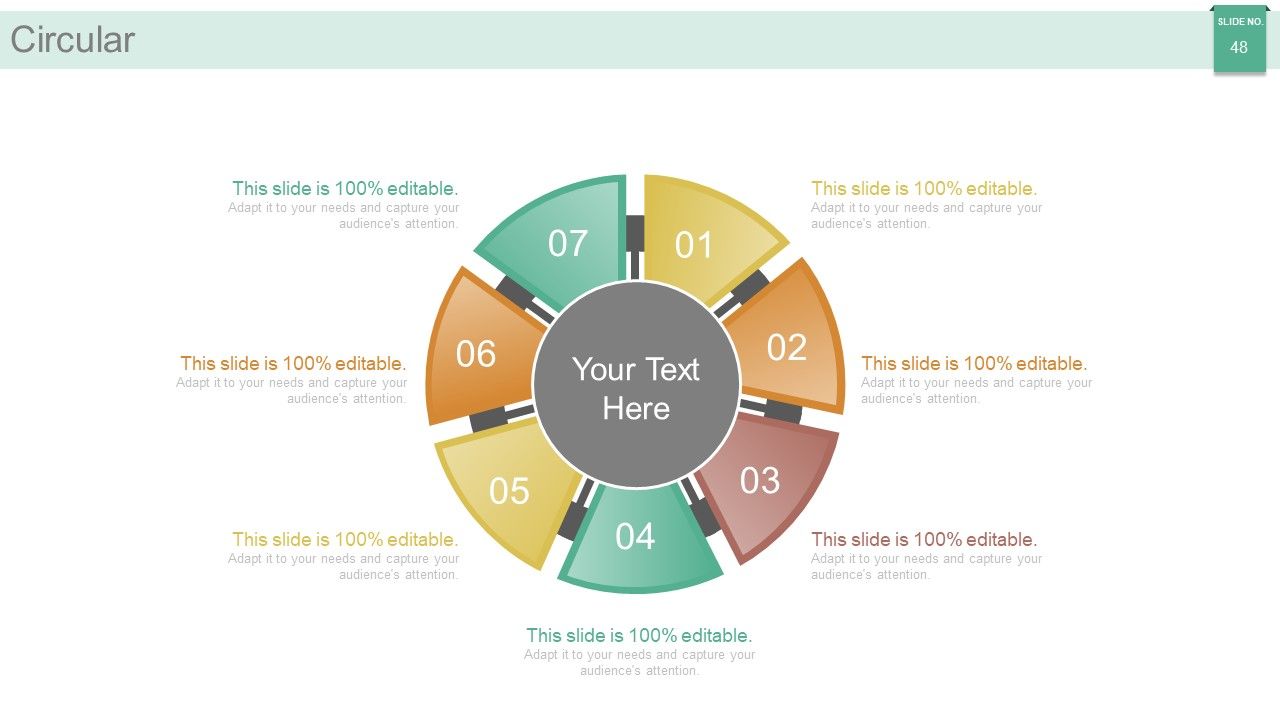
Slide 48: This is a Circular image slide. State specifications, information here.
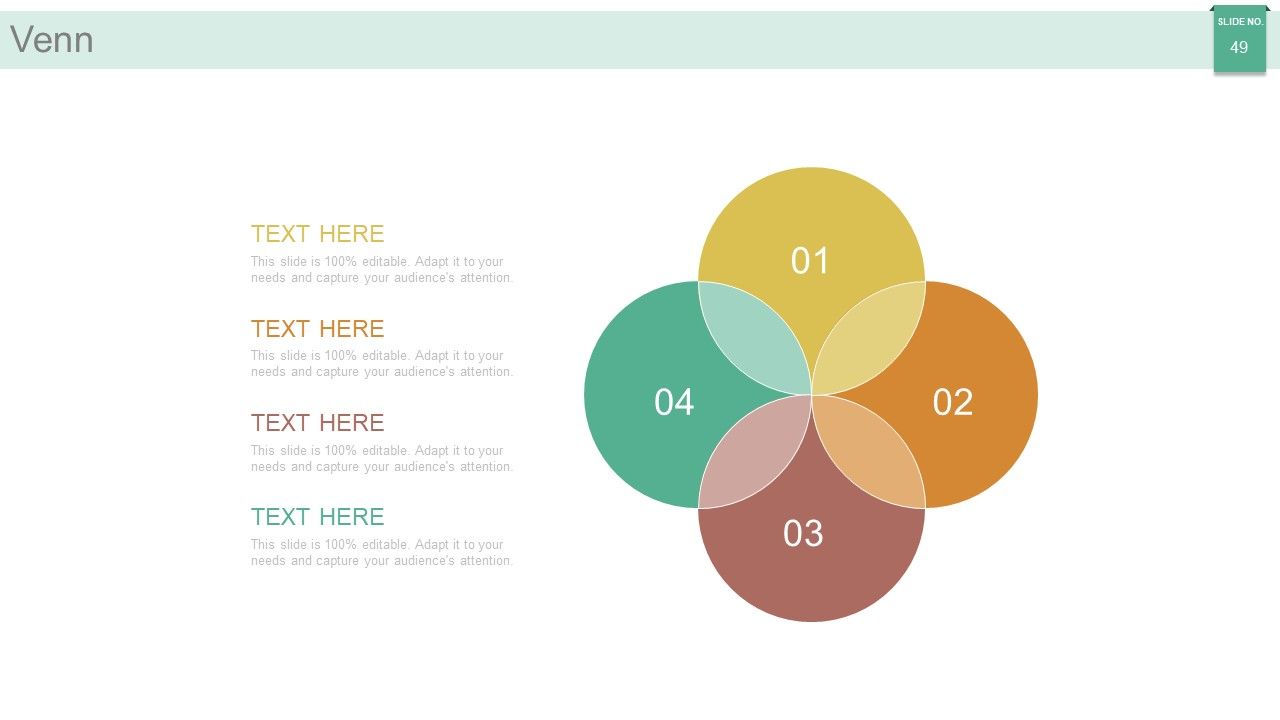
Slide 49: This is a Venn diagram slide to show information, specifications etc.
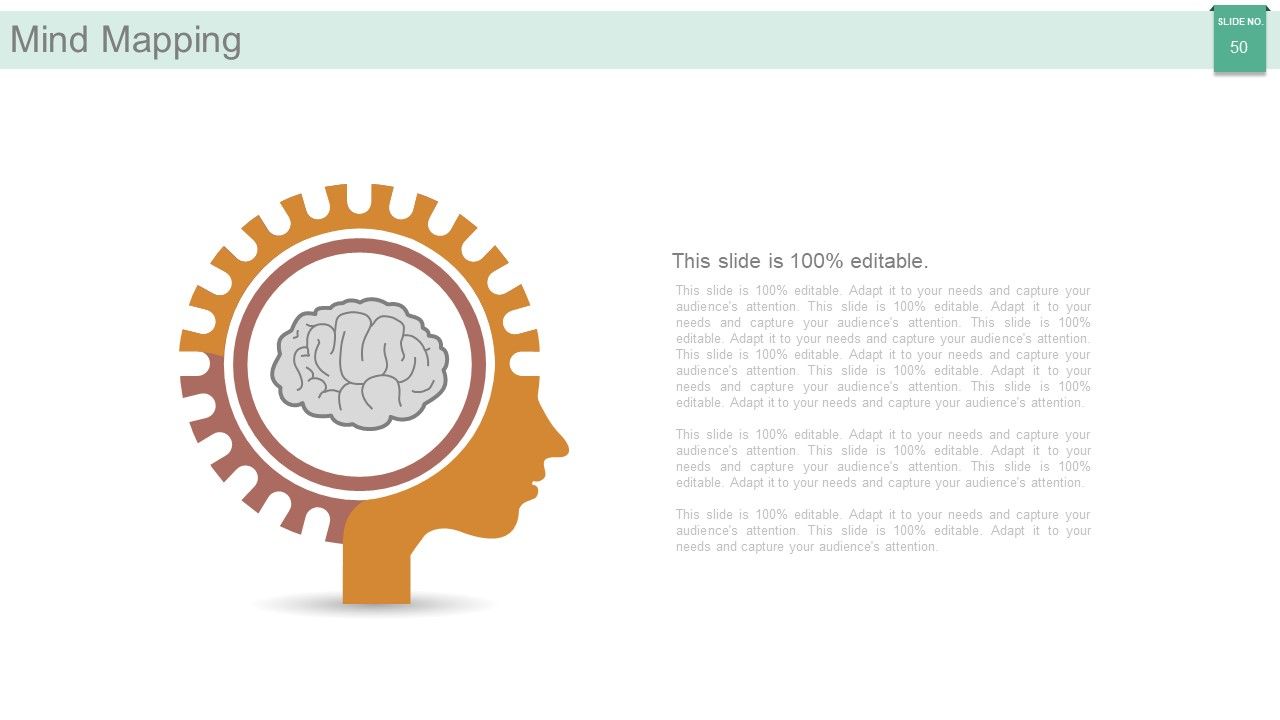
Slide 50: This is a Mind Map image slide to show segmentation, information, specifications etc.
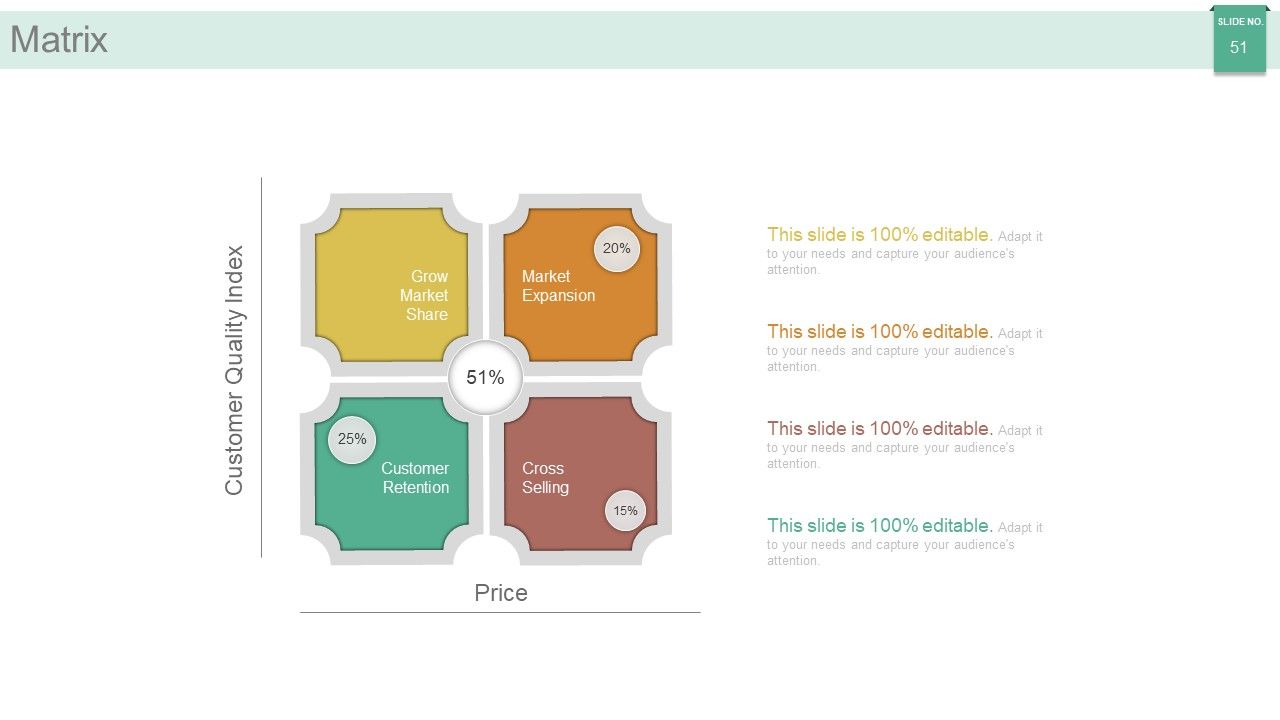
Slide 51: This is a Matrix slide to show segmentation, information, specifications such as- Grow Market share, Market Expansion, Customer Retention, Cross Selling in terms of Customer Quality Index and Price.
Slide 52: This is a Lego image slide. State information, specifications etc. here.
Slide 53: This slide shows Silhouettes with text boxes. State people related information, specifications etc. here.
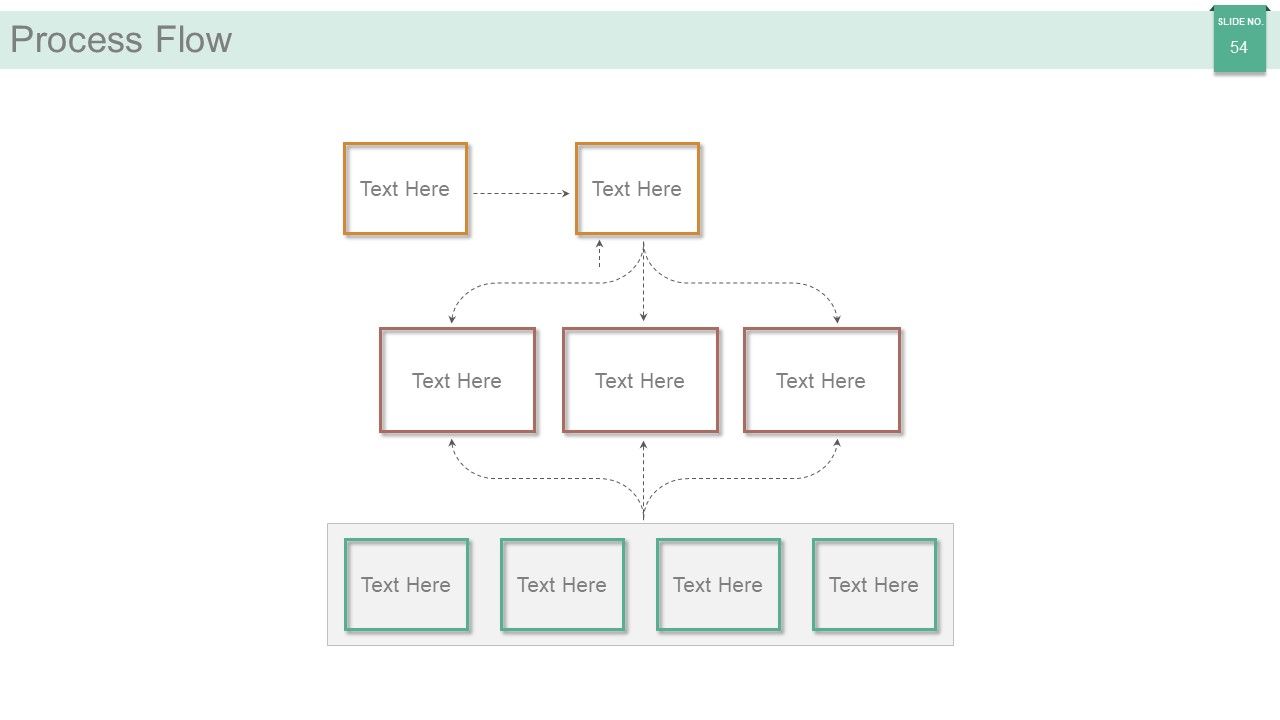
Slide 54: This slide shows Process Flow with text boxes. State process related information, specifications etc. here.
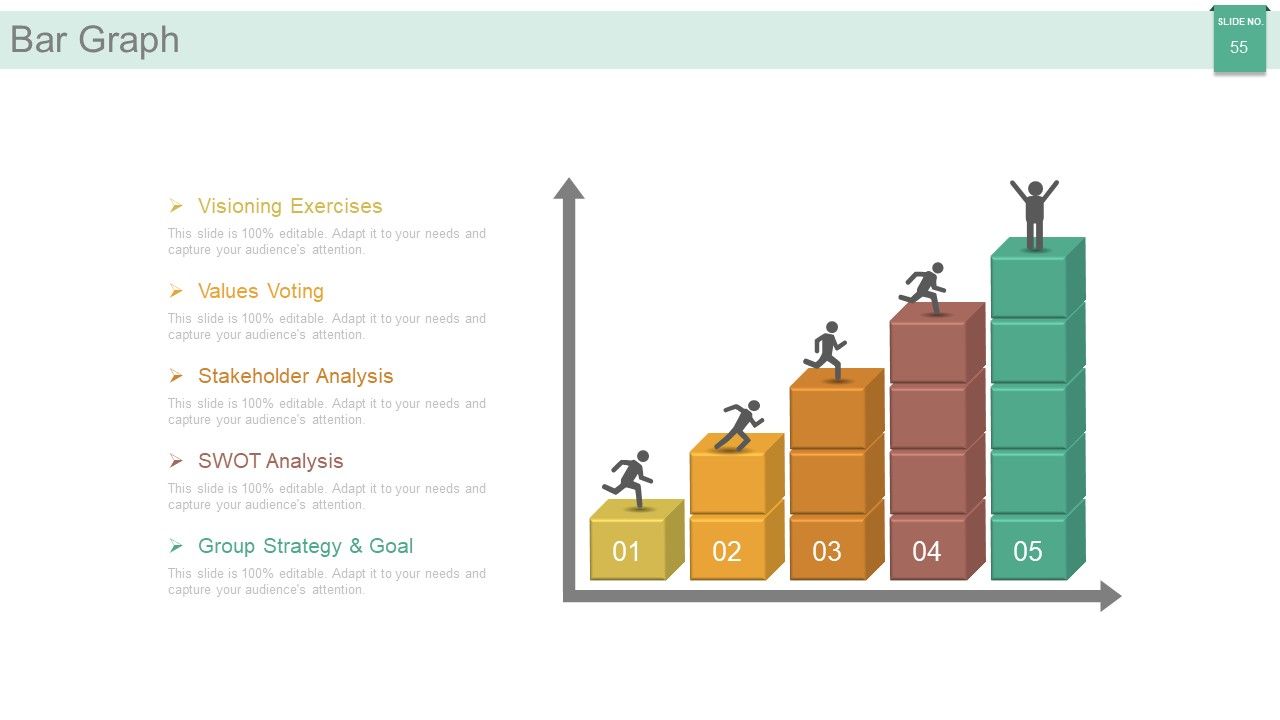
Slide 55: This is a Bar Graph slide to show information, specifications etc. such as- Visioning Exercises, Values Voting, Stakeholder Analysis, SWOT Analysis, Group Strategy & Goal.
Slide 56: This is a Magnifier Glass image slide to show information, specifications etc.
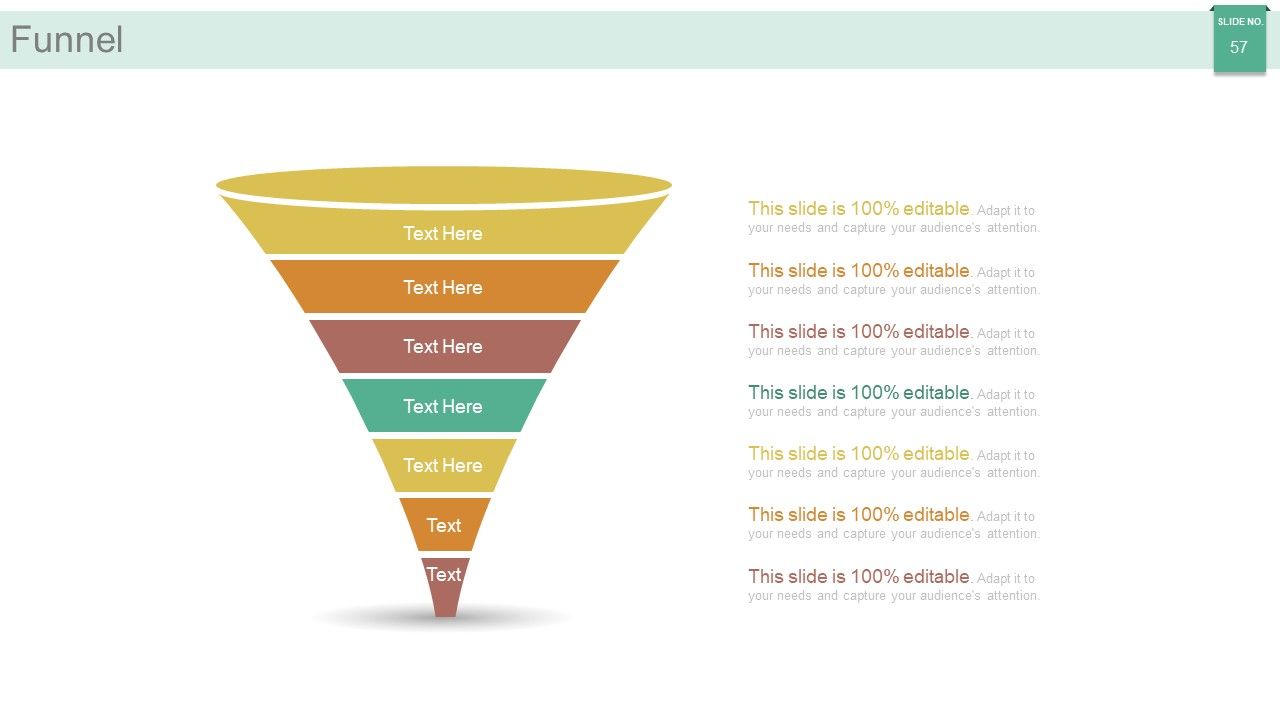
Slide 57: This is a Funnel image slide to show information, specifications etc.
Slide 58: This is a Thank You slide for acknowledgement and ending a presentation.
Market segmentation strategy solutions powerpoint presentation with slides with all 58 slides:
Our Market Segmentation Strategy Solutions Complete Powerpoint Deck With Slides enable you to glide along. Your advance will be effortless.
-
Great designs, Easily Editable.
-
Innovative and attractive designs.


