Quarterly sales performance review powerpoint presentation with slides
To leave a lasting impression with your quarterly sales performance review PowerPoint presentation, you off course need a good PPT example. Taking this into account here we have come up with a readymade PPT sample file to help you look back and thoroughly do performance management, performance review or performance evaluation for future success. Going further, using our qbr marketing presentation deck you can set the tone of a sales meeting to discuss next quarter plans so as to ensure efficient business goals achievement. Best part here is that you can apply our PowerPoint slide deck for your organizational development by portraying various sales data relations and methods to trim down operational costs. Not finished yet, our creative template designs like quarterly pipeline summary, sales cycle, quarter track record, weekly/quarterly sales summary etc. prove handy to address all significant concepts linked to an operational review meeting. Conclusion here is that if you want everything just right in your next quarterly performance review PPT slide show, then you should not look beyond this exclusive PPT sample. Investigate every clue with our Quarterly Sales Performance Review Complete Powerpoint Deck With Slides. Establish the interplay of events.
You must be logged in to download this presentation.
 Impress your
 audience
Editable
of Time
PowerPoint presentation slides
Complete deck having 60 original quarterly business review template designs. Vibrant color template slides to illustrate various related concepts. 100 % editable presentation background, color, layout or text . Comprises of comparisons and graphic tables for better comprehension. No limited space hence easy to introduce text or titles. Well compatible with all sorts of modern software’s. Single click PDF and JPG formats conversion process. Saves time with speedy downloading procedure. The stages in this process are selling, business, sales, success, strategy, planning, review.
People who downloaded this PowerPoint presentation also viewed the following :
Content of this Powerpoint Presentation
Slide 1: This slide presents Quarterly Sales Performance Review. State your company name and continue.
Slide 2: This slide shows your company Agenda. Add it here.
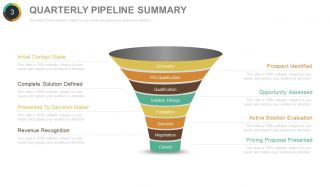
Slide 3: This slide presents Quarterly Pipeline Summary with the following stages- Discovery, Pre-Qualification, Qualification, Solution Design, Evaluation, Decision, Negotiation, Closed. It also shows the following steps- Prospect Identified, Opportunity Assessed, Active Solution Evaluation, Pricing Proposal Presented, Initial Contact Made, Complete Solution Defined, Presented To Decision Maker, Revenue Recognition.
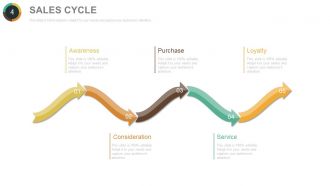
Slide 4: This slide presents Sales Cycle in a flow diagram form with the following stages- Awareness, Consideration, Purchase, Service, Loyalty.
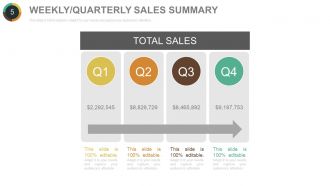
Slide 5: This slide shows Weekly/Quarterly Sales Summary with Total Sales.
Slide 6: This slide also shows Weekly/Quarterly Sales Summary.
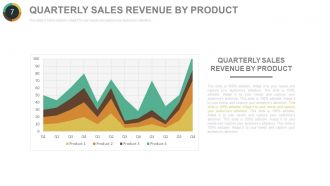
Slide 7: This slide displays Quarterly Sales Revenue By Product graphically.
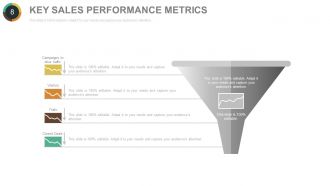
Slide 8: This slide shows a funnel image stating Key Sales Performance Metrics. These metrics include- Trials, Closed Deals, Visitors, Campaigns to drive traffic.
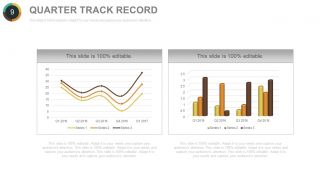
Slide 9: This slide presents Quarter Track Record in charts and graphs.
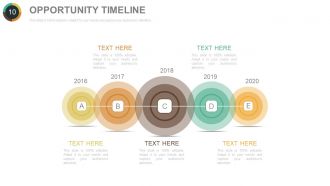
Slide 10: This slide shows Opportunity Timeline. You can add the relevant data such as milestones, journey etc. in this timeline and make use of it.
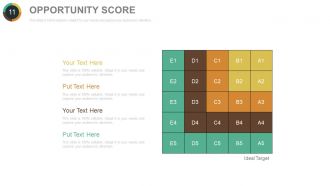
Slide 11: This slide shows Opportunity Score matrix. We have provided few text boxes for you to put relevant data.
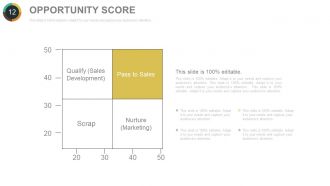
Slide 12: This slide also shows Opportunity Score matrix with the following four points- Qualify (Sales Development), Pass to Sales, Scrap, Nurture (Marketing).
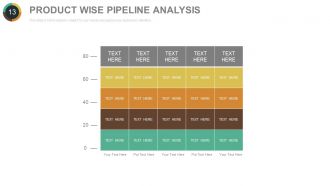
Slide 13: This slide presents Product Wise Pipeline Analysis with text boxes to fill.
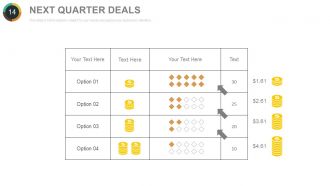
Slide 14: This slide shows Next Quarter Deals.
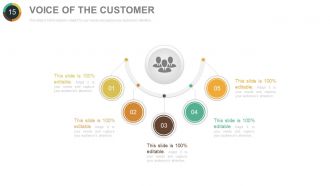
Slide 15: This is Voice Of The Customer slide to state customer problems, opinions etc.
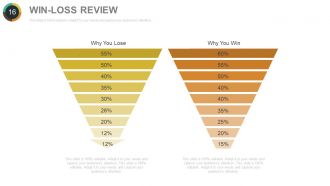
Slide 16: This slide presents Win-Loss Review in percentage etc.
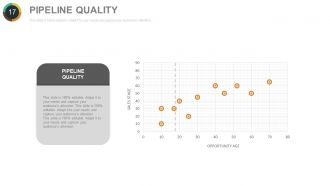
Slide 17: This slide shows Pipeline Quality graph with two aspects- Sales Stage on x-axis and Opportunity Age shown on the y-axis.
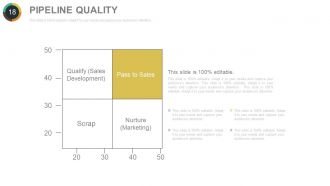
Slide 18: This slide presents Pipeline Quality in a matrix form with- Qualify (Sales Development), Pass to Sales, Scrap, Nurture (Marketing).
Slide 19: This slide shows Key Sales Initiatives in a funnel image form.
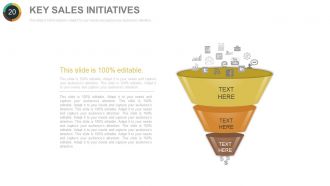
Slide 20: This slide also shows Key Sales Initiatives in a funnel image form.
Slide 21: This slide presents Forecast Accuracy graph indicating the Upper Control Limit (UCL), Lower Control Limit (UCL).
Slide 22: This slide also shows Forecast Accuracy graph.
Slide 23: This slide presents Current Quarter Portfolio in a pie chart/ graph form. It also shows various icons and text boxes to fill.
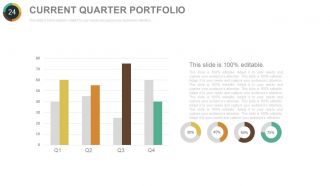
Slide 24: This slide presents Current Quarter Portfolio graph.
Slide 25: This is Sales Rep Performance Scorecard matrix slide showing the Overall Territory Performance.
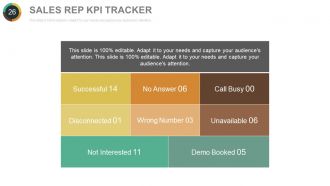
Slide 26: This slide shows Sales Rep KPI Tracker.
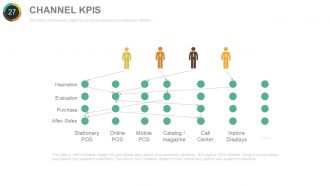
Slide 27: This is Channel KPIS slide showing- Stationary POS, Online POS, Mobile POS, Catalog / magazine, Call Center, Instore Displays, Inspiration, Evaluation, Purchase, After -Sales.
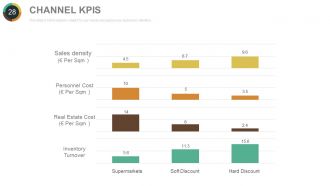
Slide 28: This slide also shows Channel KPIS on the basis of- Sales density (€ Per Sqm ), Personnel Cost (€ Per Sqm ), Real Estate Cost (€ Per Sqm ), Inventory Turnover.
Slide 29: This slide shows Partner Sales with cloud imagery. It also shows- Marketing Literature, Sales Tools, Channel Incentives, Product Promotions, Deal Registration, News & Events.
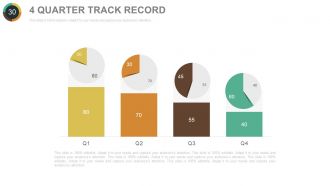
Slide 30: This slide displays 4 Quarter Track Record in charts and graphs.
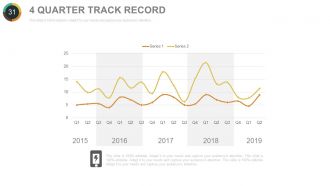
Slide 31: This slide also shows 4 Quarter Track Record graph.
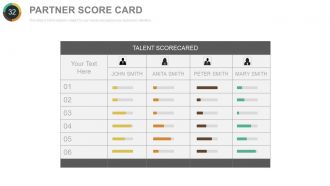
Slide 32: This is Partner Score Card slide showing Talent Scorecard.
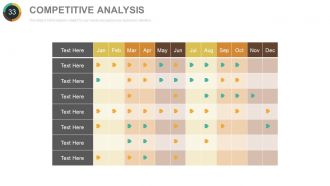
Slide 33: This slide presents Competitive Analysis.
Slide 34: This slide also presents Competitive Analysis in a graphical form.
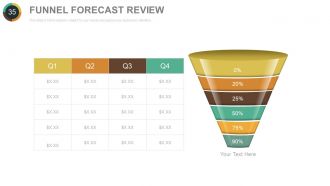
Slide 35: This slide presents Funnel Forecast Review. You can add text as per your need.
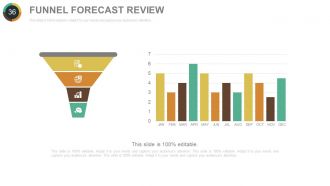
Slide 36: This slide also shows Funnel Forecast Review.
Slide 37: This slide shows Critical Opportunity Review.
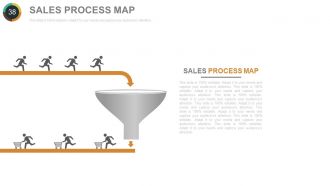
Slide 38: This is Sales Process Map slide in people silhouettes and funnel imagery to go with.
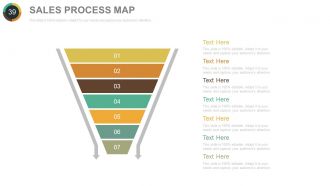
Slide 39: This slide also shows Sales Process Map in a funnel form with text boxes. You can add information as per your requirement.
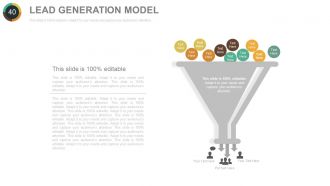
Slide 40: This slide presents Lead Generation Model with funnel imagery and text boxes.
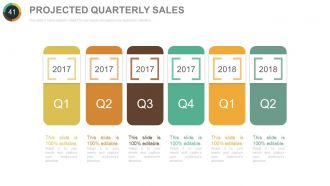
Slide 41: This slide shows Projected Quarterly Sales. Use this slide to show your own quarterly sales.
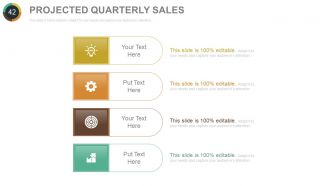
Slide 42: This slide also shows Projected Quarterly Sales with icon imagery and text boxes.
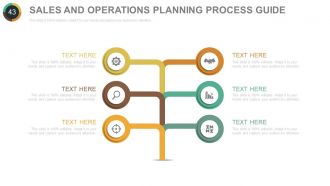
Slide 43: This slide shows Sales And Operations Planning Process Guide. We have provided few text boxes for you to add relevant information.
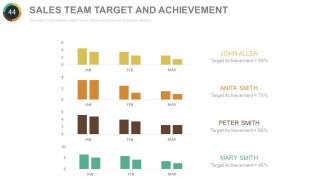
Slide 44: This slide shows Sales Team Target And Achievement bar graph. Present your own data in a graphical form form.
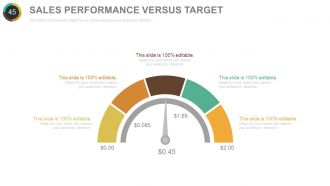
Slide 45: This is Sales Performance Versus Target slide with metric imagery. You can add your own sales performace and target stats in this slide and compare the two accordingly.
Slide 46: This slide is titled Additional Slides to move ahead. You can alter the content as per need.
Slide 47: This slide showcases Our Team with name, designation etc. to fill.
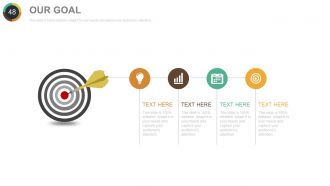
Slide 48: This is Our Goal slide with target and arrow imagery. Use it to state your goals.
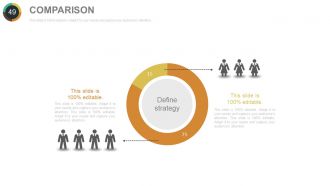
Slide 49: This slide showcases Comparison of two entities- Male and Female.
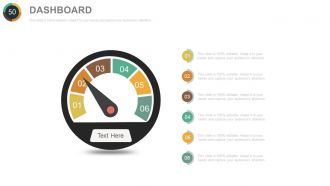
Slide 50: This is Dashboard slide to show metrics, KPIs etc.
Slide 51: This is a Location slide to show global growth, presence etc. on a world map image.
Slide 52: This is a Timeline slide to present important dates, journey, evolution, milestones etc.
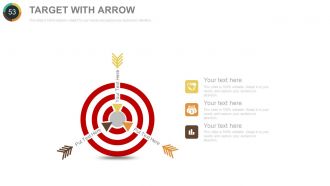
Slide 53: This is Target With Arrow image slide. Use it to state your targets, goals etc.
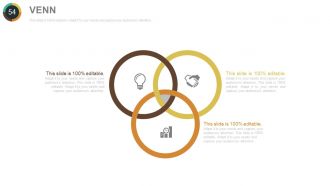
Slide 54: This is a Venn diagram image slide to show information, specifications etc.
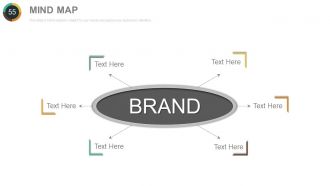
Slide 55: This is a Mind Map slide to show behavioral segmentation, information or anything relative.
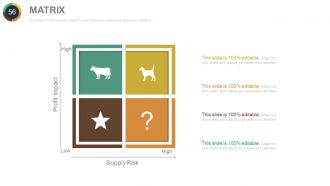
Slide 56: This is a MATRIX slide with High and Low parameters.
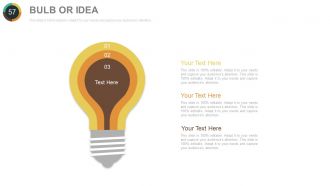
Slide 57: This is a Bulb or Idea slide to state a new idea or highlight specifications/ information etc.
Slide 58: This slide shows a Magnifier Glass image with text boxes.
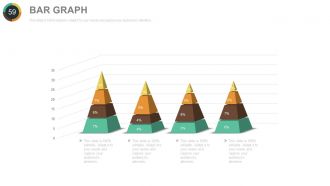
Slide 59: This slide shows a creative Bar Graph to show product comparison, growth etc.
Slide 60: This is a Thank You slide for acknowledgement or to end the presentation.
Quarterly sales performance review powerpoint presentation with slides with all 60 slides:
The final image generated by our Quarterly Sales Performance Review Complete Powerpoint Deck With Slides is impressive. It ensures all the elements gel.
FAQs
The purpose of the Quarterly Sales Performance Review is to analyze and evaluate the company's sales performance over the past quarter.
The stages involved in the sales cycle are Awareness, Consideration, Purchase, Service, and Loyalty.
Some key sales performance metrics mentioned in the presentation are Trials, Closed Deals, Visitors, and Campaigns to drive traffic.
The Opportunity Score matrix is used to assess and evaluate sales opportunities and decide whether to Qualify (Sales Development), Pass to Sales, Scrap, or Nurture (Marketing) them.
The Competitive Analysis slide is used to analyze and evaluate competitors' performance in the market and identify areas of improvement for the company's products and services.
-
Easy to edit slides with easy to understand instructions.
-
Helpful product design for delivering presentation.
-
relevant and effective
highly resourceful aid for management decision making


