Project management steps powerpoint presentation slides
Project management is the key to success for any organization. Our content-ready project management ppt slides will guide you to achieve your organizational goals with ease. The project phases PPT covers many topics, including project brief, management team, progress summary, milestones achieved, execution plan, budget report, risk management report, project health, and issues report. Moreover, you will also get enlightened with related topics such as project governance model, project management life cycle, project management process, portfolio management, work breakdown structure, and project planning. It provides various methods and strategies so you can handle the company resources effectively. Beforehand planning reduces uncertainty and prepares you for the execution, so it is essential to plan your project well. Download project management steps presentation in order to execute the task successfully. All the steps and phases are based on the established methods in the market. Get them to put their differences aside with our Project Management Steps Powerpoint Presentation Slides. They will agree to disagree.
You must be logged in to download this presentation.
 Impress your
 audience
Editable
of Time
PowerPoint presentation slides
These graphics are 100% editable to your needs. 46 uniquely designed slides. Instantly download with just a single mouse click. Standard and widescreen compatibility for all devices. Can be opened with Google Slides also. Suitable for use by businessmen, team leaders, and firms. Premium Customer support service. The stages in this process are success, business, management, planning, project.
People who downloaded this PowerPoint presentation also viewed the following :
Content of this Powerpoint Presentation
Slide 1: This slide introduces Project Management Steps. State your company name and get started.
Slide 2: This is an Agenda Slide. State your agendas here.
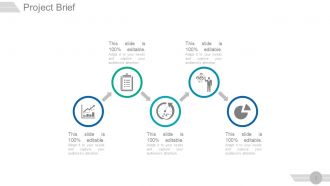
Slide 3: This slide presents Project brief with text boxes.
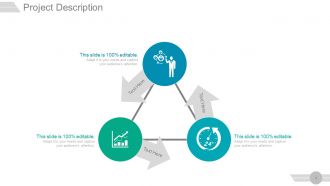
Slide 4: This slide showcases Project Description. Describe project nuances here.
Slide 5: This slide presents Project Management Team in Hierarchy form. Present team specifications, information etc. here.
Slide 6: This slide presents Project Progress Summary in terms of months.
Slide 7: This slide displays Project Progress Summary in terms of Iteration and months. The iteration processes include- Scheduling, Absences, Profile Management, Programme Management, Advanced Scheduling, Enrolment, Notification, Business Analytics, Midterm Presentation.
Slide 8: This slide shows Milestones achieved. State various milestones achieved by your company here.
Slide 9: This slide shows Milestones For The Next Reporting Period. State your milestones with tasks here.
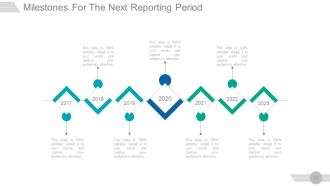
Slide 10: This slide also shows Milestones For The Next Reporting Period presented in a timeline form.
Slide 11: This is another side showing Milestones for the next reporting period in Gantt chart form.
Slide 12: This slide showcases the Impact Of Milestone Achievement / Non-Achievement with arrow and target imagery.
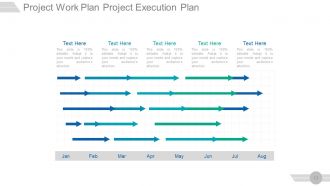
Slide 13: This slide presents Project Work Plan Project Execution Plan in a Gantt Chart form.
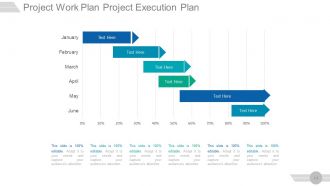
Slide 14: This slide shows another variation of Project Work Plan Project Execution Plan.
Slide 15: This slide presents the Budget Report in a tabular form with- INCURRED, PLANNED, FORECASTED.
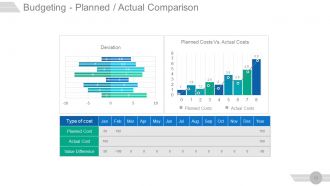
Slide 16: This is Budgeting - Planned / Actual Comparison slide showing- Planned Costs Vs. Actual Costs, Deviation.
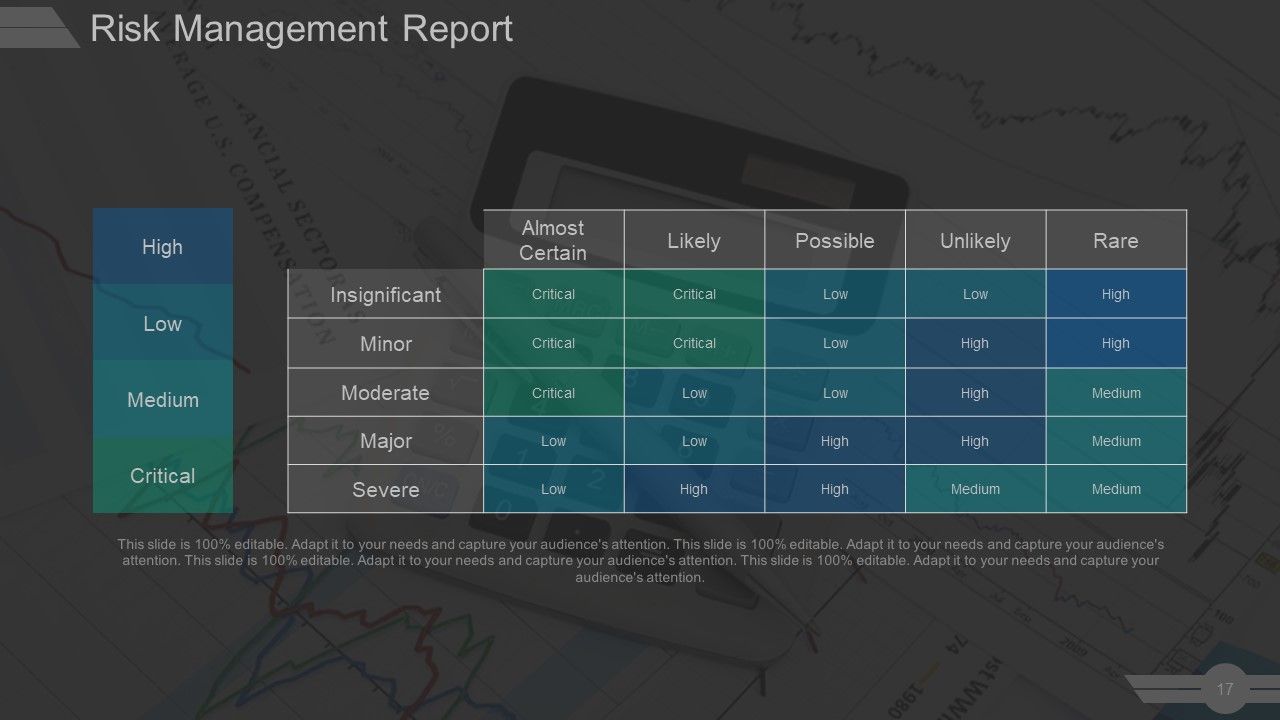
Slide 17: This slide presents Risk Management Report with four parameters- High, Low, Medium, Critical.
Slide 18: This slide also shows a Risk Management Report categorized into - Financial, Compliance, Operations, Strategic.
Slide 19: This slide shows Project Health Card. This card consists of the following aspects- SCHEDULE, RESOURCING, BUDGED, RISKS, ISSUES, BENEFITS. All of these aspects are further denoted by either Green, Yellow or Red dots. Since most of the aspects are marked with Green dots, the overall status of the project is GREEN.
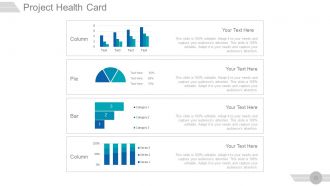
Slide 20: This slide also shows Project Health Card in a pie chart, column chart and bar graph form.
Slide 21: This slide presents Project Issues Report with issue description and status.
Slide 22: This slide is titled Additional Slides to move forward. You may change the slide content as per need.
Slide 23: This is Our Vision slide with text boxes. State your vision here.
Slide 24: This is Our Team slide. Mention name, designation etc. here.
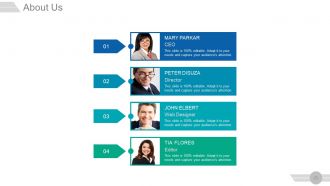
Slide 25: This is an About Us slide. Provide a brief introduction about company/ team here.
Slide 26: This slide shows Project Management Team flow chart.
Slide 27: This is Our Goal slide to state company goals, aspirations etc.
Slide 28: This is a Comparison slide to compare two products/ entities etc.
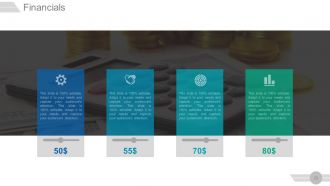
Slide 29: This is a Financial stats slide to state financial aspects etc.
Slide 30: This slide presents Quotes. Sate your inspirational quotes here. You may change the slide content as per need.
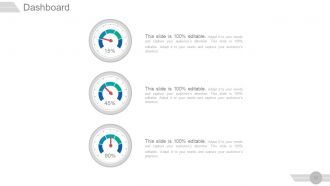
Slide 31: This is Dashboard slide to show information in percentages etc.
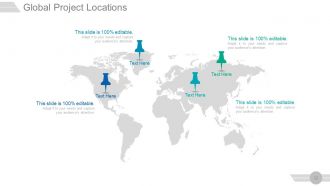
Slide 32: This slide showcases Global Project Locations with a World map and text boxes to make it explicit.
Slide 33: This slide displays Critical Notes to mark important events, information etc.
Slide 34: This slide shows Project Events Timeline with icons and text boxes.
Slide 35: This is a News Paper slide to show news, events, etc. You can change the slide contents as deemed fit.
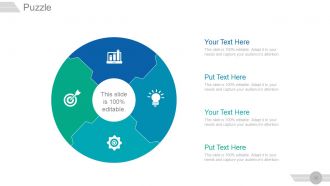
Slide 36: This is Puzzle Pieces slide to show information, specifications etc.
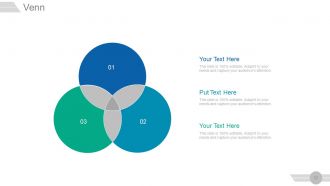
Slide 37: This is Venn diagram image slide to show information, specifications etc.
Slide 38: This is a Circular image slide to show information, specifications etc.
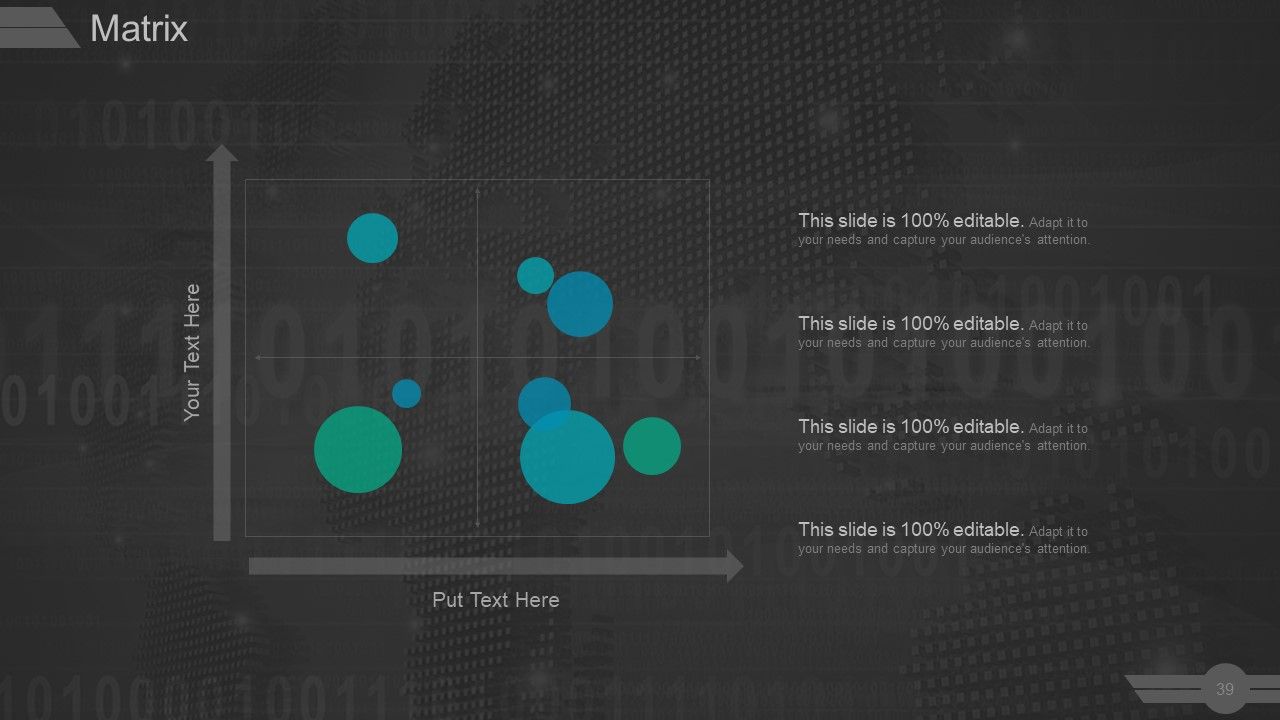
Slide 39: This is a Matrix slide. Put relevant comparing data in it.
Slide 40: This is a Lego blocks image slide to present information, specifications etc.
Slide 41: This is Silhouettes slide to present people specific information, specifications etc.
Slide 42: This is a Bulb or Idea slide to state a new idea or highlight specifications/ information etc.
Slide 43: This is a Magnifying glass image slide to show information, scoping aspects etc.
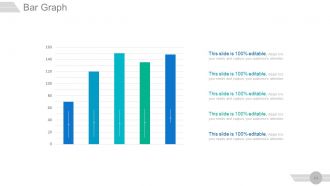
Slide 44: This is a Bar Graph slide to show product comparison, growth etc.
Slide 45: This is a Funnel image slide to show information, funneling aspects, specifications etc.
Slide 46: This is a Thank You slide with Address# street number, city, state, Contact Numbers, Email Address.
Project management steps powerpoint presentation slides with all 46 slides:
Get a grip over injuries with our Project Management Steps Powerpoint Presentation Slides. Initiate action to halt further harm.
FAQs
The Project Health Card is a visual representation of the project's progress and status. It evaluates the aspects of the project, such as schedule, resourcing, budget, risks, issues, and benefits. The green, yellow, and red dots denote the status of each aspect, and it is used by the project management team to assess the overall health of the project.
The Gantt Chart is a visual representation of the project's work plan and execution plan. It is a timeline that depicts the tasks, milestones, and dependencies of the project. The Gantt Chart is significant because it helps the project management team to schedule the project activities, allocate resources, track progress, and identify potential delays or bottlenecks.
Risk management is an essential aspect of project management that involves identifying, assessing, and mitigating potential risks that may impact the project's objectives. The Risk Management Report, categorized into financial, compliance, operations, and strategic, helps to assess and manage these risks. It is done by developing risk mitigation strategies and contingency plans, assigning ownership and responsibility for risks, and monitoring and reviewing risks throughout the project lifecycle.
The Budget Report is a tabular representation of the project's incurred, planned, and forecasted costs. It helps to track and manage the project's financial aspects, including budget allocation, resource utilization, and cost control. The Budgeting-Planned/Actual Comparison slide compares the planned costs to the actual costs, providing a deviation analysis that helps in identifying areas of over or under spending.
Project Milestones are significant achievements or events in the project that are used to track and measure progress towards the project objectives. They help to break down the project into smaller, manageable tasks, enabling the project management team to plan and schedule activities efficiently. The Milestones achieved, Milestones for the next reporting period, and Impact of Milestone Achievement/Non-Achievement slides help to track and communicate the project's progress and achievements to stakeholders.
-
Awesomely designed templates, Easy to understand.
-
Illustrative design with editable content. Exceptional value for money. Highly pleased with the product.


