Strategic Planning Gap Analysis Powerpoint Presentation Slides
To build and present an exceptional gap analysis PowerPoint presentation can be a challenge on its own. To save you time and assist you with this our team as come up with a 53 slides ready-made Strategic Planning Gap Analysis Powerpoint Presentation Slides. These gap analysis PowerPoint slides are well suited for all businesses as it acts as an important tool to figure out the planning required for improvement. Best part is that all our slides are fully editable and can be edited as per your need. This gap analysis template PowerPoint has slides like gap analysis overview, gap analysis procedure, gap analysis graph, current state analysis, financial comparison, revenue versus target, fit gap analysis, growth share matrix, servqual model, swot analysis, 6Ms fishbone analysis, and many more. Furthermore, our PPT presentation slides will aid you to put your point across easily and for quick solution of a problem. Additionally, to cover all the necessary aspects here we have included template designs like our team, mission and vision, about us, our goals, comparison, quotes, dashboard, location, post it notes, timeline, hierarchy and various charts. In short, you can add value to your business by comprehensively discussing the required strategic plans with help of our pre-made gap analysis PowerPoint slides. So, quickly download Strategic Planning Gap Analysis Powerpoint Presentation Slides and present an one off visual PPT presentation. Insist on compliance with our Strategic Planning Gap Analysis Powerpoint Presentation Slides. Ensure adherence to directions.
You must be logged in to download this presentation.
 Impress your
 audience
Editable
of Time
PowerPoint presentation slides
Download our professional Strategic Planning Gap Analysis Powerpoint Presentation Slides comprising extensively researched content and professional design layouts. Don’t waste hours fiddling with PowerPoint toolbars and finding professional PowerPoint templates. This complete presentation saves hours of your time. Comprising a total of 53 slides, the PowerPoint presentation is a visual masterpiece with professional PPT templates, data-driven graphs, charts and tables, a beautiful theme, impressive slide designs, icons, imagery and more. It is fully editable so that you can make changes to colors, data and fonts if you need to. Just enter your text in the placeholders provided and rock the meeting or conference you are presenting at.
People who downloaded this PowerPoint presentation also viewed the following :
Content of this Powerpoint Presentation
Slide 1: This is an introuctory slide for Strategic Planning Gap Analysis. State Your Company Name and begin.
Slide 2: This is an Agenda slide. State your agendas here.
Slide 3: This slide showcases Gap Analysis Overview consisting of- Basic Process For Gap Analysis Desired State Where Do We Want To Go? Current State Where Are We Now? Gap Analysis How Do We Do That? What Do We Need To Do Get There?
Slide 4: This slide presents a Gap Analysis Procedure showcasing- Time Frame, Your Goal, Current Realty, Gap Analysis, The Plan Quarterly Goal.
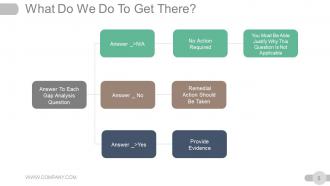
Slide 5: This slide displays What Do We Do To Get There with the min subheading-Answer To Each Gap Analysis Question divided into: Provide Evidence Answer _>Yes You Most Be Able Justify Why This Question Is Not Applicable No Action Required Answer _>N/A Remedial Action Should Be Taken
Slide 6: This slide shows How Do We Do That with the following points- Gap Identification, Cause Investigation, Select Action, Action Implementation, Study The Result, Standardize And Plan Continuous Improvement, PLAN, ACT, CHECK.
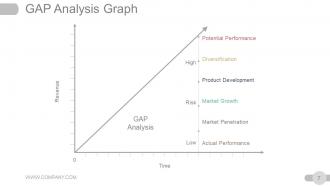
Slide 7: This slide presents a GAP Analysis Graph displaying- Potential Performance Diversification Product Development Market Growth Market Penetration Actual Performance in terms of- Revenue, Time, Low, High, Risk.
Slide 8: This slide shows Current State Analysis Company's Mission. State related aspects here.
Slide 9: This slide presents Current State Analysis Company Goals. State respective goals here.
Slide 10: This slide shows Current State Analysis Our Market Share. Present it here.
Slide 11: This slide showcases Current State Analysis Financial Comparison in bar graph form.
Slide 12: This slide shows Current State Analysis- Revenue Versus Target in bar graph form.
Slide 13: This slide presents a Basic Gap Analysis Chart with the following points- What exactly is the gap? What are the consequences of the gap? What is timing? Who is responsible? What are the option? What are the cost?
Slide 14: This slide presents a Gap Analysis Template with the following points- Business Requirement, Describe Exiting Situation, Gap Between Exiting & New, New Capabilities Needed To Reduce Or Eliminate Gap, Issues & Risks.
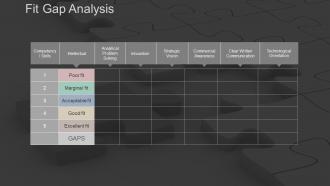
Slide 15: This slide shows a Fit Gap Analysis in tabular form.
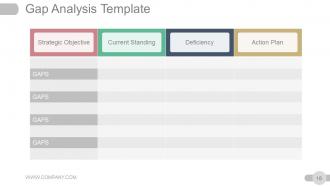
Slide 16: This slide presents a Gap Analysis Template with the following points- Strategic Objective, Current Standing, Deficiency, Action Plan.
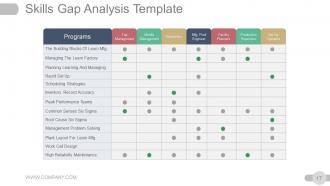
Slide 17: This slide presents a Skills Gap Analysis Template with the following points- Strategic Objective, Programs, Top Management, Middle Management, Schedulers, Mfg. Prod Engineer, Facility Planners, Production Supervisor, Set Up Operative.
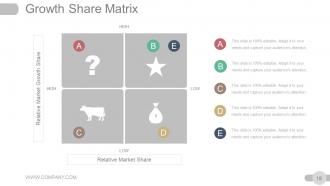
Slide 18: This slide shows a Growth Share Matrix displaying- Relative Market Share, Relative Market Growth Share.
Slide 19: This slide shows an Ansoff Product Matrix displaying- Market Development, Market Penetration, Diversification, Product Development.
Slide 20: This slide shows Gap Analysis Tool- Servqual with- Assurance, Tangible, Reliability, Responsiveness, Empathy.
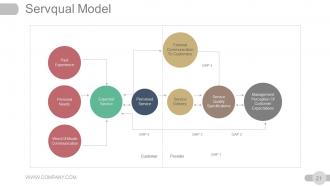
Slide 21: This slide displays a Servqual Model showing- Customer, Provider, GAP, External Communication To Customers, Word Of Mouth Communication, Past Experience, Management Perception Of Customer Expectations, Personal Needs, Perceived Service, Service Delivery, Service Quality Specifications, Expected Service.
Slide 22: This slide shows Calculation Of Servqual Scores with- Statement, Expectation Score, Perception Score, Gap Score, Average For Dimension.
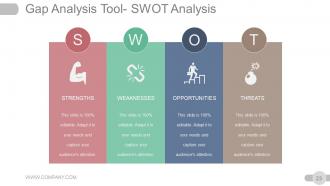
Slide 23: This slide shows Gap Analysis Tool- SWOT Analysis. State it in details here.
Slide 24: This slide shows Gap Analysis Tool- Fishbone Analysis 6 MS with the following points- Material, Maintenance, Mother Nature, Machinery, Manpower, Method.
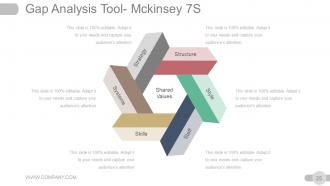
Slide 25: This slide presents Gap Analysis Tool- Mckinsey 7S namely- Shared Values, Structure, Style, Staff, Skills, Systems, Strategy.
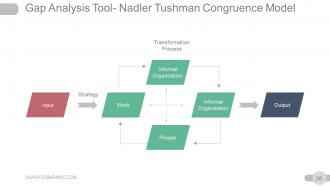
Slide 26: This slide shows Gap Analysis Tool- Nadler Tushman Congruence Model displaying Strategy, Transformation Process, Work, Informal Organization, Informal Organization, People, Output, Input.
Slide 27: This slide is titled Additional Slides to move forward. You can change the content as per need.
Slide 28: This slide presents Mission and Vision showing Vision and Mission aspects to be stated.
Slide 29: This slide presents Our team with names, designation and image boxes.
Slide 30: This is an About Us slide. State company/team specifications, solutions here.
Slide 31: This is Our Goal slide. State goals, targets etc. here.
Slide 32: This is a Comparison slide to compare product/enitities etc.
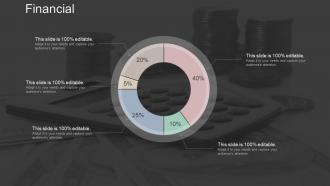
Slide 33: This is a Financial Scores slide. State financial aspects, etc. here.
Slide 34: This is a Quotes slide to convey company's message, beliefs etc. You may change the slide content as per need.
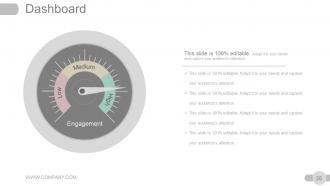
Slide 35: This is a Dashboard slide. Present metrics, Kpis etc. here.
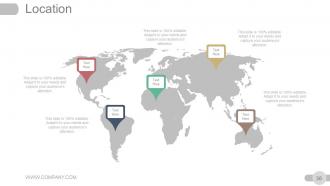
Slide 36: This is a Location slide to show global presence, growth etc.
Slide 37: This slide presents a Timeline. Jot down your highlights, or present milestones etc. here.
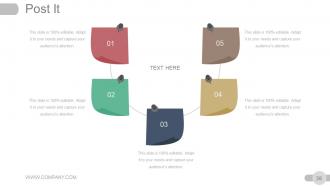
Slide 38: This slide showcases Post It notes. State important events, information etc. here.
Slide 39: This slide showcases Newspaper image. State important events, information etc. here.
Slide 40: This slide showcases Puzzle imagery. Present information, specifications etc. here.
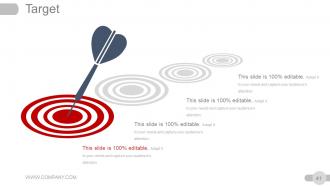
Slide 41: This slide shows Target image with text boxes. Present information, specifications etc. here.
Slide 42: This slide presents a Circular diagram with text boxes. Present information, specifications etc. here.
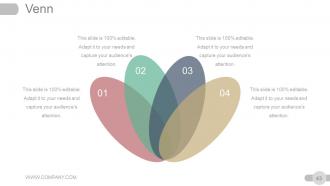
Slide 43: This is a Venn Diagram image slide. State information, specifications etc. here.
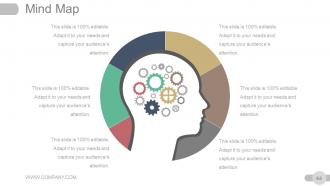
Slide 44: This is a Mind Map image slide. State information, specifications etc. here.
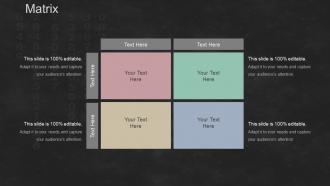
Slide 45: This slide presents a Matrix. Present information, specifications etc. here.
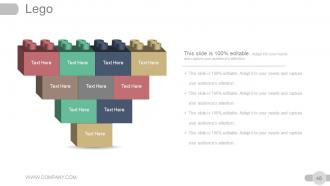
Slide 46: This is a Lego image slide. State information, specifications etc. here.
Slide 47: This is a Silhouettes image slide. State people related information, specifications, solutions etc. here.
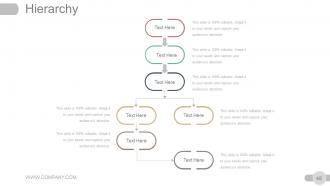
Slide 48: This slide presents a Hierarchy image. State information, specifications etc. here.
Slide 49: This is an Idea & Bulb image slide. State information, specifications, innovative aspects etc. here.
Slide 50: This is a Magnifying glass image slide. State information, specifications etc. here.
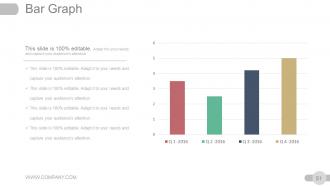
Slide 51: This is a Bar Graph slide to show product/entity comparison.
Slide 52: This is a Funnel image slide to show product/entity information, funneling aspects etc.
Slide 53: This is a Thank You slide with Email, Address# street number, city, state, Contact Numbers.
Strategic Planning Gap Analysis Powerpoint Presentation Slides with all 53 slides:
Acquire the go ahead with our Strategic Planning Gap Analysis Powerpoint Presentation Slides. You are bound to be given the all clear.
-
Enough space for editing and adding your own content.
-
Design layout is very impressive.


