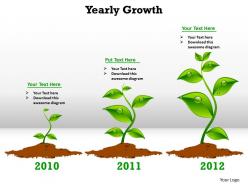
Yearly growth shown by plants growing from seedling to fully grown powerpoint diagram templates graphics 712
Our yearly growth shown by plants growing from seedling to fully grown powerpoint diagram templates graphics 712 have a captivating effect. Leave your audience spellbound with your brilliance.
You must be logged in to download this presentation.
 Impress your
 audience
Editable
of Time
PowerPoint presentation slides
These high quality, editable pre-designed yearly growth shown by plants growing from seedling to fully grown powerpoint diagram templates graphics 712 powerpoint slides and powerpoint templates have been carefully created by our professional team to help you impress your audience. Each graphic in every powerpoint slide is vector based and is 100% editable in powerpoint.
People who downloaded this PowerPoint presentation also viewed the following :
Content of this Powerpoint Presentation
Description:
The image displays a PowerPoint slide titled "Yearly Growth," featuring a metaphorical representation of growth in the form of plants sprouting from the ground and increasing in size by the year. Each plant corresponds to a year from 2010 to 2012, progressively getting larger as a visual symbol of growth over time.
The slide allows for customization by embedding text in specific areas. The bottom part provides spaces where years are marked, which can be updated to reflect the timeline relevant to the presentation. Each plant has allocated bullet points where detailed information or achievements of respective years can be added. The left plant, corresponding to 2010, has one bullet point where the presenter can mention a starting point or an initial achievement. The middle plant, representing 2011, has two bullet points for more in-depth details or developments. The rightmost plant, for 2012, offers three bullet points, suggesting the most significant growth or success in this period.
Use Cases:
Here are seven industries where this slide can be applied, along with specific use cases, presenters, and audiences:
1. Agriculture:
Use: Illustrating annual crop yield increase
Presenter: Agricultural Scientist
Audience: Farmers and Agribusiness Investors
2. Financial Services:
Use: Presenting yearly revenue or profit growth
Presenter: Chief Financial Officer
Audience: Shareholders and Analysts
3. Education:
Use: Showing graduation rates or test score advancements
Presenter: Dean or School Administrator
Audience: School Board and Education Stakeholders
4. Healthcare:
Use: Demonstrating patient recovery rates or clinical trial phases
Presenter: Healthcare Administrator or Research Lead
Audience: Medical Staff and Investors
5. Renewable Energy:
Use: Depicting annual increase in energy production or efficiency
Presenter: Energy Analyst or Company Executive
Audience: Stakeholders and Environmental Agencies
6. Retail:
Use: Showcasing growth in store numbers or annual sales
Presenter: Retail Manager or Business Development Executive
Audience: Retail Teams and Investors
7. Technology:
Use: Outlining year-on-year growth in user base or product releases
Presenter: Chief Technology Officer
Audience: Investors and Technology Enthusiasts
Yearly growth shown by plants growing from seedling to fully grown powerpoint diagram templates graphics 712 with all 4 slides:
Convey your ideas with elan. Use our yearly growth shown by plants growing from seedling to fully grown powerpoint diagram templates graphics 712 as the medium.
-
Unique research projects to present in meeting.
-
Best Representation of topics, really appreciable.


