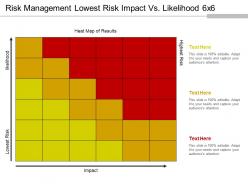
Risk management lowest risk impact vs likelihood 6x6 ppt example file
Use this risk matrix PowerPoint template design for evaluating, identifying, and prioritizing the risks. The three-color patterns such as yellow, orange and red in the block diagram of the risk impact vs likelihood template show the severity of the risk factors. Yellow represents low-risk factors, orange shows mild risk factors and red shows high-risk factors. You can insert your own data in the risk management matrix design PPT slide and describe how to minimize, monitor, as well as control the probability or impact of uncertain events. Also, you can illustrate how to maximize the realization of opportunities. By using the risk impact vs likelihood presentation template, you can demonstrate multiple parameters that affect business planning and you can explain such parameters through the color plans vividly.
You must be logged in to download this presentation.
 Impress your
 audience
Editable
of Time
PowerPoint presentation slides
Presenting Risk Management Lowest Risk Impact Vs Likelihood 6x6 PPT Example File. Modify the color patterns as per the requirement to present various marketing risk parameters. The slide is adaptable with Google Slides. The risk matrix slide's quality remains the same, even after making some changes in it such as color, font type, font size & color, aspect ratio, etc. You can download the 6x6 matrix diagram template easily and convert into JPEG and PDF.
People who downloaded this PowerPoint presentation also viewed the following :
Risk management lowest risk impact vs likelihood 6x6 ppt example file with all 5 slides:
Our Risk Management Lowest Risk Impact Vs Likelihood 6x6 Ppt Example File ensure the gaps are few and far between. It will cut down the intervals.
-
It saves your time and decrease your efforts in half.
-
Innovative and attractive designs.


