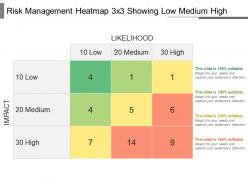
Risk management heatmap 3 x 3 showing low medium high powerpoint shapes
Define the risk appetite of your business with our risk management heatmap PowerPoint design. Use this risk heatmap PPT template to represent the qualitative as well as quantitative evaluation of your business risk. It helps in visually describing the probability of the particular risk occurrence and its impact on your business. The graphical representation through this colored level of risks PPT image design will help in introducing the risk mitigation strategies for the company. You can also define the various benefits of managing the risk map for the business with this enterprise risk management PPT slide diagram. It helps your management to take strategic business decisions and offers more precision to your risk assessment process. It will also bring efficiency to your business operations while managing its financial stability. Therefore, just simply click on the download link given below to start working over this risk assessment matrix PPT slide design. Rejuvenate your team with our Risk Management Heatmap 3 X 3 Showing Low Medium High Powerpoint Shapes. Get them behind you with full sincerity.
You must be logged in to download this presentation.
 Impress your
 audience
Editable
of Time
PowerPoint presentation slides
Presenting risk management heatmap PowerPoint design. This PPT template is quite voluminous in nature which is quite comfortable for the business analyst etc. The various features of this Presentation graphic is revamp able such as the font, font size, colors, design, words etc. This PPT graphic can be easily structured into different forms as PDF or JPG. This PPT design also provides an option to insert the relevant captions or subheadings also.
People who downloaded this PowerPoint presentation also viewed the following :
Content of this Powerpoint Presentation
Description:
The image shows a Risk Management Heatmap with a 3x3 matrix layout indicating different levels of risk based on two dimensions – Likelihood and Impact. Both the Likelihood and Impact are ranked on a scale from Low (10) to High (30). The heatmap uses a color-coding scheme to visualize the levels of risk: green for low risk, yellow for medium risk, and red for high risk. Within each colored square are numbers which likely represent either the quantity of risks identified at that level or some form of risk score.
Use Cases:
This heatmap is useful for visualizing and prioritizing risks, and it can be applied across various industries for risk assessment purposes:
1. Financial Services:
Use: Identifying and categorizing investment risks
Presenter: Risk Analyst
Audience: Investment Managers
2. Healthcare:
Use: Assessing patient safety and healthcare delivery risks
Presenter: Hospital Administrator
Audience: Medical Staff
3. Information Technology:
Use: Evaluating cybersecurity threat levels
Presenter: IT Security Manager
Audience: IT Department
4. Manufacturing:
Use: Analyzing risk in supply chain management
Presenter: Operations Supervisor
Audience: Product Development Team
5. Energy Sector:
Use: Mapping risks associated with energy production and distribution
Presenter: Risk Assessment Officer
Audience: Utility Company Executives
6. Construction:
Use: Project risk management and safety hazard assessment
Presenter: Safety Officer
Audience: Construction Project Team
7. Consulting:
Use: Providing clients with strategic risk evaluation services
Presenter: Strategy Consultant
Audience: Corporate Executives
Risk management heatmap 3 x 3 showing low medium high powerpoint shapes with all 5 slides:
Find an essential aid in our Risk Management Heatmap 3 X 3 Showing Low Medium High Powerpoint Shapes. They deliver critical assistance.
-
Great designs, Easily Editable.
-
Helpful product design for delivering presentation.


