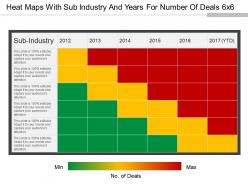
Heat maps with sub industry and years for number of deals 6x6 powerpoint show
The heat map with sub-industry and years for a number of deals 6x6 Powerpoint show template has been shaped in such a way as to allow your business or company to carefully study the relationship between your business and the sub-industries in terms of the number of deals made over the years. This could, in turn, help your business to carefully prepare and project the requisite data needed to study the trends and figures of the past performances of the deals done by your company. In this PowerPoint slide, you may edit the details of the sub industries on the left side. The slide has been color-coded for your assistance. Green means a low number of deals, yellow color means a medium number of deals, and red color means a high number of deals. The PPT template has been made in a 6x6 table format and is fully editable in terms of sub-industry, years and the color coding to best suit your company's needs. Feed them with the facts to chew on with our Heat Maps With Sub Industry And Years For Number Of Deals 6x6 Powerpoint Show. Generate fodder for their brains.
You must be logged in to download this presentation.
 Impress your
 audience
Editable
of Time
PowerPoint presentation slides
Presenting our heat maps with sub-industry and years for a number of deals 6x6 powerpoint show. Incorporate your corporate logo or trademark for your best customers. Available in fullscreen version 16:9 and standard version 4:3 for your proper customization after downloading. This PPT slide is cooperative with Google Slides and subsequent downloading you can use it in full version. Fit for use by managers, employees, and organizations for financial concerns and sales related presentations. We have shown a high-quality design which does not deteriorate in quality when edited or projected on a widescreen. Include your company data in this predesigned PPT format just by following a few simple steps.
People who downloaded this PowerPoint presentation also viewed the following :
Heat maps with sub industry and years for number of deals 6x6 powerpoint show with all 5 slides:
Folks feel the fizz with our Heat Maps With Sub Industry And Years For Number Of Deals 6x6 Powerpoint Show. They begin to bubble with excitement.
-
Awesome use of colors and designs in product templates.
-
Graphics are very appealing to eyes.


