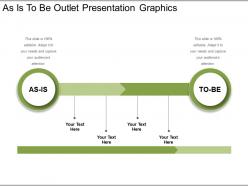
As is to be outlet presentation graphics
Present the process of Gap analysis with ease with this As Is To Be Outlet Presentation Graphics template. Elucidate the relationship between the expectation and reality with this as is to be outlet presentation graphics PowerPoint presentation. Employ this performance analysis diagram to create a balance between the current and future state of affairs of your organization. This process improvement template will assist you in determining, documenting and eliminating the difference between business requirements and current capabilities. Take advantage of this process mapping slideshow to enable optimal allocation and integration of the inputs (resources) and the current allocation-level. This performance analysis presentation will unveil the areas that should be improved to enhance the viability of the analysis process. Include a fishbone diagram with this structuring As-is process icon for the root analysis and identification of improvement opportunities in the organization. Thus download this Gap analysis infographic to achieve excellence in different levels such as strategic level and operational level.
You must be logged in to download this presentation.
 Impress your
 audience
Editable
of Time
PowerPoint presentation slides
Presenting As Is To Be Outlet Presentation Graphics. This presentation template is professionally designed and is easily editable in PowerPoint. Font type, font size, colors of the diagram, and background color can be altered according to the requirement. Having full compatibility with Google Slides, it can be saved in multiple image formats such as JPG, PNG or document formats such as PDF without any problem. High-quality graphics ensure that there is no room for distortion.
People who downloaded this PowerPoint presentation also viewed the following :
Content of this Powerpoint Presentation
Description:
The image displays a PowerPoint slide titled "As Is To Be Outlet Presentation Graphics." It is designed to illustrate the current state ("As-Is") versus the desired future state ("To-Be") of a process, situation, or business strategy. The slide is divided into two halves, with the left side labeled "AS-IS" and the right side labeled "TO-BE," each with a place for text beneath them to describe the current and desired states.
Use Cases:
This type of slide can be used across various industries for strategic planning, process improvement, and change management presentations:
1. Management Consulting:
Use: Showcasing current versus desired business processes.
Presenter: Strategy Consultant.
Audience: Business executives, stakeholders.
2. IT Services:
Use: Demonstrating current IT infrastructure versus planned upgrades.
Presenter: IT Architect.
Audience: IT department, management.
3. Manufacturing:
Use: Comparing current production line efficiency to potential improvements.
Presenter: Operations Manager.
Audience: Plant workers, process engineers.
4. Healthcare:
Use: Outlining current patient care procedures and proposed enhancements.
Presenter: Healthcare Administrator.
Audience: Medical staff, hospital management.
5. Retail:
Use: Visualizing current store layouts versus future redesigns.
Presenter: Retail Planner.
Audience: Store managers, design team.
6. Financial Services:
Use: Financial process optimization, from current practices to streamlined procedures.
Presenter: Financial Analyst.
Audience: Finance team, compliance officers.
7. Education:
Use: Presenting current educational programs and envisaging future curriculum developments.
Presenter: Academic Director.
Audience: Educators, curriculum developers.
As is to be outlet presentation graphics with all 5 slides:
Convince folks to be good to guests with our As Is To Be Outlet Presentation Graphics. Encourage them to be hospitable.
-
Qualitative and comprehensive slides.
-
Illustrative design with editable content. Exceptional value for money. Highly pleased with the product.


