Investor Profile Portfolio Powerpoint Presentation Slides
Are you stressed about pitching your business plan to shareholders? No issues, our content ready investor profile portfolio PowerPoint presentation slides are ideal for you. This content ready investor personality profile PPT templates contain slides on various topics like company stockholder update, business model canvas, annual run rate, revenue model, financial deals, production costs, investment scorecard, competitive analysis, market dynamics, market budget, value chain, operating excellence, financial highlights, performance dashboards, venture timelines, organic growth etc. With the help of our investor’s scorecard PowerPoint presentation slides, investment bankers can explain to senior management that who are the potential stockholders for the company. This investors summary PPT templates can be used for the related topics like shareholder’s profile, portfolio manager, portfolio investment, portfolio investment strategy, portfolio management and investor updates, investors outline, stakeholder’s overview etc. Our predesigned investor profile portfolio PowerPoint presentation are fully editable and can be customized according to your needs. Download these slides and impress your stakeholders. Draw in the audience with our Investor Profile Portfolio Powerpoint Presentation Slides. Your ability will come to the fore.
You must be logged in to download this presentation.
 Impress your
 audience
Editable
of Time
PowerPoint presentation slides
Slides are editable in PowerPoint. This presentation has 60 slides. Downloads are risk-free. This PPT is useful for the investment bankers and consultants. Templates are compatible with Google Slides. Customers have Prime support. PPT works well in standard and widescreen.This is a one stage process. The stages in this process are investor profile portfolio, financial analysis, financial services, business plan development, cost reduction strategies, strategic planning, strategic management.
People who downloaded this PowerPoint presentation also viewed the following :
Content of this Powerpoint Presentation
Slide 1: This slide showcase about Investor profile. State Your Company Name and get started.
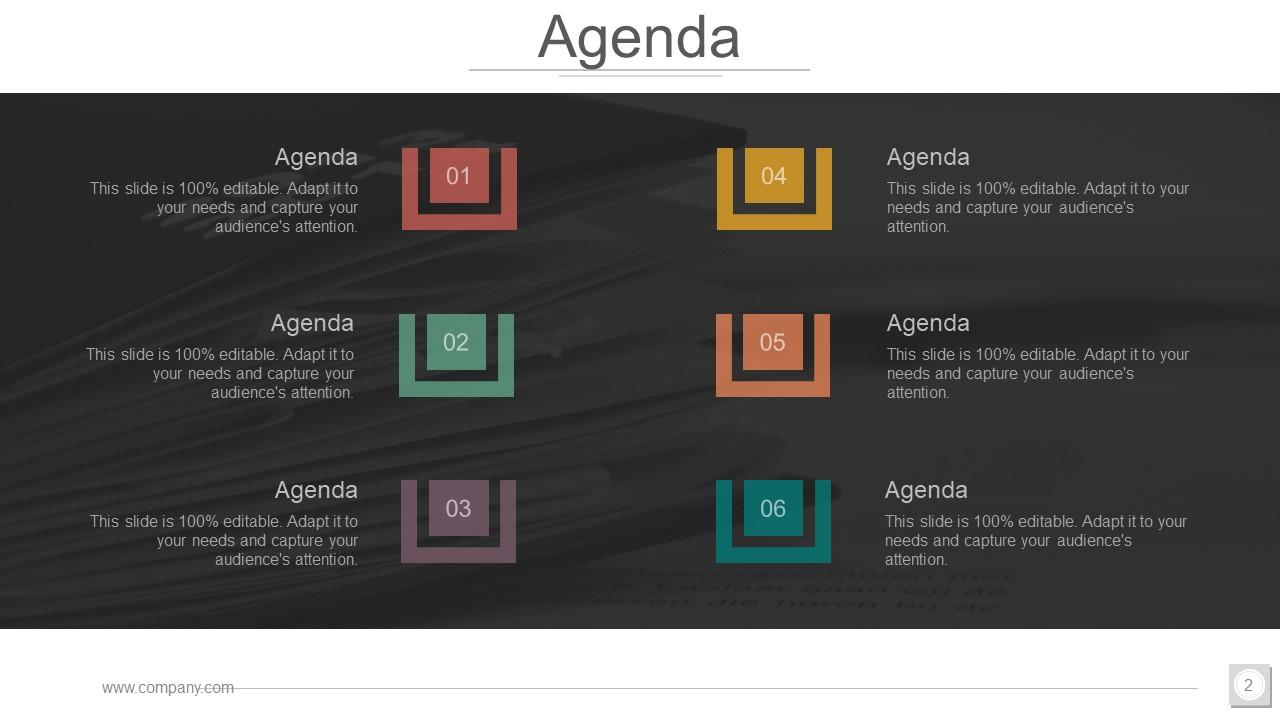
Slide 2: This is an Agenda slide. State your agendas here.
Slide 3: This slide shows Company Investor Update. You can update your name, position and email address.
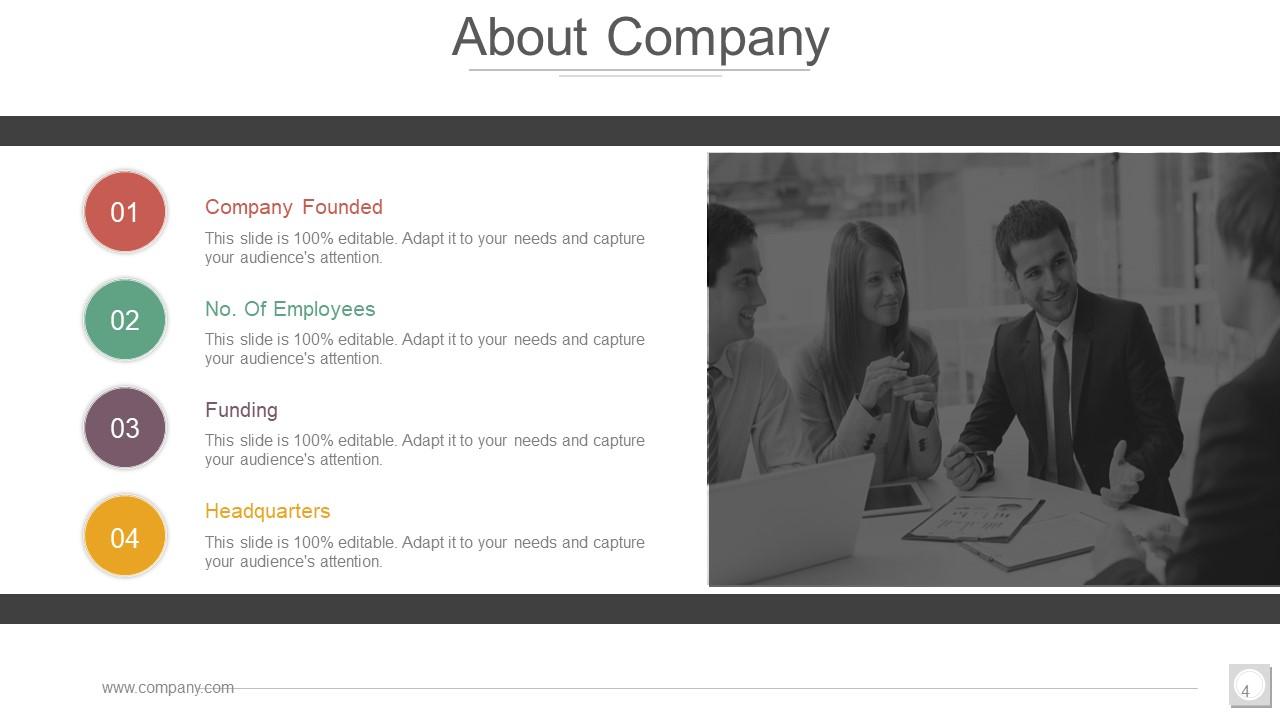
Slide 4: This is an About company slide consisting of Company Founded, No. Of Employees, Funding.
Slide 5: This is an Our Team slide with Name and Designation.
Slide 6: This slide is Our Team organisational flow chart. You can edit and make the best use of it.
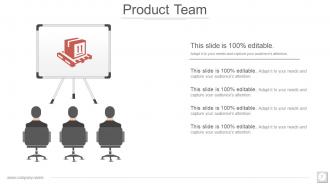
Slide 7: This slide displays Product Team with a relevant background image.
Slide 8: This slide presents Growth Team with a bar graph showing increasing growth.
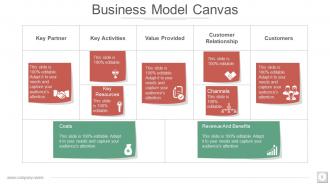
Slide 9: This slide presents Business Model Canvas. It includes key partners, key activities, customer relationship etc.
Slide 10: This slide showcases Business Model Canvas. This is further categorize into various branches like as- Offering, Sustainability, Monetization.
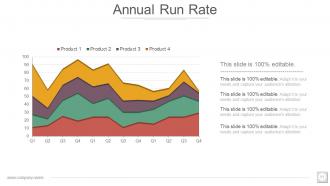
Slide 11: This slide displays Annual Run Rate. You can edit or modify according to your requirement.
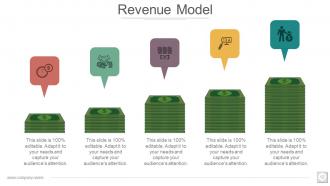
Slide 12: This slide showcase Revenue Model. You can modify according to your requirement.
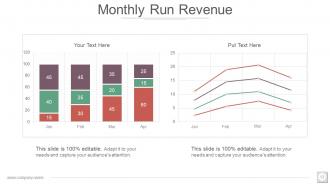
Slide 13: This slide presents Monthly Run Revenue. It shows bar chart and line chart with four months and revenue percentage.
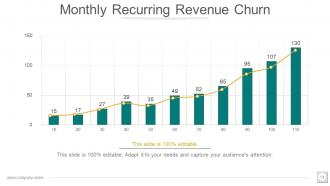
Slide 14: This slide presents Monthly Recurring Revenue Churn in form of bar chart.You can show the business growth
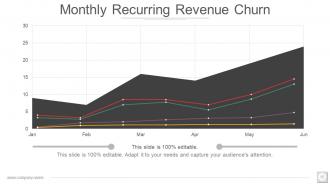
Slide 15: This slide displays Monthly Recurring Revenue Churn chart.
Slide 16: This slide showcases Investment Deals table. You can put your details according to requirement.
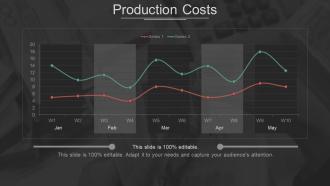
Slide 17: This slide shows Production Costs with months and two kind of series given.
Slide 18: This slide displays Production Costs. Listing are options in which investment is to be done.
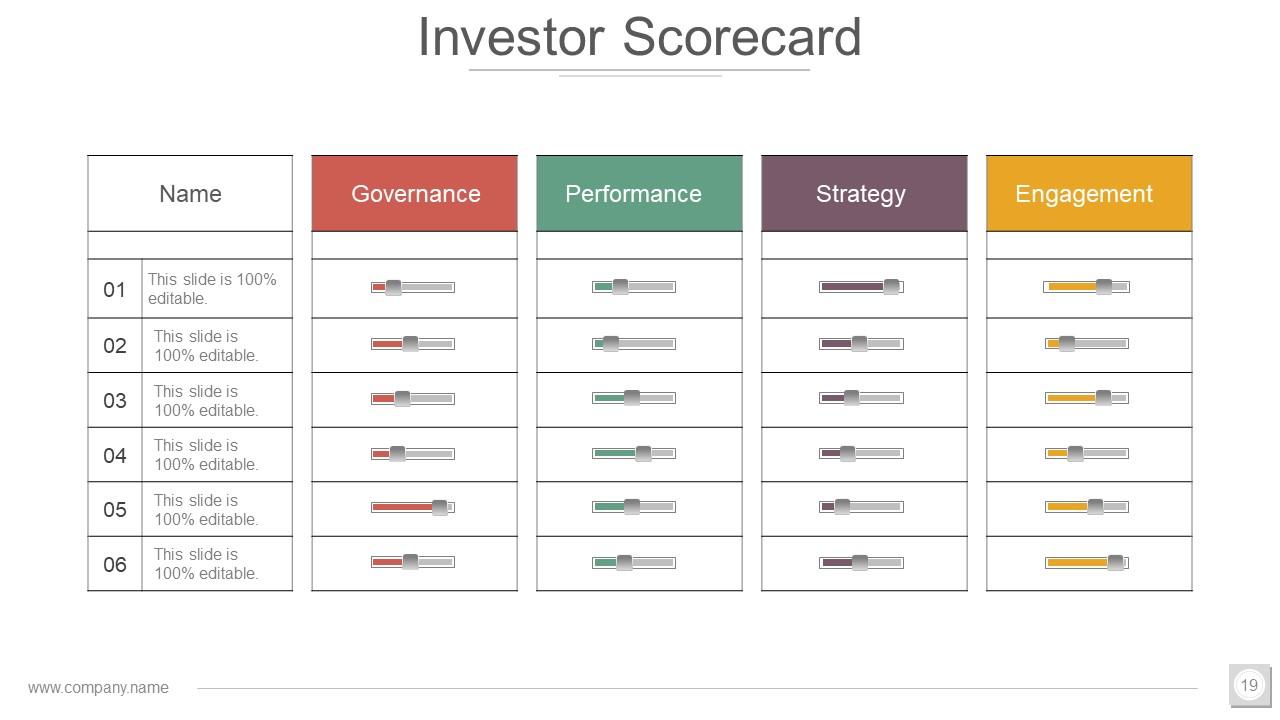
Slide 19: This slide is showing Investor Scorecard with four parameters as follows- Governance, Strategy, Performance, Engagement.
Slide 20: This slide showcase Competitive Analysis with six competitor showing different percentage.
Slide 21: This displays Market Dynamics. It shows five different pie chart to shows the various stages as- Competitive Landscape, Contingency Plan, Market Opportunity Description.
Slide 22: This slide represent Market Budget showing different percentages with certain factors as- Products & Services, Business Opportunities, Target Mark, Marketing Objectives, Competition.
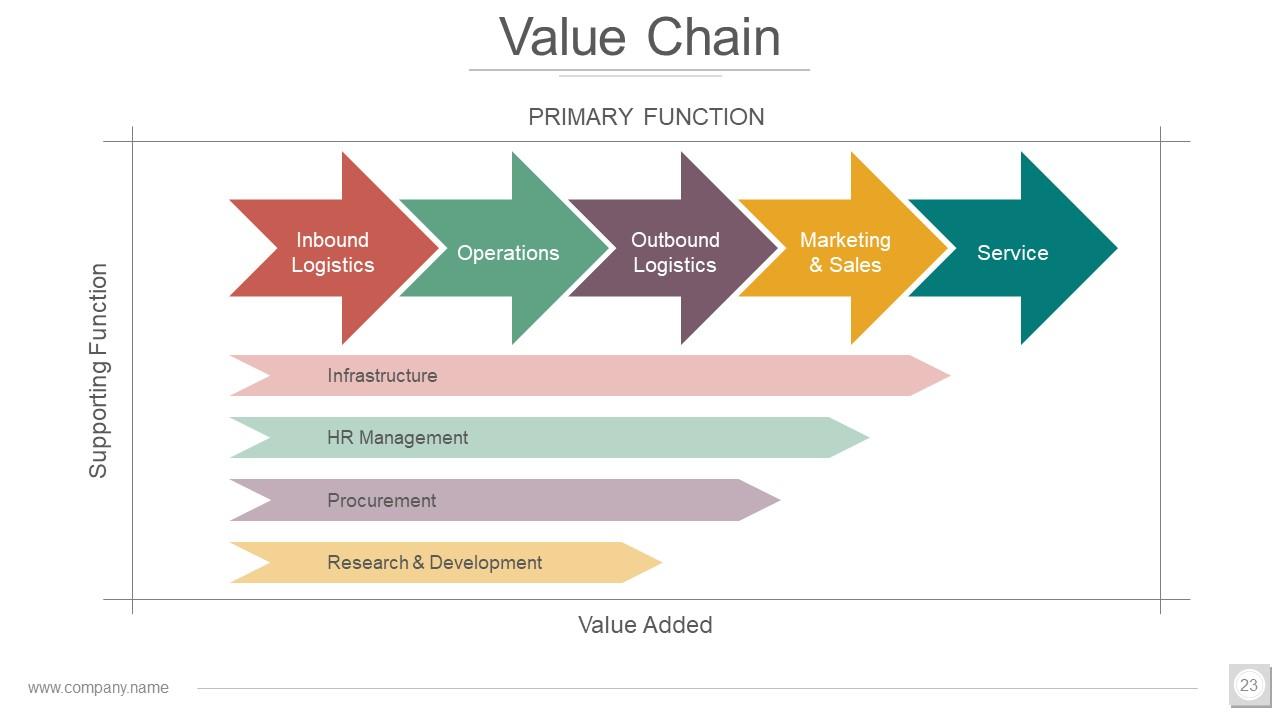
Slide 23: This slide explains slide Value Chain. It also shows primary functions and supporting functions like - Inbound Logistics, Operations Outbound Logistics, Marketing & Sales, Service.
Slide 24: This slide presents Platform Build On Value Chain. It shows the five steps process and make the best use of it.
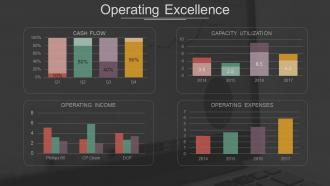
Slide 25: This slide include mainly Operating excellence showing various bar charts having cash flow,capacity utilization, operating income, operating expenses.
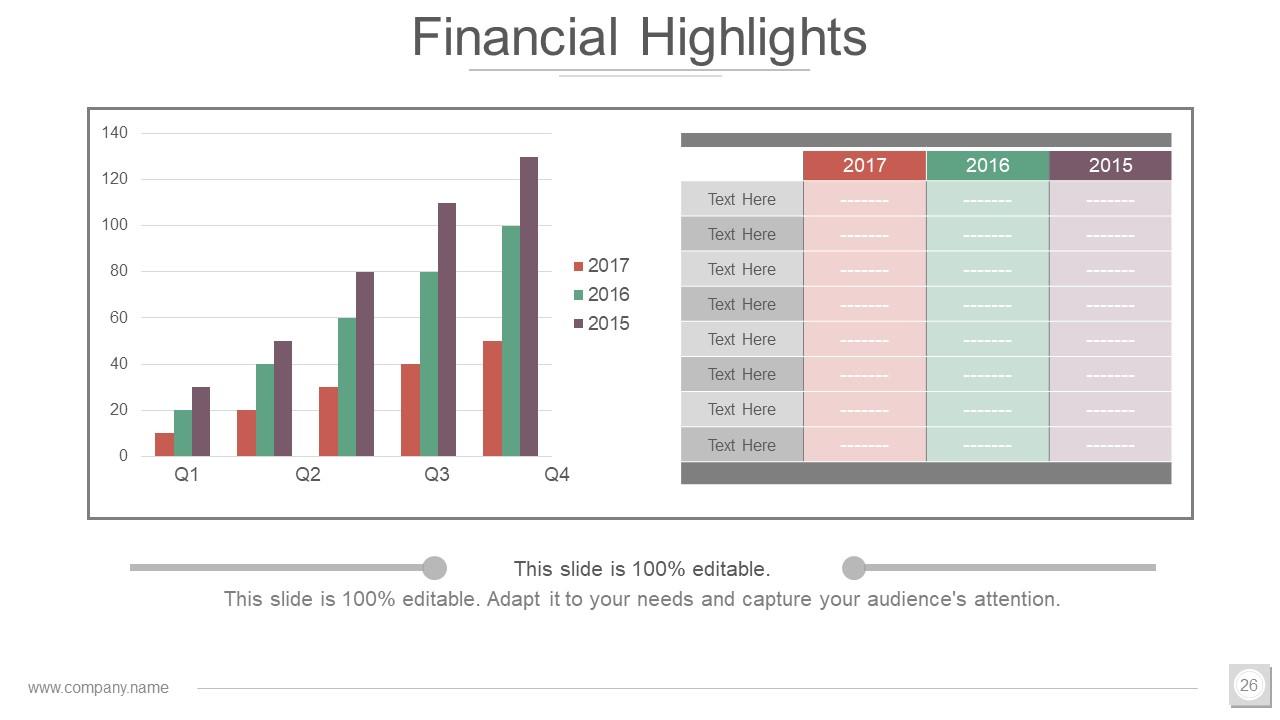
Slide 26: This slide explain you about four financial year bar chart and table for it showing the growth of your business.
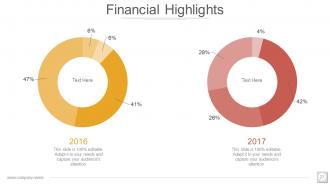
Slide 27: This is Financial Highlights. This also shows two pie chart with different percentage.
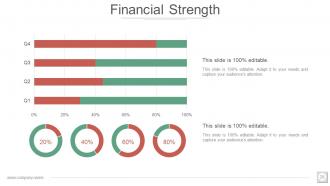
Slide 28: This is slide which explain a short Financial Report. With the help of this you can measure the four levels of business strengths and weakness.
Slide 29: This slide showcases about Financial Strength.
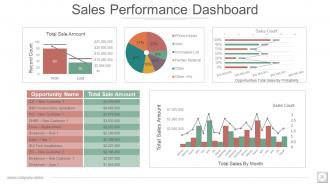
Slide 30: This slide displays Sales Performance Dashboard. These dashboards can also be used for total sale amount, sales count etc.
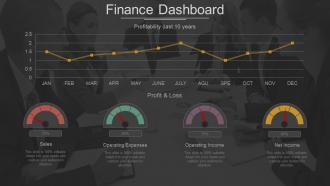
Slide 31: This slide showcases finance dashboard. Also it is showing meter for sales, operating expense, operating income, net income meter.
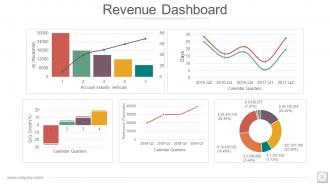
Slide 32: This is Revenue Dashboard slide which further have account industry verticals, calendar ,quarters.
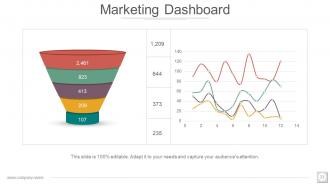
Slide 33: This slide presents Marketing Dashboard with funnel and line chart. With this you can analyse the various parameters.
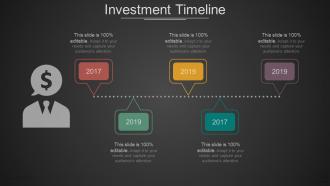
Slide 34: This slide is an Investment Timeline which is showing five year of roadmap.
Slide 35: This slide is an Customer Traction that shows bar chart and funnel such as signed up user,visited sign up page, traffic, impression.
Slide 36: This slide display Capital Allocation which also describe capital expenditure and working capital.
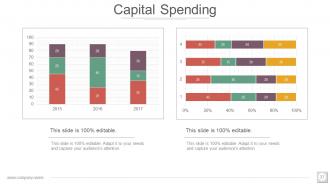
Slide 37: This slide showcases Capital Spending bar chart horizontal and vertical.
Slide 38: This slide Project Progress And Reasons For Delay showing in bar chart and pie chart form.
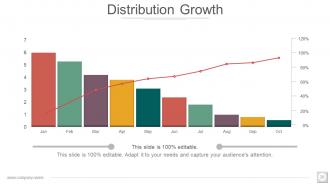
Slide 39: This slide is bar graph for Distribution Growth.You can display your business growth in this.
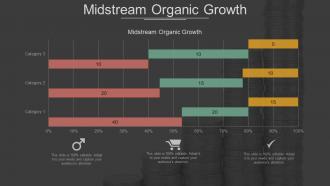
Slide 40: This slide showcases the Midstream Organic Growth.You can make the use of bar chart according to your requirement.
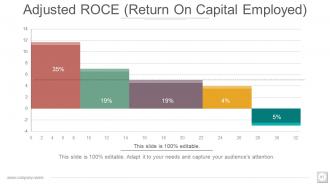
Slide 41: This slide displays Adjusted ROCE (Return On Capital Employed).You can use the chart with your percentage.
Slide 42: This slide shows Adjusted ROCE (Return On Capital Employed) and showing the financial years. you can allocate your data and use accordingly.
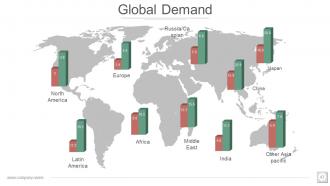
Slide 43: This slide presents Global Demand. Also it is showing across the globe distribution with numbers. You can use as per your requirement.
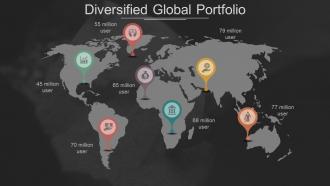
Slide 44: This slide displays Diversified Global Portfolio showing the location mark. with this you can edit the number of user across the globe.
Slide 45: This slide is titled Additional Slides to proceed forward.
Slide 46: This slide is titled Additional Slides to proceed forward.
Slide 47: This is an Our Mission slide.You can edit your company mission.
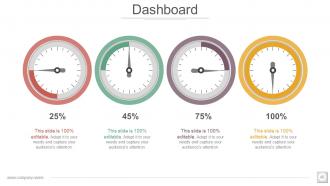
Slide 48: This slide is showing Dashboard .You can use these dashboards meter according to your requirement.
Slide 49: This slide showcases Location across the globe.
Slide 50: This slide presents Timeline showing various years.
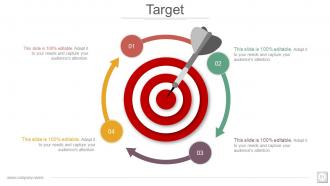
Slide 51: This is a Target slide to show targets to achieve etc.
Slide 52: This is a slide Circular diagram.
Slide 53: This is an Venn Diagram showing three overlapping circle.
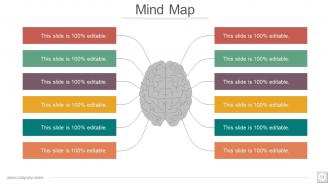
Slide 54: This slide is Mind Map.you can present data,information as per requirement.
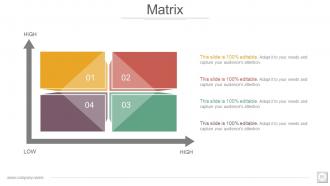
Slide 55: This is a slide of Matrix.It can be used for showing four quadrant application.
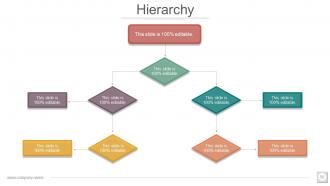
Slide 56: This Hierarchy slide can be used as organisational structure.
Slide 57: This is a Idea slide.You can add your idea listing in the points.
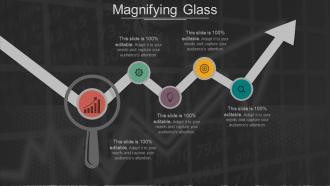
Slide 58: This slide is showing Magnifying Glass.You can use the best possible way to show analysis.
Slide 59: This slide shows Bar Graph.
Slide 60: This slide displays a Funnel.
Slide 61: This is a Thank You slide with Address# street number, city, state, Contact Numbers, email Address.
Investor Profile Portfolio Powerpoint Presentation Slides with all 61 slides:
Folks eagerly come forward to join you due to our Investor Profile Portfolio Powerpoint Presentation Slides. They will accept your invitation.
-
Top Quality presentations that are easily editable.
-
Good research work and creative work done on every template.


