Arrow PowerPoint Templates, Presentation Diagrams & PPT Slides
- Sub Categories
-
- 30 60 90 Day Plan
- Advertising
- Agile Development
- Aims and Objectives
- Arrows
- Before and After
- Blockchain Bitcoin
- Boxes
- Business
- Calender
- Case Study
- Celebrations
- Certificates
- Challenges Opportunities
- Channel Distribution
- Children
- Communication
- Competitive Landscape
- Computer
- Concepts
- Construction Management
- Corporate
- Crowdfunding
- Current State Future State
- Custom PowerPoint Diagrams
- Digital Transformation
- Dos and Donts
- Economics
- Education
- Environment
- Events
- Festival
- Finance
- Financials
- Food
- Game
- Gap Analysis
- Generic
- Geographical
- Health
- Heatmaps
- Holidays
- Icons
- Input Process Output
- Internet
- Key Messages
- Key Wins
- Ladder
- Leadership
- Lists
- Lucky Draw
- Management
- Marketing
- Measuring
- Medical
- Music
- News
- Next Steps
- People Process Technology
- Pillars
- Planning
- Post-it-Notes
- Problem Statement
- Process
- Proposal Management
- Pros and Cons
- Puzzle
- Puzzles
- Recruitment Strategy
- Religion
- Research and Development
- Risk Mitigation Strategies
- Roadmap
- Selling
- Shapes
- Short Term Long Term
- Social
- Stairs
- Start Stop Continue
- Strategy
- Symbol
- Technology
- Thesis Defense Dissertation
- Timelines
- Traffic
- Transition Plan
- Transportation
- Vehicles
- Venture Capital Funding
- Warning
- Winners
- Word Cloud
-
 List of 6 key steps marketing diverging processes radial chart powerpoint templates
We are proud to present our list of 6 key steps marketing diverging processes radial chart powerpoint templates. The above template has the theme of circular flow network diagram. This image refers the concept of Act Cycle. Adjust the above image in your PPT presentations to visually support your content in your business meetings. This PPT images is so perfectly designed that it make your clients understand the business idea quickly and visually.
-
 Powerpoint templates download management diagram arrows process software slides
We are proud to present our powerpoint templates download management diagram arrows process software slides. Visually support your Microsoft office PPT Presentation with our above template illustrating a eight steps Cyclic diagram. This attractive image makes your presentations simpler showing that you care about even the smallest details. Create captivating presentations to deliver your message across your team.
-
 Regular demonstration of 12 diverging arrows radial chart powerpoint templates
We are proud to present our regular demonstration of 12 diverging arrows radial chart powerpoint templates. This PPT slide demonstrates 12 diverging arrows pointing outwards to the center. You can present your views on the methods using this self-explanatory template. Grab the attention of your team with this eye catching template.
-
 Representing diverging circular flow chart layout process powerpoint templates
We are proud to present our representing diverging circular flow chart layout process powerpoint templates. The chart below is designed to give you the flavor of the kind of tools you may need and the work that is performed in the lifecycle. Measure key aspects of the current process and collect relevant data. Give your visuals a unique look and feel with this diagram.
-
 Round demonstration of 8 diverging process flows circular motion powerpoint slides
We are proud to present our round demonstration of 8 diverging process flows circular motion powerpoint slides. Use this diagram to explore the various stages existing in your in your plans and processes. Unravel the desired and essential elements of your overall strategy. Explain the relevance of the different stages in getting down to your core competence, ability and desired result.
-
 Seven diverging steps to perform a circular task flow motion process powerpoint slides
We are proud to present our seven diverging steps to perform a circular task flow motion process powerpoint slides. Create visually stunning and define your PPT Presentations in a unique and inspiring manner using our above template. Elucidate on your thoughts and ideas to achieve the common aim with Excellence.
-
 Steady way to represent 7 diverging steps circular flow motion process powerpoint slides
We are proud to present our steady way to represent 7 diverging steps circular flow motion process powerpoint slides. The arrows indicate the progression of the process. Constant monitoring of the processes provides you with opportunities to concentrate on the core competencies in your business and improve the standards for more effective results.
-
 Steps new business powerpoint presentation diverging processes radial chart templates
We are proud to present our steps new business powerpoint presentation diverging processes radial chart templates. This layout helps your viewers automatically empathize with your thoughts. Highlight your ideas broad- based on strong fundamentals and illustrate how they step by step achieve the set growth factor.
-
 Steps of successful free business powerpoint templates plan cycle flow chart
We are proud to present our steps of successful free business powerpoint templates plan cycle flow chart. Your business and plans for its growth consist of processes that are highly co-related. One pushes the other till it all comes back full cycle. You have understood the essence of this chain reaction like sequence of events. Now use this template to enlighten your team and colleagues on the critical factors involved.
-
 Three arrows diverging 3 different direction circular flow process powerpoint templates
We are proud to present our three arrows diverging 3 different direction circular flow process powerpoint templates. The above template contains a graphic of diverging arrows. Amplify your views, ideas and thoughts from very basic aspects to the highly technical and complicated issues using this template as a tool.
-
 Three diverging arrows pointing direction circular flow process powerpoint templates
We are proud to present our three diverging arrows pointing direction circular flow process powerpoint templates. The above template has the theme of directional Arrows. This image clearly defines the concept of distinct opinions. You can also easily edit the size, position and text and change the colors as per your theme
-
 Triangle boxes 4 concepts converging model circular flow process powerpoint templates
We are proud to present our triangle boxes 4 concepts converging model circular flow process powerpoint templates. Use this unified diagram to illustrate the logical path or system. Explain the specific subject matter like your team is so inspired and aligned that they share their exciting vision with their leaders and they become inspired in their role
-
 Two different paths confusion decision making cycle process network powerpoint slides
We are proud to present our two different paths confusion decision making cycle process network powerpoint slides. There was a vision of a desired destination and the best road to take to reach that goal. Drive home your reasons and chart the path ahead to arrive at tour destination and achieve the goal.
-
 World business powerpoint templates chart radial process
We are proud to present our world business powerpoint templates chart radial process. This diagram is useful when you wish to show how separate items are cyclical. Strengthen your relationship with your present customers and likely future ones as the occasion has an intrinsic business potential.
-
 3d circular arrows diverging process steps software powerpoint slides
We are proud to present our 3d circular arrows diverging process steps software powerpoint slides. This diagram helps to illustrate a Process steps. This diagram is adequate to present three corner points of a sequence. Create your process cycle with this chart and convince your audience with a professional arranged presentation.
-
 3d circular stages depicting concepts cycle flow network powerpoint templates
We are proud to present our 3d curved flow arrows diverging three direction cycle network powerpoint templates. This diagram is perfect for illustrating a divergence. This shows ideas to get the different elements of your Business. This helps you to comprehend your plan to get the entire act together.
-
 5 arrows diverging concept process chart software powerpoint templates
We are proud to present our 5 arrows diverging concept process chart software powerpoint templates. Use this diverging concept diagram to show relationships to a central idea in a cycle. Now fire the arrows to emblazon the desired path by which you will achieve anticipated results.
-
 6 diverging arrows depicting different issues cycle process powerpoint templates
We are proud to present our 6 diverging arrows depicting different issues cycle process powerpoint templates. Networking is an imperative in todays world. You need to access the views of others. It helps you to reassure the faith of your workers and get them to back you all the way. You have thought it through and outlined a plan of action.
-
 6 stages flow diverging process arrows circular layout diagram powerpoint slides
We are proud to present our 6 stages flow diverging process arrows circular layout diagram powerpoint slides. Life and Business is made up of processes comprising stages that flow from one to another. This is an excellent graphic to attract the attention of and understanding by your audience to improve earnings.
-
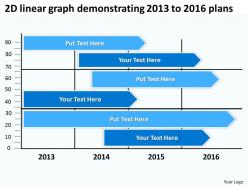 Product roadmap timeline 2d linear graph demonstrating 2013 to 2016 plans powerpoint templates slides
We are proud to present our product roadmap timeline 2d linear graph demonstrating 2013 to 2016 plans powerpoint templates slides. This Diagram illustrates the yearly plan from year 2013 to 2016 using 2D linear graph. This Diagram portrays the concept of Consistent Growth for 4 years. You can use this Diagram of 5 slides to express the financial growth of Business in mentioned four years. The Business Diagram helps expound on the logic of your detailed thought process to take your company forward. You can change color, size and orientation of any icon to your liking.
-
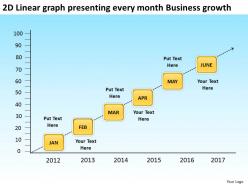 Product roadmap timeline 2d linear graph presenting every month business growth powerpoint templates slides
We are proud to present our product roadmap timeline 2d linear graph presenting every month business growth powerpoint templates slides. Use this PowerPoint diagram to graphically represent the growth for upcoming years using this 2d linear graph. Your brain is always churning out ideas like cogs in a wheel. The mind is always whirring with new ideas. Put them down and present them using our innovative Diagram. Activate the minds of your team with your ideas. Illustrate to them how it will take them to the very top.
-
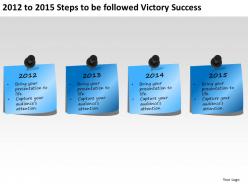 Product roadmap timeline 2012 to 2015 steps to be followed victory success powerpoint templates slides
We are proud to present our product roadmap timeline 2012 to 2015 steps to be followed victory success powerpoint templates slides. This Diagram shows you the calendar View of 4 years .It shows the steps to be followed to get more successful in Business. Stable ideas are the building blocks of a successful structure. Lay down the fundamentals to build upon. Take it up to a higher level with your thoughts. You have aimed your thoughts at many targets. Recall the ones that proved to be high scoring and implement them using our PowerPoint Slides.
-
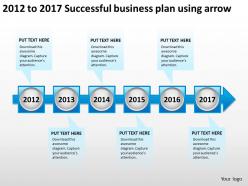 Product roadmap timeline 2012 to 2017 successful business plan using arrow powerpoint templates slides
We are proud to present our product roadmap timeline 2012 to 2017 successful business plan using arrow powerpoint templates slides. Employ the right colors for your brilliant ideas. Help your viewers automatically empathize with your thoughts. Our cleverly selected background hues are guaranteed to achieve this aim. Use this PowerPoint diagram to illustrate the Successful Business plan using arrow.
-
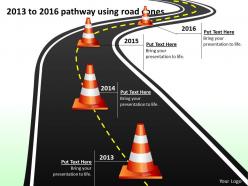 Product roadmap timeline 2013 to 2016 pathway using road cones powerpoint templates slides
Presenting Product roadmap timeline 2013 to 2016 pathway using road cones PowerPoint templates slide. You can customize the fonts, diagrams, and background color of slide as per your requirement. It is easy to insert your company name and logo and replace the dummy content in text placeholders with your content. The slide is in sync with Google slides and can be saved in JPG or PDF format without any hassle. You can download the slide conveniently at the click of a button.
-
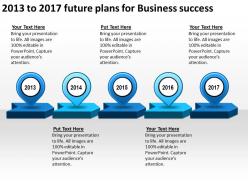 Product roadmap timeline 2013 to 2017 future plans for business success powerpoint templates slides
We are proud to present our product roadmap timeline 2013 to 2017 future plans for business success powerpoint templates slides. This PowerPoint Diagram shows you five arrows which are used to explain the business plans from year 2013 to 2017. Brief your team on a new project with this presentation Diagram, covering project goals, description, competitive analysis, technology, resources, procedures, schedule, and related documents.
-
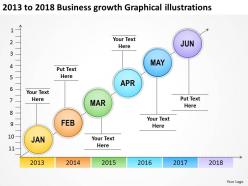 Product roadmap timeline 2013 to 2018 business growth graphical illustration powerpoint templates slides
We are proud to present our product roadmap timeline 2013 to 2018 business growth graphical illustration powerpoint templates slides. Use this PowerPoint image which graphically illustrates the Business Growth from years 2013 to 2018. It helps you to demonstrate each and every plan which can lead to Success in Following years. This image has been conceived to enable you to emphatically communicate your ideas in your Business PPT presentation.
-
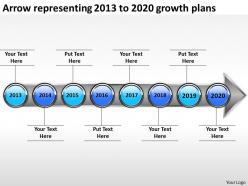 Product roadmap timeline arrow representing 2013 to 2020 growth plans powerpoint templates slides
We are proud to present our product roadmap timeline arrow representing 2013 to 2020 growth plans powerpoint templates slides. Visually support your Microsoft office PPT Presentation with our above Diagram illustrating the concept to be used for year?s 2013 to 2020 using arrow pointing towards right direction. A balanced approach to any situation is generally a guarantor of success. Knee jerk reactions generally have negative long term effects.
-
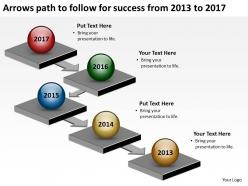 Product roadmap timeline arrows path to follow for success from 2013 to 2017 powerpoint templates slides
SlideTeam presents to you its roadmap timeline Arrows path to follow for success from 2013 to 2017 PowerPoint templates slides. This slideshow allows you to change the font style, font size and even the font color. You can also alter the orientation, the size and even the color of the diagrammatic features used in the pre-designed slides. You can view this PPT slideshow in widescreen display ratio of 16:9 or standard size display ratio of 4:3. This template is also compatible with Google slides, which makes it easier to use.
-
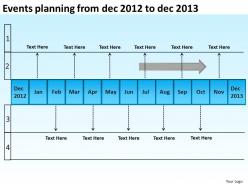 Product roadmap timeline events planning from dec 2012 to dec 2013 powerpoint templates slides
We are proud to present our product roadmap timeline events planning from dec 2012 to dec 2013 powerpoint templates slides. You understand your competition well and can anticipate their actions. Lead your team along, with your brilliant ideas, onto the path of victory. It shows the graphical illustration of upcoming year business plans. This Product Plan format communicates high level Launch Plans, Timeline, Milestones and Objectives to executive board stakeholder groups.
-
 Product roadmap timeline future growth years 2013 to 2016 successful business powerpoint templates slides
We are proud to present our product roadmap timeline future growth years 2013 to 2016 successful business powerpoint templates slides. Employ the right colors for your brilliant ideas. Help your viewers automatically empathize with your thoughts. Our cleverly selected background hues are guaranteed to achieve this aim. This Diagram portrays the concepts of future, business, and white, red, grey, future and business.
-
 Product roadmap timeline linear graph illustrating growth from 2014 to 2017 powerpoint templates slides
We are proud to present our product roadmap timeline linear graph illustrating growth from 2014 to 2017 powerpoint templates slides. A steady and stable organizational structure is what you desire. Explain this step by step Linear Graph to achieve the aim in upcoming years from 2014 to 2017. Use our creative Diagram to lay down your views. You can apply other 3D Styles and shapes to the slide to enhance your presentations.
-
 Product roadmap timeline road mapping from 2013 to 2016 business growth powerpoint templates slides
We are proud to present our product roadmap timeline road mapping from 2013 to 2016 business growth powerpoint templates slides. Use this PowerPoint Diagram to express the Road mapping concept of Business Growth from year 2013 to 2016. New Year is a time to look ahead with renewed resolve. You have analyzed the performance in the recent past. Use them to help you organize the logic of your views.
-
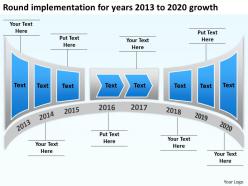 Product roadmap timeline round implementation for years 2013 to 2020 growth powerpoint templates slides
We are proud to present our product roadmap timeline round implementation for years 2013 to 2020 growth powerpoint templates slides. Ensure that your project is running according to schedule with a timeline from this Diagram. It shows the Round Implementation of business plans and Growth from year 2013 to 2016. Create time bound milestones and add comments. Keep your team aware of the deadlines and targets.
-
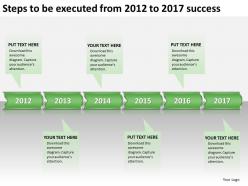 Product roadmap timeline steps to be executed from 2012 to 2017 success powerpoint templates slides
We are proud to present our product roadmap timeline steps to be executed from 2012 to 2017 success powerpoint templates slides. This Business PowerPoint Diagram will expound on the logic of your detailed thought process to take your company forward using the steps which you can illustrate using this PowerPoint slide. This Growth PowerPoint Diagram can be used for context diagrams, diagrams for mind mapping, audit flow diagram, circular process flow diagrams, data flow diagrams and more for years 2012 to 2017.
-
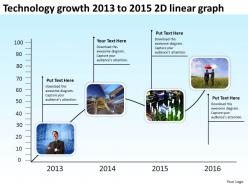 Product roadmap timeline technology growth 2013 to 2015 2d linear graph powerpoint templates slides
We are proud to present our product roadmap timeline technology growth 2013 to 2015 2d linear graph powerpoint templates slides. This PowerPoint demonstrates the technology growth for years 2013, 2014 and 2015. It is illustrated by 2D linear Graph. This Diagram portrays the concepts of technology abstract background, abstract, background, broadband, circle, colorful, communication, computer, concept, connectivity, navy blue, black, white, communication, computer, abstract, services and youth .
-
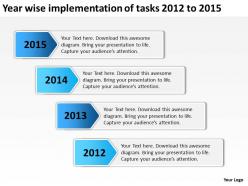 Product roadmap timeline year wise implementation of tasks 2012 to 2015 powerpoint templates slides
We are proud to present our product roadmap timeline year wise implementation of tasks 2012 to 2015 powerpoint templates slides. You have reached an important crossroad in your business progress. You have many different options available to you. You have examined each down to the minutest detail and come up with answers. Explain these options to your team along with the logical reasons for your selection. This design slide Diagram features an image of a year wise implementations of tasks from 2012 to 2015, symbolizing the emergence of something new from an established, stable entity.
-
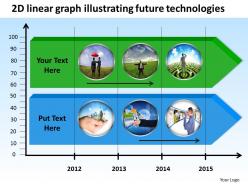 Product roadmap timeline 2d linear graph illustrating future technologies powerpoint templates slides
We are proud to present our product roadmap timeline 2d linear graph illustrating future technologies powerpoint templates slides. This PPT slide is perfect to show future economic, social, technological, and environmental conditions. The mind is always whirring with new ideas. Put them down and present them using our innovative Diagram. Activate the minds of your team with your ideas. Illustrate to them how it will take them to the very top.
-
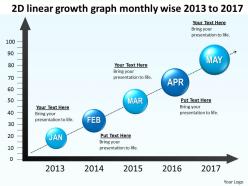 Product roadmap timeline 2d linear growth graph monthly wise 2013 to 2017 powerpoint templates slides
We are proud to present our product roadmap timeline 2d linear growth graph monthly wise 2013 to 2017 powerpoint templates slides. This 2d Linear graph helps to demonstrate the many facets of the upcoming years. This is the appropriate graph to make statistical information coherent. This helpful and interactive diagram is a wonderful tool for this purpose. Make interaction between groups using this seamless system.
-
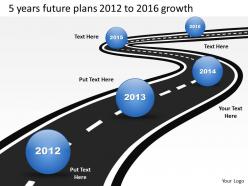 Product roadmap timeline 5 years future plans 2012 to 2016 growth powerpoint templates slides
We are proud to present our product roadmap timeline 5 years future plans 2012 to 2016 growth powerpoint templates slides. This Roadmap layout is especially useful for describing future plans, relating to population distribution, voting patterns, crime rates, or labor force composition. You have analyzed many global markets and come up with possibilities. Highlight the pros and cons of other likely business opportunities
-
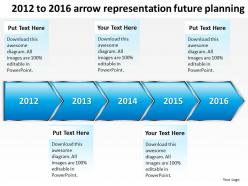 Product roadmap timeline 2012 to 2016 arrow representation future planning powerpoint templates slides
We are proud to present our product roadmap timeline 2012 to 2016 arrow representation future planning powerpoint templates slides. This Roadmap diagram can helps to display geographical variations on the level of cities, counties, city blocks, census tracts, and other units. Your choice of whether to display variations on the state level or for smaller units will depend on the research question you wish to explore.
-
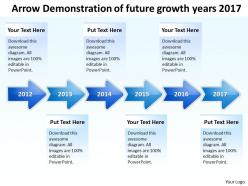 Product roadmap timeline arrow demonstration of future growth years 2017 powerpoint templates slides
We are proud to present our product roadmap timeline arrow demonstration of future growth years 2017 powerpoint templates slides. Statistical process control was developed as a feedback system that aids in preventing defects rather than allowing defects to occur. This chart, could also distinguish the two types of variation from each other, thus allowing for the elimination of special causes and the reduction of common cause variation.
-
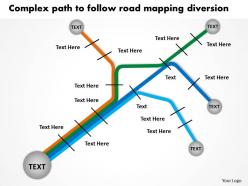 Product roadmap timeline complex path to follow road mapping diversion powerpoint templates slides
We are proud to present our product roadmap timeline complex path to follow road mapping diversion powerpoint templates slides. Use this diagram to show trends in connectivity technologies and their socio economic impacts. Outline the path you have in mind in order to boost sales and stay ahead of the competition enhancing your corporate reputation as you go along the road to success.
-
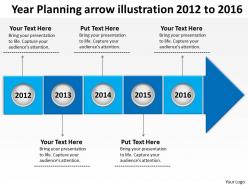 Product roadmap timeline year planning arrow illustration 2012 to 2016 powerpoint templates slides
We are proud to present our product roadmap timeline year planning arrow illustration 2012 to 2016 powerpoint templates slides. Use this Diagram to create time bound milestones and add comments. Keep your team aware of the deadlines and targets. This helps to show the progression of a project or illustrates milestones that happen over a period of time. It helps you to take your team up to a higher level with your thoughts.
-
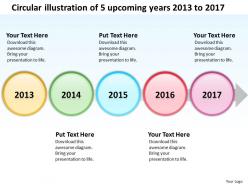 Product roadmap timeline circular illustration of 5 upcoming years 2013 to 2017 powerpoint templates slides
We are proud to present our product roadmap timeline circular illustration of 5 upcoming years 2013 to 2017 powerpoint templates slides. Linear trends show a steady, straight-line increase or decrease. The above graph shows the same data with periodic additions and subtractions. Use this template to illustrate your method, piece by piece, and interlock the whole process in the minds of your audience.
-
 3d man on the arrow moving towards success ppt graphics icons
We are proud to present our 3d man on the arrow moving towards success ppt graphics icons. Start the gears of youthful minds and set them in motion. Show them how to churn out fresh ideas. Help them develop their thoughts along the way. The above Template displays a Diagram of a men representing bar graph to her team mates. It signifies the Growth, ups and downs in the Business.
-
 3d man reaching destination through arrow ppt graphics icons
We are proud to present our 3d man reaching destination through arrow ppt graphics icons. Present your ideas, concepts and processes with our professionally designed template for PowerPoint presentations. Decorate it with your well wrapped ideas and colorful thoughts to reach the Destination and express its Excitement.
-
 3d spiral process powerpoint slides presentation diagrams templates
We are proud to present our 3d spiral process powerpoint slides presentation diagrams templates. Create visually stunning and define your PPT Presentations in a unique and inspiring manner using our above template. This diagram can be used to show looped processes, circular process, complex and linear process. It depicts specific models like analysis, plan, implementation and review. Elucidate on your thoughts and ideas to achieve the common aim with Excellence.
-
 4 concepts of one powerpoint slides presentation diagrams templates
We are proud to present our 4 concepts of one powerpoint slides presentation diagrams templates. The above template displays a diagram of four arrows leading to one globe Come forth with the plans you have so carefully laid out. Use this diagram to inject these values into your group and see them bond to achieve success. Excite your audience with the brilliance of your thoughts.
-
 Business innovation powerpoint slides presentation diagrams templates
We are proud to present our business innovation powerpoint slides presentation diagrams templates. This diagram make your audience understands essential elements of your overall strategy and also shows an organized view of business services and processes. It will also show audience stages and components of innovation process in the company. This diagram could be used for presentations on innovation, innovation plan, implementation process, etc.
-
 Four levels of filter ppt slides presentation diagrams templates
We are proud to present our four levels of filter ppt slides presentation diagrams templates. This filteration diagram visually describes the sales process from initial contact to final sale. It acts as a sieve to direct qualified purchasers through the sales process, while filtering out less-qualified visitors along the way. This helps you to comprehend your plan to get the entire act together.
-
 Give and take interaction ppt slides diagrams templates
We are proud to present our give and take interaction ppt slides diagrams templates. The above diagram contains a graphic of two circular arrows. It depicts give and take concept. It is the practise of compromise or exchange of ideas or conversation. You have what it takes to grow. Take your team along by explaining your plans.
-
 Levels of filtering powerpoint slides presentation diagrams templates
We are proud to present our levels of filtering powerpoint slides presentation diagrams templates. This PowerPoint diagram shows stages of filtration process. This diagram can be used in used in strategy, consulting and marketing presentations. Elucidate on your thoughts and ideas to achieve the common aim with Excellence.
-
 One action and multiple repercussions powerpoint slides presentation diagrams templates
We are proud to present our one action and multiple repercussions powerpoint slides presentation diagrams templates. Create visually stunning and define your PPT Presentations in a unique and inspiring manner using our above template. One action leads to multiple effects. It graphically illustrates the relationship between a given outcome and all the factors that influence the outcome. Use them to help you organise the logic of your views.
-
 One cause four outcomes ppt slides presentation diagrams templates
We are proud to present our one cause four outcomes ppt slides presentation diagrams templates. Cause and effect diagram is a tool that helps identify, sort and display possible causes of a specific problem or quality characteristic. This diagram can be used to analyze existing problems so that corrective action can be taken.
-
 Three ways to attain goal powerpoint slides presentation diagrams templates
We are proud to present our three ways to attain goal powerpoint slides presentation diagrams templates. This diagram is used in strategy presentations. Use this diagram in presentations related to growing towards the goal, factors involved in goal achievement, progressive movement towards the goal. You can put down your ideas and present them using our innovative templates.
-
 Two sides of argument powerpoint slides presentation diagrams templates
We are proud to present our two sides of argument powerpoint slides presentation diagrams templates. Create visually stunning and define your PPT Presentations in a unique and inspiring manner using our above template. This diagram help you capture alternate viewpoints or to evaluate options for their merit or value. This PPT Enlighten others on your team with your views.
-
 Business analysis diagrams 2 steps of comparison strategic goals powerpoint templates
We are proud to present our business analysis diagrams 2 steps of comparison strategic goals powerpoint templates. Develop competitive advantage with our above Diagram which contains Arrows layout image. This slide is an excellent backdrop for you to enlighten your audience on the process you have gone through and the vision you have for the future.
-
 Business charts examples analogical plan powerpoint templates ppt backgrounds for slides
We are proud to present our business charts examples analogical plan powerpoint templates ppt backgrounds for slides. This PowerPoint Diagram shows you Correlated Arrows in Horizontal Line which signifies step by step Execution, inter-related approaches etc. This is an effective way of displaying information you can edit text, color, shade and style as per you need.
-
 Business charts examples diagram marketing plan powerpoint templates ppt backgrounds for slides
We are proud to present our business charts examples diagram marketing plan powerpoint templates ppt backgrounds for slides. Use this diagram to explore the minutest detail of each concept and follow the trail to its conclusion. Highlight the results of you thought process and convince your team of the reasons for selecting a particular path to follow.
-
 Business charts examples flow diagram 3 stages powerpoint templates ppt backgrounds for slides
We are proud to present our business charts examples flow diagram 3 stages powerpoint templates ppt backgrounds for slides. Use this slide to make list of concepts, approaches, or methodologies that may be applicable to the particular process. Energize your team to greater efforts and get across the final line.
-
Illustrative design with editable content. Exceptional value for money. Highly pleased with the product.


