Project management timeline gantt chart
Schedule your next business project with our Project Management Timeline Gantt Chart PowerPoint template. Managing project is crucial for business growth. There are many stages included in the project management such as initiation, planning, execution, control and closing the work. This presentation design enables you to check the work progress at every stage and make changes in your strategy if require. Project Managers can use this PPT slide to assign the task, monitor it and even share it with the senior management. Every project has a deadline and it is important for business firms to deliver it at a right time. By downloading this PowerPoint presentation, you can manage your work in an effective manner and then don’t need to bother about its deadline as you will achieve them every time. Our Project Management Timeline Gantt Chart are pretty clear cut. Help your ideas be easily understood.
You must be logged in to download this presentation.
 Impress your
 audience
Editable
of Time
PowerPoint presentation slides
The topics discussed in this diagram are Timeline 2019, Roadmap 2019, Linear Process 2020. This is a completely editable PowerPoint presentation and is available for immediate download.
People who downloaded this PowerPoint presentation also viewed the following :
Content of this Powerpoint Presentation
Description:
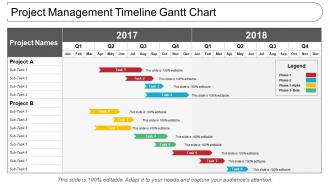
The image is a Gantt chart, which is a popular project management tool used to provide a visual representation of a project's schedule. The chart illustrates two projects, labeled "Project A" and "Project B," each with a list of sub-tasks.
For both projects, the timeline spans two years, 2017 and 2018, and is divided into quarters (Q1, Q2, Q3, Q4) and months. Each sub-task is represented as a colored bar across the timeline, indicating the start and end dates. The length and position of the bars correspond to the duration and timing of the sub-tasks within the overall project schedule.
The colors of the bars correlate to different phases of the project, as explained in the Legend on the right side of the chart. The Legend distinguishes between Phase 1, Phase 2, Phase 3-Alpha, and Phase 3-Beta, likely indicating different stages or types of work being completed.
Use cases:
Gantt charts are essential tools for project planning, allowing visualization of timelines and progress across tasks in various industries.
1. Construction
Use: Tracking project phases, from groundwork to final construction.
Presenter: Project Managers.
Audience: Contractors, Stakeholders.
2. IT and Software Development
Use: Scheduling software release cycles and development stages.
Presenter: IT Project Coordinators.
Audience: Development Teams, Investors.
3. Event Planning
Use: Organizing event components from planning to execution.
Presenter: Event Planners.
Audience: Clients, Vendors.
4. Manufacturing
Use: Outlining production timelines, machine maintenance, and delivery.
Presenter: Operations Managers.
Audience: Production Staff, Suppliers.
5. Marketing and Advertising
Use: Campaign development, market research, and launch activities.
Presenter: Marketing Managers.
Audience: Marketing Teams, Clients.
6. Healthcare Administration
Use: Managing healthcare projects, like facility upgrades or system implementations.
Presenter: Healthcare Administrators.
Audience: Medical Staff, Department Heads.
7. Education
Use: Planning academic and administrative projects, such as curriculum development or campus improvements.
Presenter: Academic Project Managers.
Audience: Faculty, Administrative Staff.
Project management timeline gantt chart with all 5 slides:
Your eminence gets firmly established with our Project Management Timeline Gantt Chart. They help acquire authority.
-
nice
-
amazing
-
nice
-
nice
-
Innovative and attractive designs.
-
Easily Editable.


