Supply Chain Management And Logistics Powerpoint Presentation Slides
Download our content-ready supply chain management, and logistics PowerPoint presentation slides to showcase the complete process of goods movement from manufacturer to customer. Using this SCM PPT presentation, you can represent the flow of product, information, and finance. Talking about our logistics process flow presentation, it covers a wide range of topics, including strategic sourcing process, inventory control, logistics & IT, SCM model, project communication, supplier market assessment, planning & forecasting, SCM decision phase, performance measures, and much more. Other related topics that these templates cover are transportation management services, logistics management, procurement, distribution network, warehouse management, material flow, supply chain processes, and operations management. The strategies mentioned in this inventory management PowerPoint presentation will help you to bring high efficiency in your business, and it saves cost also. Moreover, it enables you to execute all the tasks and achieve long-term profitability smoothly. So, to fully utilize the potential benefits of logistics flow process, download our supply chain management, and logistics presentation slides right now. Accelerate your ascent with our supply chain management ppt Slides. Your growth is bound to get a boost.
You must be logged in to download this presentation.
 Impress your
 audience
Editable
of Time
PowerPoint presentation slides
Presenting supply chain management and logistics PowerPoint presentation slides. This presentation includes 77 professionally outlined PowerPoint slides, all of them being hundred percent editable in PowerPoint. Text fonts size and type, colors and background of the presentation slides are changeable. Use data driven charts and graphs to represent stats. You can download the PPT slides in both wide screen (16:9) and standard view (4:3) aspect dimension. The slides are fully flexible with Google Slides and other online applications. Presentation templates can be saved in any of the formats such as JPG or PDF. The presentation slides can be individualized by adding a business name, trademark or logo. Premium product support is provided.
People who downloaded this PowerPoint presentation also viewed the following :
Content of this Powerpoint Presentation
Slide 1: This slide introduces Supply Chain Management and Logistics. State Your company name and begin.
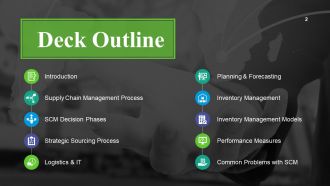
Slide 2: This slide showcases Deck Outline displaying- Planning & Forecasting, Inventory Management, Inventory Management Models, Performance Measures, Common Problems with SCM, Supply Chain Management Process, SCM Decision Phases, Strategic Sourcing Process, Logistics & IT, Introduction.
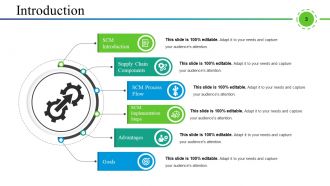
Slide 3: This slide shows Introduction displaying- Supply Chain Components, SCM Process Flow, SCM Implementation Steps, Advantages, Goals, SCM Introduction.
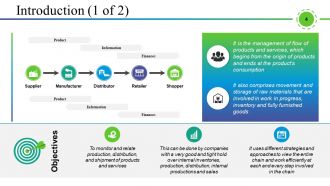
Slide 4: This slide showcases Introduction with- Objectives, Finances, Information, Product, Finances, Information, Product, Supplier, Manufacturer, Distributor, Shopper, Retailer.
Slide 5: This slide showcases Introduction displaying- Second Tier Customer, First Tier Customer, Second Tier Supplier, First Tier, Supplier, END CUSTOMER, DEMAND SIDE, SUPPLY SIDE, Supply Chain Management, Purchasing And, Supply Management, Physical Distribution, Management, Materials Management, Logistics, Information Flow, Physical Flow.
Slide 6: This slide presents Components Of The Supply Chain such as- Supply, Manufacturing, Distribution & Warehousing, Retail, Consumer, Supply Chain Management.
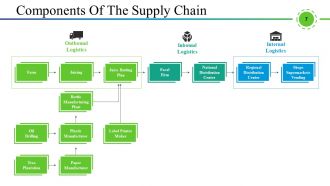
Slide 7: This slide showcases Components Of The Supply Chain displaying- Outbound Logistics, Inbound Logistics, Internal Logistics, Bottle Manufacturing Plant, Oil Drilling, Plastic Manufacturer, Label Printer Maker, Paper Manufacturer, National Distribution Center, Focal Firm, Regional Distribution Center, Shops Supermarkets Vending.
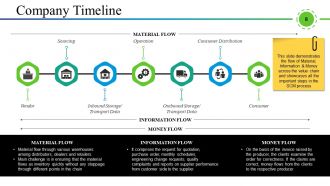
Slide 8: This is a Company Timeline slide showing- Vendor, Sourcing, Inbound Storage/ Transport Data, Operation, Outbound Storage/ Transport Data, Consumer Distribution, Consumer, MATERIAL FLOW, INFORMATION FLOW, MONEY FLOW.
Slide 9: This slide shows SCM Advantages- Develops better customer relationship and service, Creates better delivery mechanisms for products and services in demand with minimum delay, Improvises productivity and business functions, Minimizes warehouse and transportation costs, Minimizes direct and indirect costs, Assists in achieving shipping of right products to the right place at the right time, Enhances inventory management, supporting the successful execution of just-in-time stock models.
Slide 10: This slide shows SCM Implementation Steps- Project Management And Communication, Developing an SCM Vision, Assessing Supply Chain Opportunities, Developing An SCM Strategy, Creating The Optimum SCM Organizational Structure, Establishing The SCM Information And Communication Network, Translating The SCM Strategy Into Actions, Concept Phase, Conversion Phase, Execution Phase.
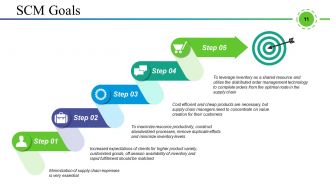
Slide 11: This is SCM Goals slide. State its goals etc. here.
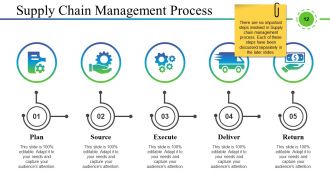
Slide 12: This is Supply Chain Management Process slide subheaded as- Plan, Source, Execute, Deliver, Return. There are six important steps involved in Supply chain management process. Each of these steps have been discussed separately in the later slides.
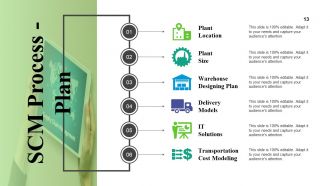
Slide 13: This slide showcases SCM Process with- Plant Location, Plant Size, Warehouse Designing Plan, Delivery Models, IT Solutions, Transportation Cost Modeling, SCM Process - Plan.
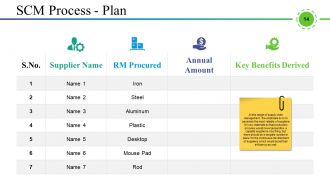
Slide 14: This slide showcases a SCM Process - Plan. At this stage of supply chain management, the emphasis is on to ascertain the most reliable of suppliers for raw materials so that production process would never jeopardize. a capable supplier is one thing, but there should be a tangible system in place for the continuous development of suppliers which would boost their efficiency as well.
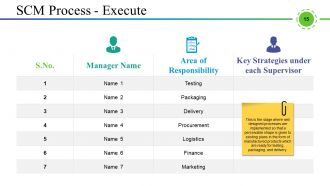
Slide 15: This is SCM Process - Execute in tabular form. This is the stage where well designed processes are implemented so that a perceivable shape is given to existing plans in the form of manufactured products which are ready for testing, packaging, and delivery.
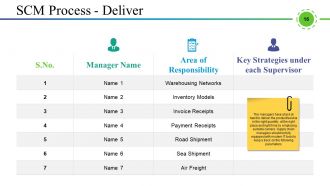
Slide 16: This slide presents SCM Process - Deliver in table form. The managers have a task at hand to deliver the product/service in the right quantity, at the right place and right time by employing suitable carriers. Supply chain managers should be fully equipped with modern IT tools to keep a track on the following parameters.
Slide 17: This slide presents SCM Decision Phases displaying- Supply Chain Strategy Supply Chain Planning Organizational Strength This is a summary slide and guidelines have been mentioned in the boxes which will further help in writing the key points under each step.
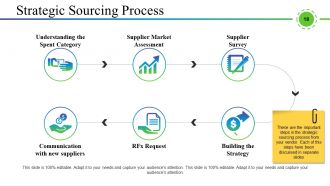
Slide 18: This slide showcases Strategic Sourcing Process displaying- Understanding the Spent Category, Supplier Market Assessment, Supplier Survey, Building the Strategy, RFx Request, Communication with new suppliers. These are the important steps in the strategic sourcing process from your vendor. Each of this steps have been discussed in separate slides
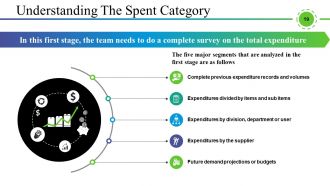
Slide 19: This slide showcases Understanding The Spent Category displaying- Complete previous expenditure records and volumes, Expenditures divided by items and sub items, Expenditures by the supplier, Expenditures by division, department or user, Future demand projections or budgets.
Slide 20: This is Supplier Market Assessment slide.
Slide 21: This is Supplier Survey slide showing- Maturity, Feasibility, Capability, Capacity.
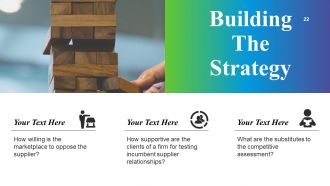
Slide 22: This slide shows Building The Strategy with- How willing is the marketplace to oppose the supplier? How supportive are the clients of a firm for testing incumbent supplier relationships? What are the substitutes to the competitive assessment?
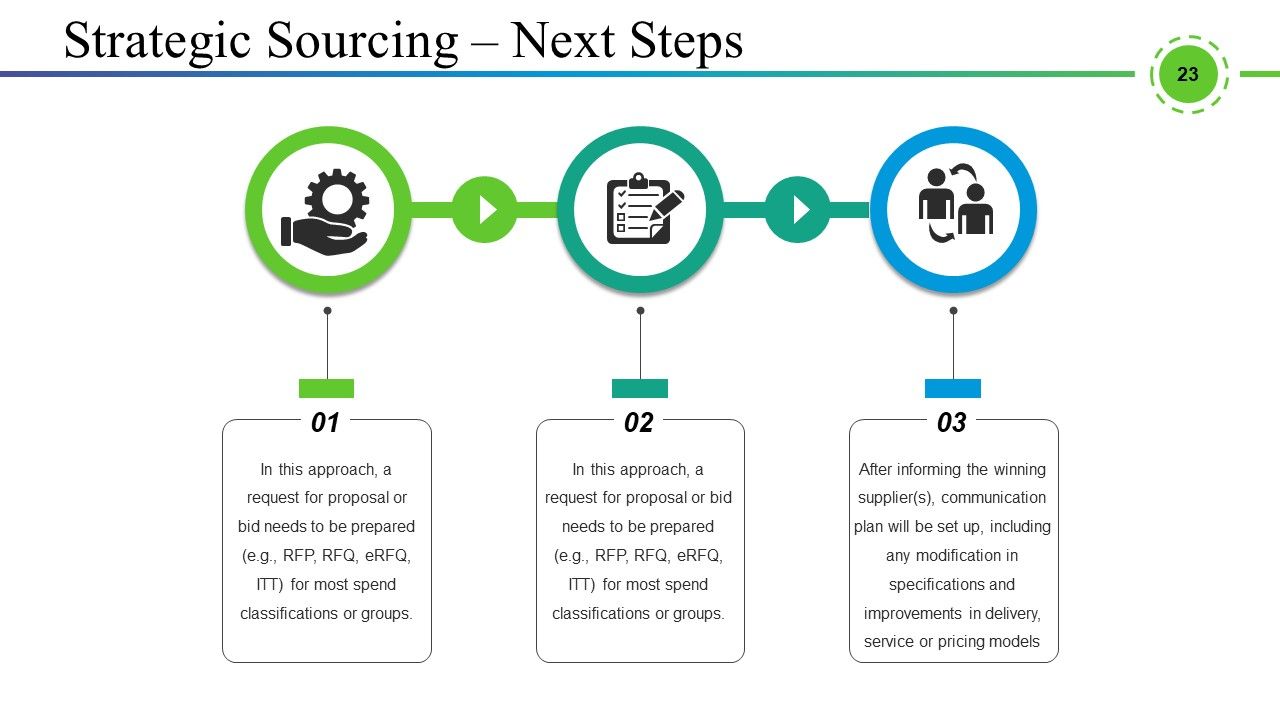
Slide 23: This slide presents Strategic Sourcing – Next Steps.
Slide 24: This slide also showcases Order Fulfillment Process for Supply Chain management divided into-. Customer, Sales Deptt., Credit & Billing, Shipping.
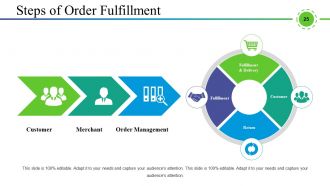
Slide 25: This slide displays Steps Of Order Fulfillment starting from- Customer, Merchant, Order Management, Return, Fulfillment, Fulfillment &Delivery.
Slide 26: This is Logistics & IT slide showcasing- Transportation Challenges, Transportation Medium, IT in SCM.
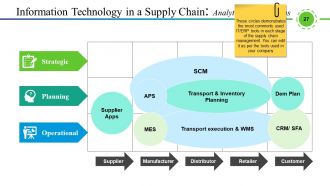
Slide 27: This slide shows Information Technology in a Supply Chain: Analytical Applications displaying- Strategic, Planning, Operational, Supplier, Manufacturer, Distributor, Retailer, Customer, Supplier, Apps, SCM, Transport execution & WMS, Transport & Inventory, Planning, MES, APS, Dem Plan, CRM/ SFA. These circles demonstrates the most commonly used IT/ERP tools in each stage of the supply chain management. You can edit it as per the tools used in your company
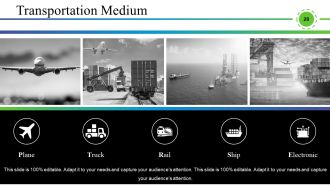
Slide 28: This is Transportation Medium slide showing the kind of transportation needed.
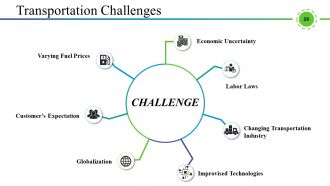
Slide 29: This slide shows Transportation Challenges such as- Labor Laws, Economic Uncertainty, Changing Transportation Industry, Improvised Technologies, Globalization, Customer’s Expectation, Varying Fuel Prices.
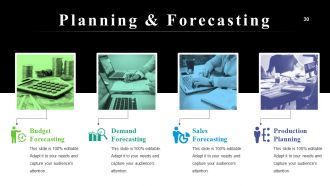
Slide 30: This is Planning & Forecasting slide with- Budget Forecasting, Demand Forecasting, Sales Forecasting, Production Planning.
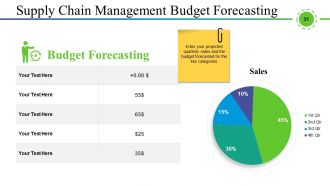
Slide 31: This is Supply Chain Management Budget Forecasting slide. Enter your projected quarterly sales and the budget forecasted for the key categories.
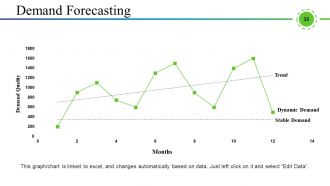
Slide 32: This is Demand Forecasting slide showing- Stable Demand Trend Dynamic Demand in graph form.
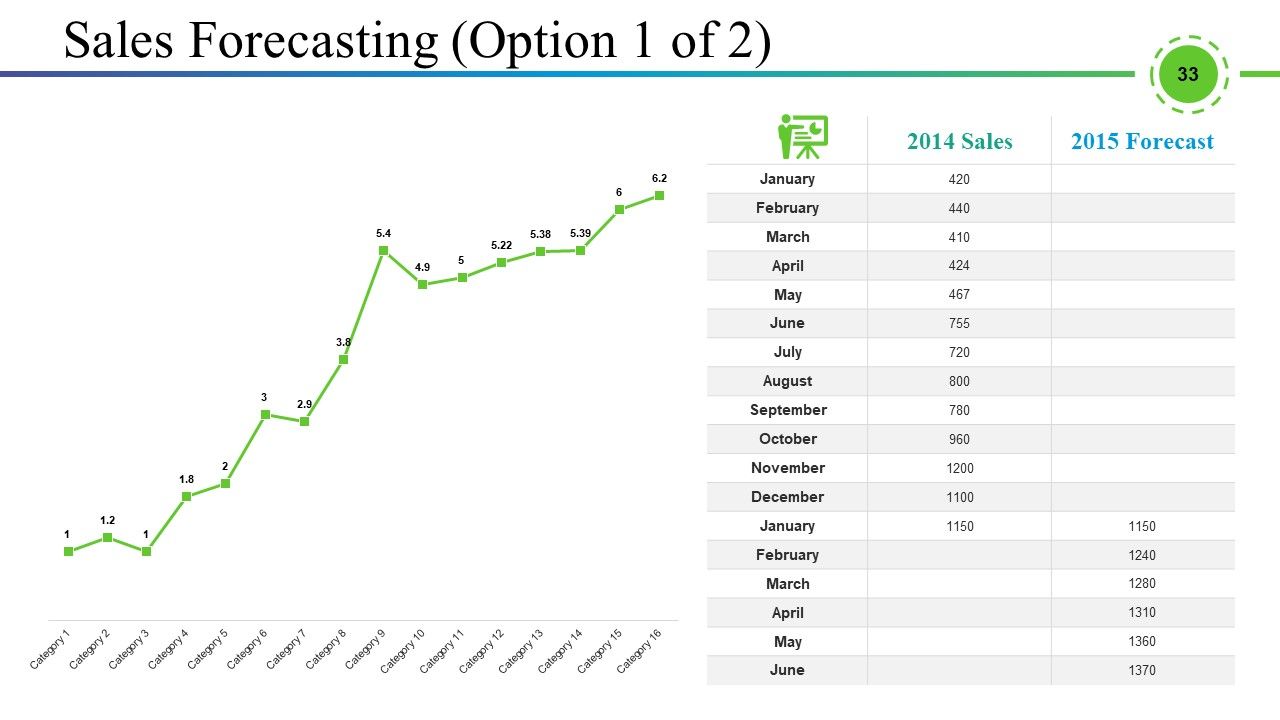
Slide 33: This is Sales Forecasting slide in graphical form.
Slide 34: This is Sales Forecasting slide in graphical form.
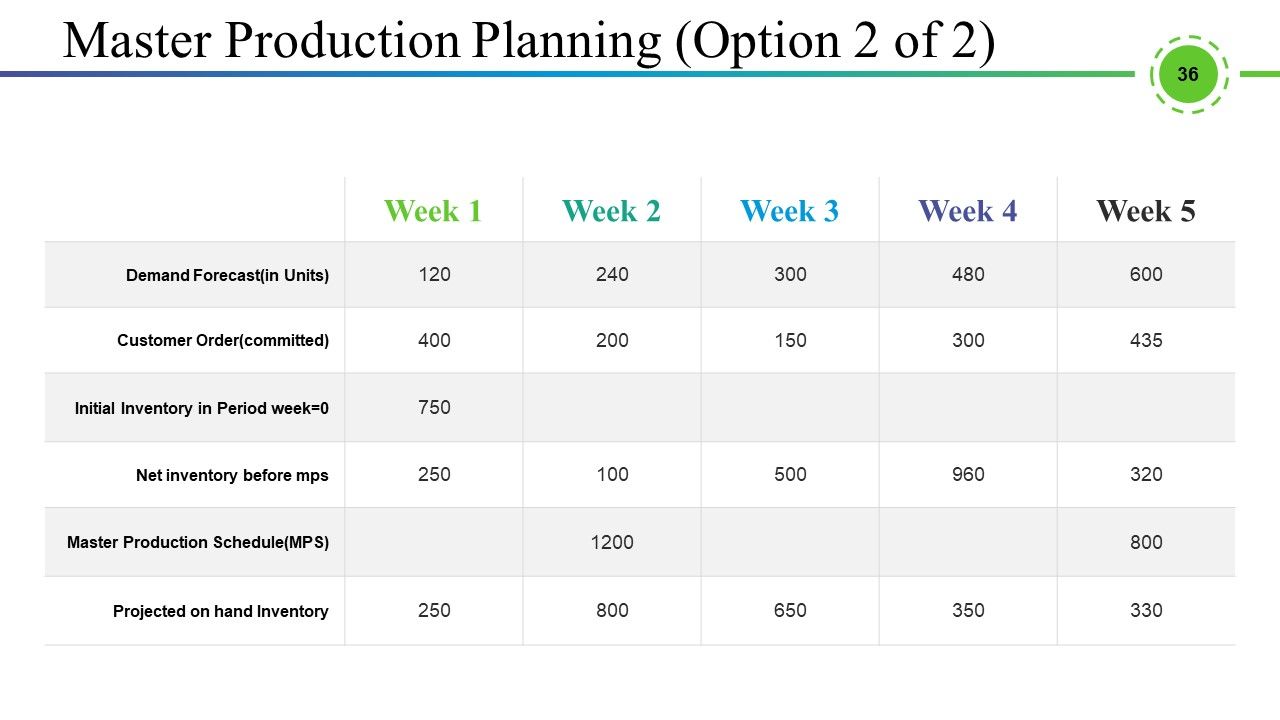
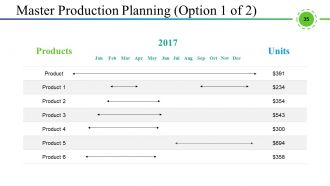
Slide 35: This is Master Production Planning slide in tabular form.
Slide 36: This is Master Production Planning slide in tabular form.
Slide 37: This slide presents Inventory Management displaying- Introduction, EOQ Model, EOQ Model Cost Curves, EOQ Cost, EOQ Important Characteristics, EOQ Basic Assumptions.
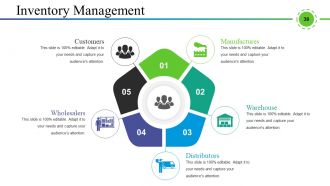
Slide 38: This is Inventory Management slide showcasing- Manufactures, Warehouse, Distributors, Wholesalers, Customers.
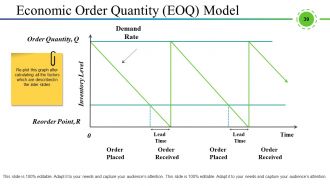
Slide 39: This slide shows Economic Order Quantity (EOQ) Model displaying- Reorder Point, R, Order Quantity, Q Order, Placed, Received, Time, Lead, Time, Lead, Time, Demand, Rate, Inventory Level. Re-plot this graph after calculating all the factors which are described in the later slides.
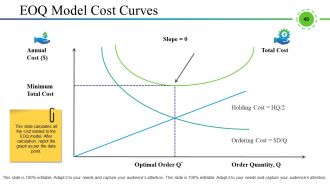
Slide 40: This slide shows EOQ Model Cost Curves displaying- Slope, Total Cost, Annual, Cost ($), Minimum, Total Cost, Order Quantity, Q Optimal Order Q*, Ordering Cost = SD/Q, Holding Cost = HQ/2. This slide helps calculates all the cost related to the EOQ model. After calculation, replot the graph as per the data point.
Slide 41: This slide shows EOQ Cost Model displaying- Annual Demand, Order Quantity, Cost Of Placing Order, Annual Per-unit Holding Cost, Ordering cost = SD/Q, Holding cost = HQ/2, Total Cost = SD/Q + HQ/2.
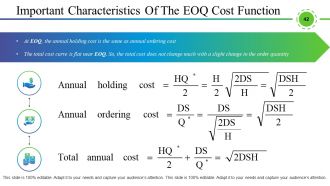
Slide 42: This sldie showcases Important Characteristics Of The EOQ Cost Function.
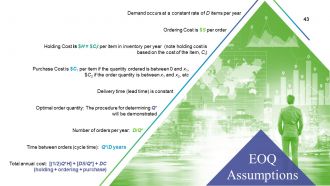
Slide 43: This slide shows EOQ Assumptions- Demand occurs at a constant rate of D items per year, Ordering Cost, Holding Cost, Purchase Cost, Delivery time, Optimal order quantity, Number of orders per year, Time between orders (cycle time), Total annual cost (holding + ordering + purchase).
Slide 44: This slide showcases Inventory Management Models such as- Bi-Level Optimization, Stochastic Modeling, Uncertainty Modeling.
Slide 45: This slide shows Stochastic Modeling.
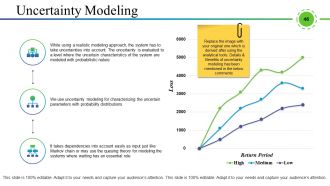
Slide 46: This slide presents Uncertainty Modeling.
Slide 47: This slide displays Bi-Level Optimization.
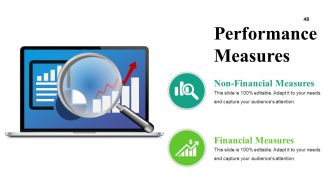
Slide 48: This slide shows Performance Measures such as- Non-Financial Measures, Financial Measures.
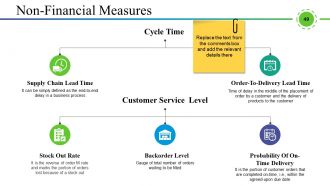
Slide 49: This slide shows Non-Financial Measures undertaken- Supply Chain Lead Time, Order-To-Delivery Lead Time, Cycle Time, Customer Service Level, Stock Out Rate, Backorder Level, Probability Of On-Time Delivery.
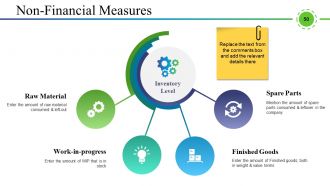
Slide 50: This slide shows Non-Financial Measures such as- Inventory Level, Spare Parts, Raw Material, Finished Goods, Work-in-progress.
Slide 51: This is also Non-Financial Measures slide displaying- Manufacturing Resources, Storage Resources, Logistic Resources, Human Resources, Financial Resources, Resource Utilization. The main motto is to utilize all the assets or resources efficiently in order to maximize customer service levels, reduce lead times and optimize inventory levels. So, Enter the required parameters.
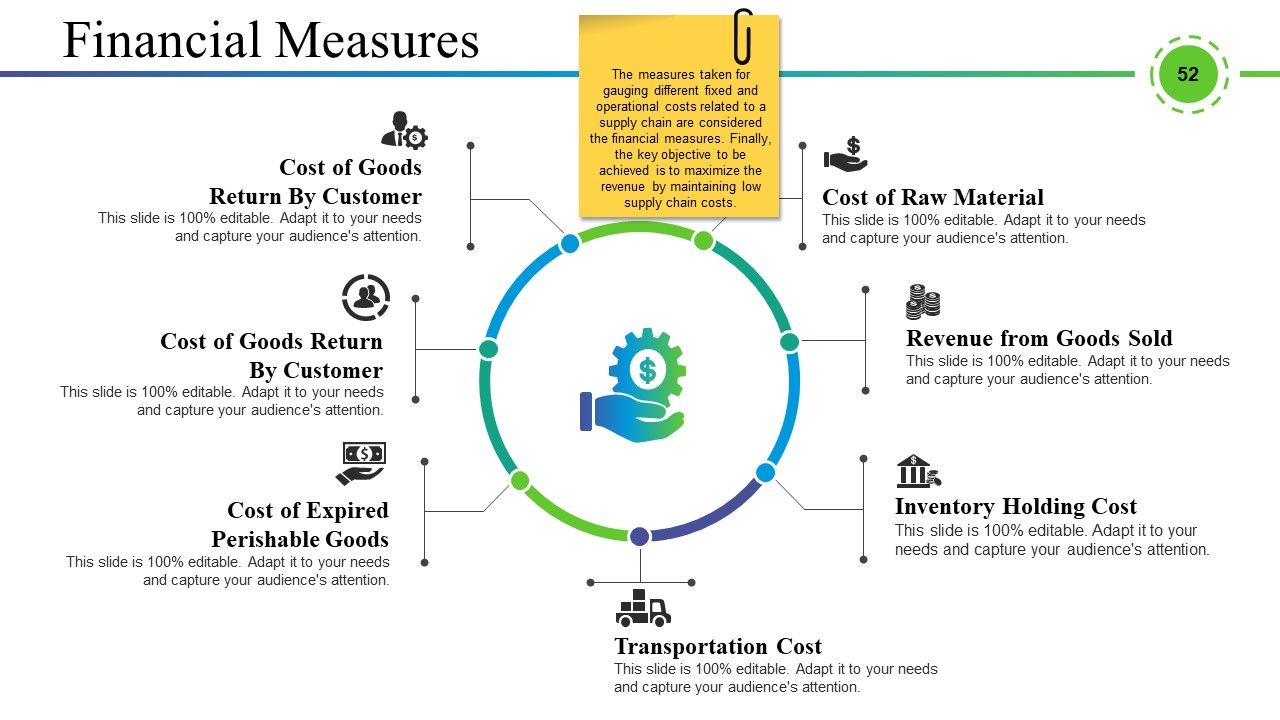
Slide 52: This is Financial Measures slide displaying- Cost of Raw Material, Revenue from Goods Sold, Inventory Holding Cost, Transportation Cost, Cost of Expired Perishable Goods, Cost of Goods Return By Customer.
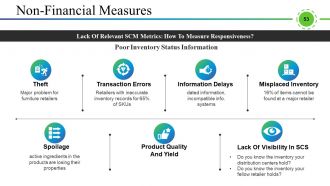
Slide 53: This slide displays Non-Financial Measures such as- Theft, Transaction Errors, Information Delays, Misplaced Inventory, Product Quality And Yield Spoilage, Lack Of Visibility In SCS.
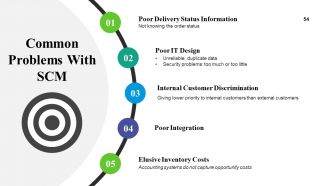
Slide 54: This slide showcases Common Problems With SCM displaying- Poor Delivery Status Information, Poor IT Design, Internal Customer Discrimination, Poor Integration, Elusive Inventory Costs.
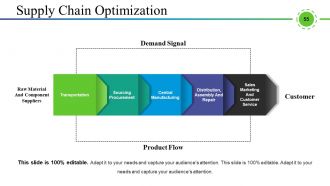
Slide 55: This slide shows Supply Chain Optimization such as- Raw Material And Component Suppliers, Customer, Product Flow, Demand Signal, Transportation, Sourcing Procurement, Central Manufacturing, Distribution, Assembly And Repair, Sales Marketing And Customer Service.
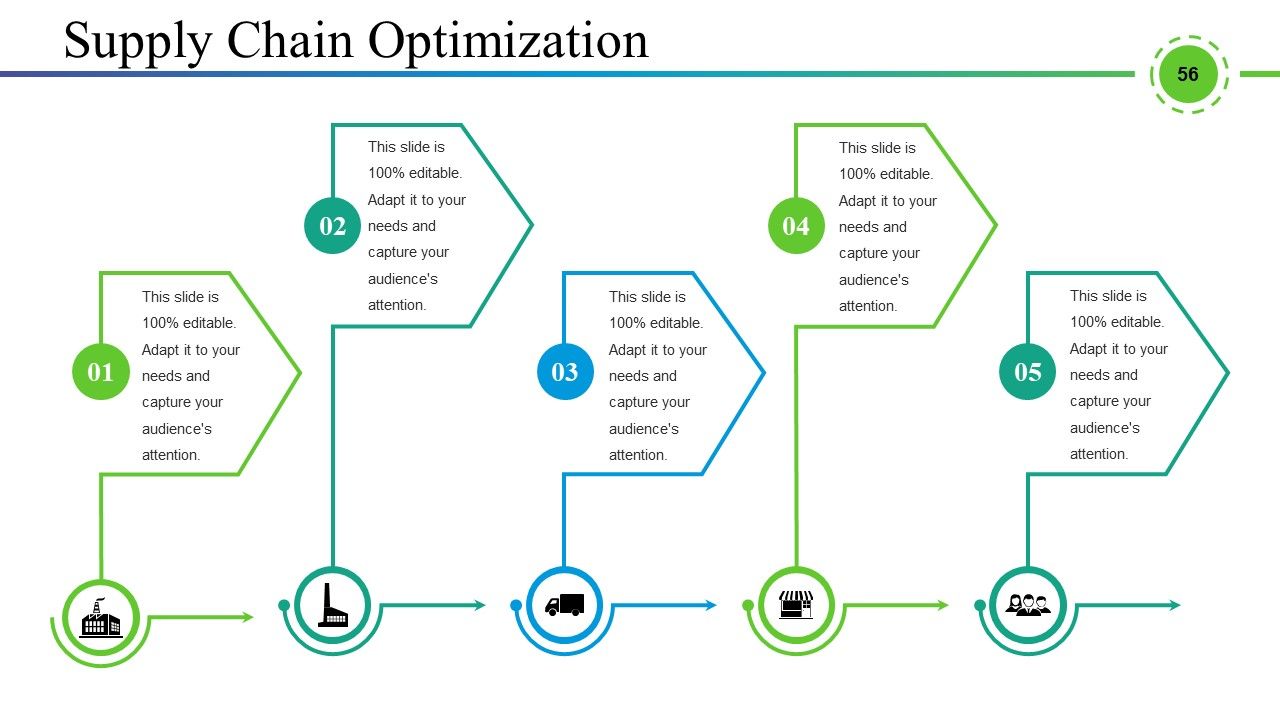
Slide 56: This slide presents Supply Chain Optimization diagram.
Slide 57: This slide is titled Graph and chart. You may change the slide as per need.
Slide 58: This is a Donut Pie Chart slide to show product/entity comparison, specifications etc.
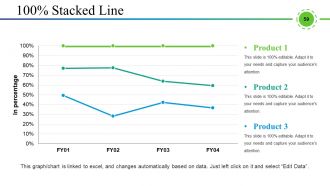
Slide 59: This is a Stacked Line Chart slide to show product/entity comparison, specifications etc.
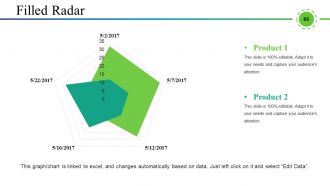
Slide 60: This is a Filled Radar Chart slide to show product/entity comparison, specifications etc.
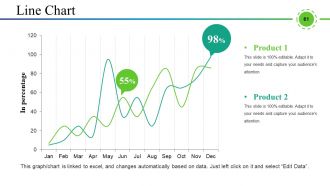
Slide 61: This is a Line Chart slide to show product/entity comparison, specifications etc.
Slide 62: This slide is titled Additional Slides. You may change content as per your need.
Slide 63: This slide contains Our Mission with Vision and Goal. State them here.
Slide 64: This slide presents Our Team with designation, image text holder and text boxes to fill information.
Slide 65: This is an About Us slide. State your position, facts or anything business here.
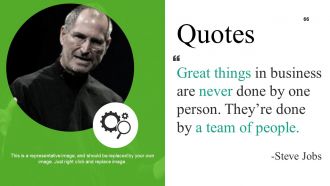
Slide 66: This is a Quotes slide. Present company beliefs, messages etc. here.
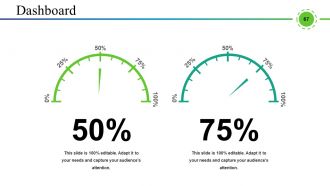
Slide 67: This is a Dashboard slide to state Low, medium and High aspects, kpis, metrics etc.
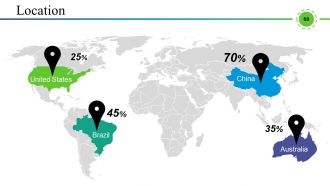
Slide 68: This is Location slide of world map image to show global growth, presence etc.
Slide 69: This is Our Goal slide. State your goals here.
Slide 70: This slide shows Comparison of two entities in creative imagery form. State comparison specifications etc. here.
Slide 71: This slide shows Silhouettes with text boxes. State people related information, specifications etc. here.
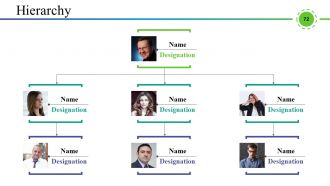
Slide 72: This is a Hierarchy Chart slide to show team information, organizational specifications etc.
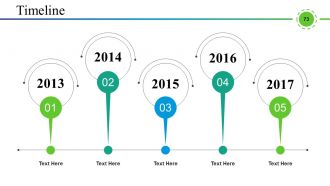
Slide 73: This slide presents a Timeline to show growth, milestones, journey, evolution etc.
Slide 74: This is a Mind map image slide to show information, segregation, specifications etc.
Slide 75: This is a Puzzle image slide with text boxes to state information, specifications etc.
Slide 76: This is a Business Idea image slide to state information, specifications etc.
Slide 77: This is a Thank You slide with Email, Address# street number, city, state, Contact Numbers.
Supply Chain Management And Logistics Powerpoint Presentation Slides with all 77 slides:
Feel free and easy with our Supply Chain Management And Logistics Powerpoint Presentation Slides. They create a cheerful atmosphere.
-
Use of icon with content is very relateable, informative and appealing.
-
Very unique and reliable designs.
-
Very good template designs


