Six sigma process analysis and approach complete powerpoint deck with slides
Are you looking for a complete pre made six sigma model PPT sample? No problem! With our pre built six sigma process analysis and approach PowerPoint presentation you have an ideal chance to make a good impression on your audience. To help further here we are sharing few ideas to use this PowerPoint slide deck. This six sigma process PPT model helps to lay emphasis on lean manufacturing or lean enterprise approach so as to motivate employees for judicious use of resources. Furthermore, you can accomplish more in your business by using our PPT sample file as a symbolic visual message to employees for improving quality, reduce waste and go for team formation. Besides this, our presentation deck is conceptualized in a way to portray various other related concepts like lean six sigma tools, six sigma dmaic, dmaic methodology, total quality management, statistical quality control, design for six sigma and many more. So why wait? Instantly download our exclusive PPT example and take your manufacturing and business processes to the next level. Get thousands of hours of design work into your next presentation. Six Sigma Process Analysis And Approach Complete Powerpoint Deck With Slides are at your fingertips mere seconds away.
You must be logged in to download this presentation.
 Impress your
 audience
Editable
of Time
PowerPoint presentation slides
Collection of 60 template themes ideal for your next project. Freely put your text or titles in any templates design without space issue. Insert company name, logo and trademark to make it your property. Manual editing option given for user to accomplish more. Record time downloading speed. Temporary watermark for easy removal process. Well supports both PDF and JPG formats. Goes perfectly with Google slides. The stages in this process are lean six sigma, strategic management, productive maintenance, process capability, statistical methods.
People who downloaded this PowerPoint presentation also viewed the following :
Content of this Powerpoint Presentation
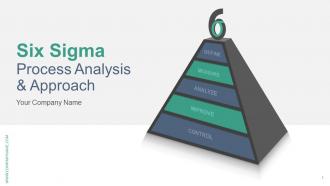
Slide 1: This slide introduces Six Sigma Process Analysis & Approach. State Your Company Name and get started.
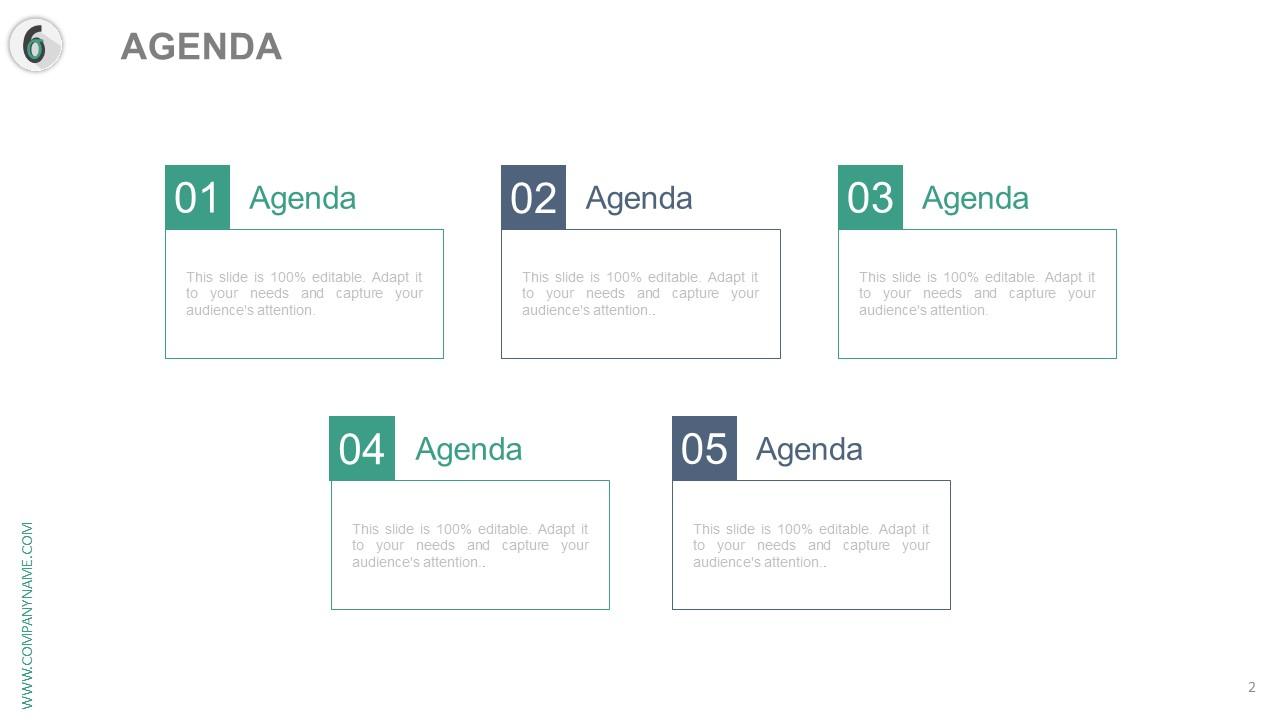
Slide 2: This is an Agenda slide. State your agendas here.
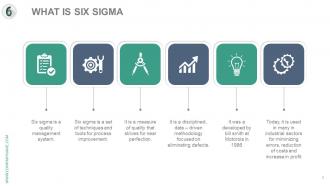
Slide 3: This slide showcases What is Six Sigma with the following content- Six sigma is a quality management system. Six sigma is a set of techniques and tools for process improvement. It is a measure of quality that strives for near perfection. It is a disciplined , data – driven methodology focused on eliminating defects. It was a developed by bill smith at Motorola in 1986 To day, it is used in many in industrial sectors for minimizing errors, reduction of costs and increase in profit
Slide 4: This slide shows a Six Sigma Road map with the following subheadings- Build Project From Nonconformance, Feedback & Audits, Monitor Live Dashboard, Collect Measurements, Correct, Design, Train & Document, Analyze Processes Online (OLAP) as Define, Measure, Analyze, Improve/Design, Control/Verify.
Slide 5: This slide presents the Six Sigma Process with the following content- Practical Problem: Understand the problem that impact business performance. Statistical Problem: Identify the problem with data and facts Statistical Solution: Find out a data driven and reliable solution Practical Solution: Provide a solution to increase profit reduce Control Plan: Create a system to sustain a long term solution Result: Measure and reap the benefit of financial success as Recognize Realize Measure Analyze Control Improve Define Voice Customer & Voice Of Process.
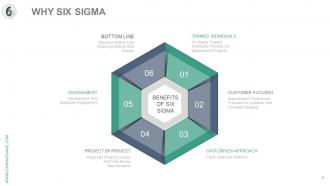
Slide 6: This slide shows WHY SIX SIGMA with the following subheading Benefits Of Six Sigma divided into- Customer Focused, Data Driven Approach, Bottom Line, Enagagement, Trained Individuals, Project By Project.
Slide 7: This slide shows WHY SIX SIGMA with the following subheadings- Customer Focused, Data Driven Approach, Bottom Line, Enagagement, Trained Individuals, Project By Project.
Slide 8: This slide shows Six Sigma Methodologies showing- Defect Reduction, Cycle Time Reduction, CFPM, DSSS+ DMAIC, DMADV, DMADOV, Design & Manufacture, Designing New Processes, Improving Existing Cross-functional Processes, Software Development, Improving Cross-functional Processes, Cross Function Process Mapping, Developing Six Sigma Software, Define Measure Analyze Design Verify, Define Measure Analyze Design Optimize Verify, Define Measure Analyze Improve Control.
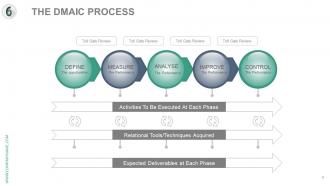
Slide 9: This slide showcases the DMAIC Process showcasing- Relational Tools/Techniques Acquired Expected Deliverables at Each Phase Activities To Be Executed At Each Phase DEFINE: The opportunities MEASURE: The Performance ANALYSE: The Performance IMPROVE: The Performance CONTROL: The Performance and Toll Gate Review.
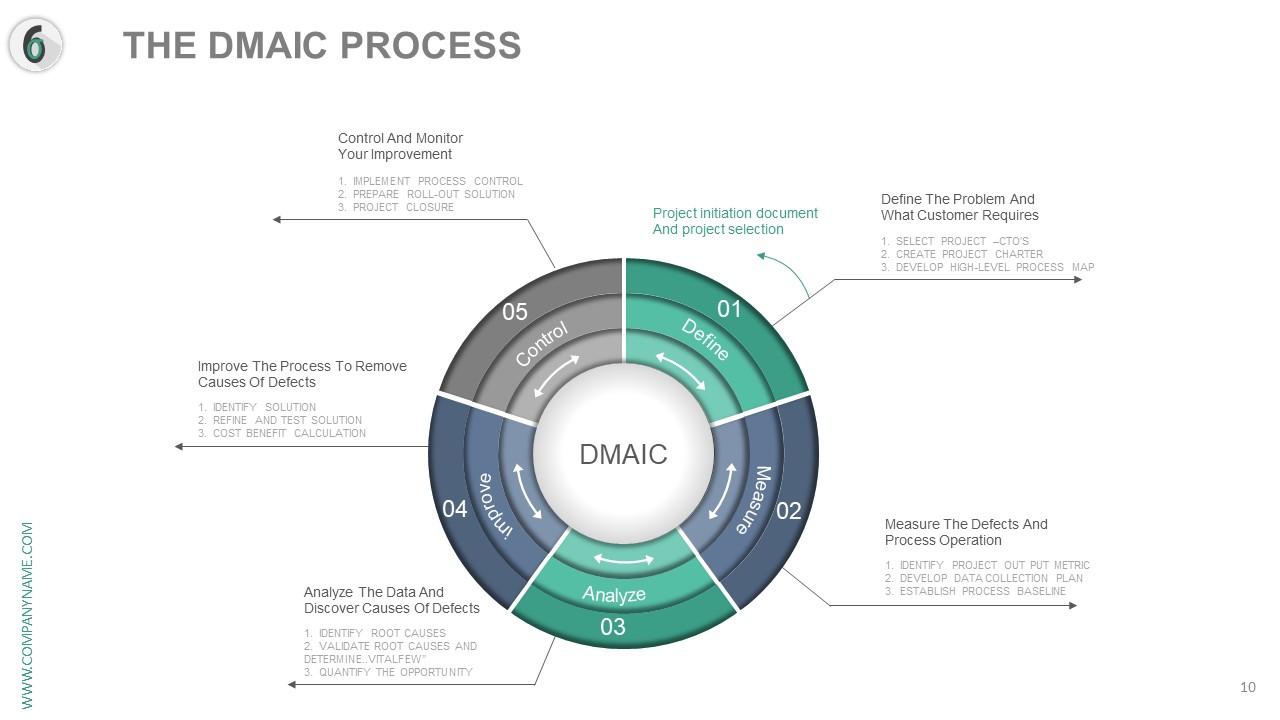
Slide 10: This slide presents The DMAIC Process showing- Project initiation document And project selection Define The Problem And What Customer Requires 1. SELECT PROJECT –CTO’S 2. CREATE PROJECT CHARTER 3. DEVELOP HIGH-LEVEL PROCESS MAP Measure The Defects And Process Operation 1. IDENTIFY PROJECT OUT PUT METRIC 2. DEVELOP DATA COLLECTION PLAN 3. ESTABLISH PROCESS BASELINE Analyze The Data And Discover Causes Of Defects 1. IDENTIFY ROOT CAUSES 2. VALIDATE ROOT CAUSES AND DETERMINE..VITALFEW’’ 3. QUANTIFY THE OPPORTUNITY Improve The Process To Remove Causes Of Defects 1. IDENTIFY SOLUTION 2. REFINE AND TEST SOLUTION 3. COST BENEFIT CALCULATION Control And Monitor Your Improvement 1. IMPLEMENT PROCESS CONTROL 2. PREPARE ROLL-OUT SOLUTION 3. PROJECT CLOSURE Define, Measure, Analyze, improve, Control.
Slide 11: This slide elaborates STEP 1: DEFINE.
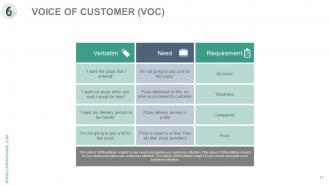
Slide 12: This slide presents the Voice Of Customer with- Need, Requirement, Verbatim.
Slide 13: This slide showcases VOICE OF CUSTOMER (VOC) in funnel form.
Slide 14: This slide showcases VOICE OF CUSTOMER (VOC) in arrow form.
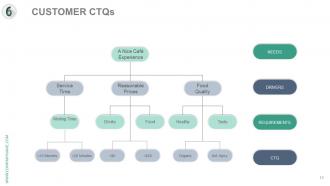
Slide 15: This slide showcases Customer CTQs in hierarchy form displaying- REQUIREMENTS, CTQ, DRIVERS, NEEDS.
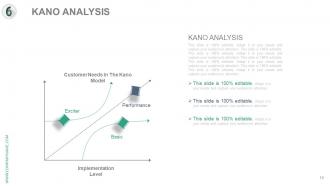
Slide 16: This slide showcases Kano Anlaysis with- Exciter, Performance, Basic, Customer Needs In The Kano Model, Implementation Level.
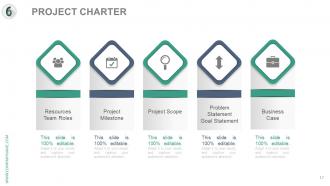
Slide 17: This slide showcases Project Charter displaying- Resources, Team Roles, Project, Milestone, Project Scope, Problem, Statement, Goal Statement, Business Case.
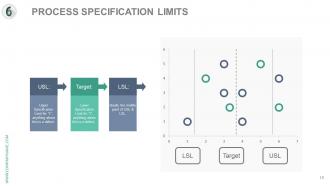
Slide 18: This slide showcases Process Specificiation Limits showing- LSL USL Target USL: Upper Specification Limit for ‘Y’, anything above this is a defect. Target: Lower Specification Limit for ‘Y’, anything above this is a defect.. LSL: Ideally the middle point of USL & LSL in bubble chart form.
Slide 19: This slide showcases Process Mapping SIPOC with- C- CUSTOMER, O- OUTPUT, P- PROCESS, I- INPUT, S- SUPPLIERS.
Slide 20: This slide showcases Suppliers, Process, Customers, Output, Input.
Slide 21: This slide shows Process Mapping Flow Charting.
Slide 22: This slide showcases STEP 2: MEASURE.
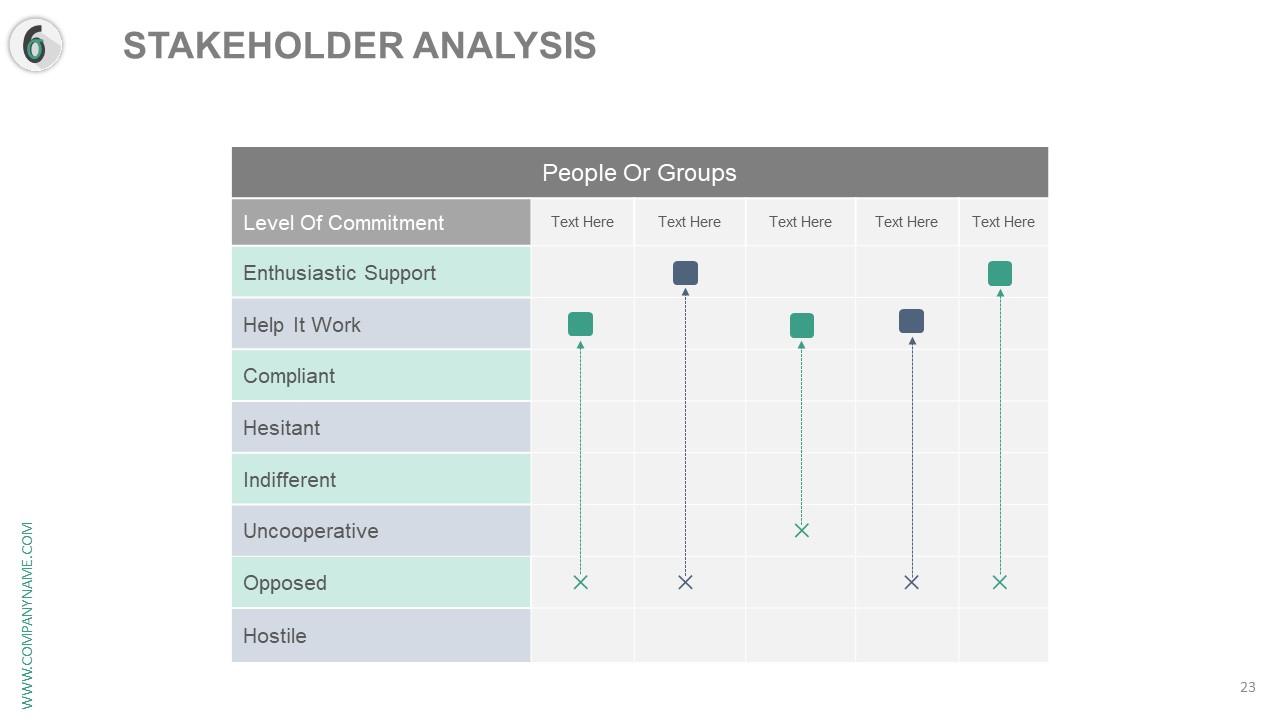
Slide 23: This slide shows Stakeholder Analysis in tabular form.
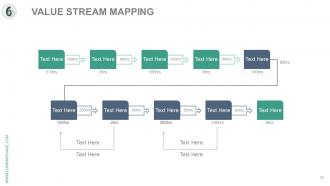
Slide 24: This slide showcases a Value Stream Map.
Slide 25: This slide also presents Value Stream Mapping.
Slide 26: This is a CHECK SHEET slide in tabular form.
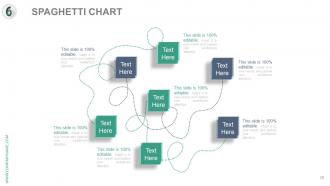
Slide 27: This slide displays a Spaghetti Chart diagram- also used to described movement of people in a factory or office (motion is waste)
Slide 28: This slide displays a Spaghetti Chart.
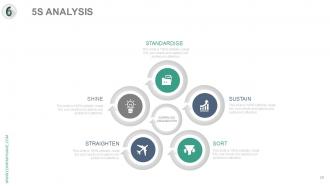
Slide 29: This slide shows 5S ANALYSIS namely- STRAIGHTEN, SORT, SHINE, SUSTAIN, STANDARDISE.
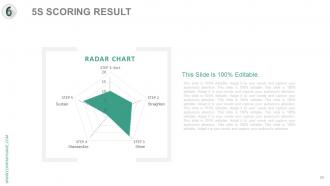
Slide 30: This slide shows 5S SCORING RESULT namely- Sustain, Straighten, Shine, Standardize.
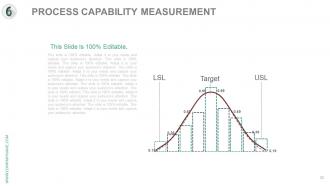
Slide 31: This slide shows Process Capability Measurement in crest graph form.
Slide 32: This slide also shows Process Capability Measurement in crest graph form displaying LSL, USL and TARGET.
Slide 33: This slide showcases a XBAR AND R-CHART for presenting monitored variable data.
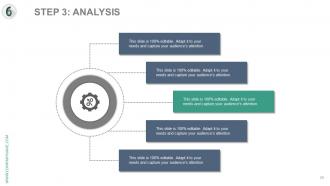
Slide 34: This slide displays STEP 3: ANALYSIS.
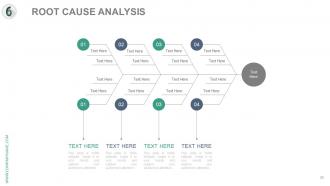
Slide 35: This slide shows Root Cause Analysis diagram.
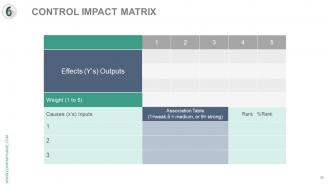
Slide 36: This slide shows a CONTROL IMPACT MATRIX.
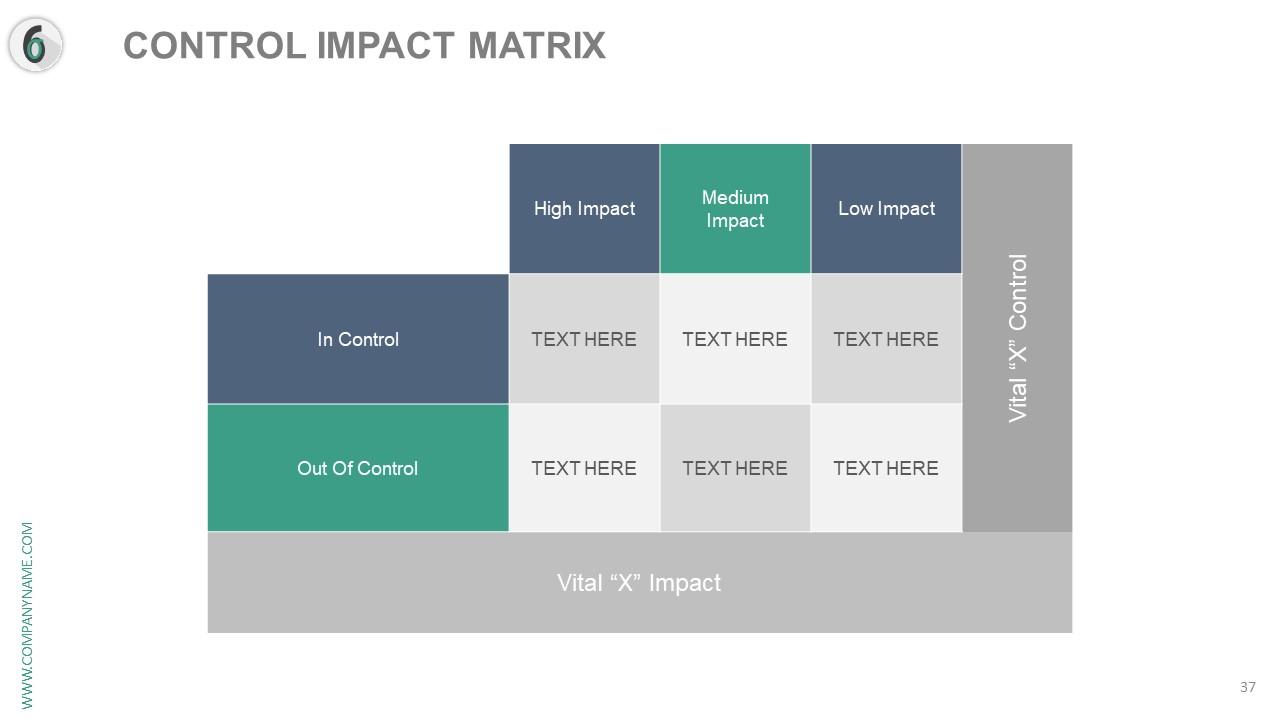
Slide 37: This slide also shows a CONTROL IMPACT MATRIX.
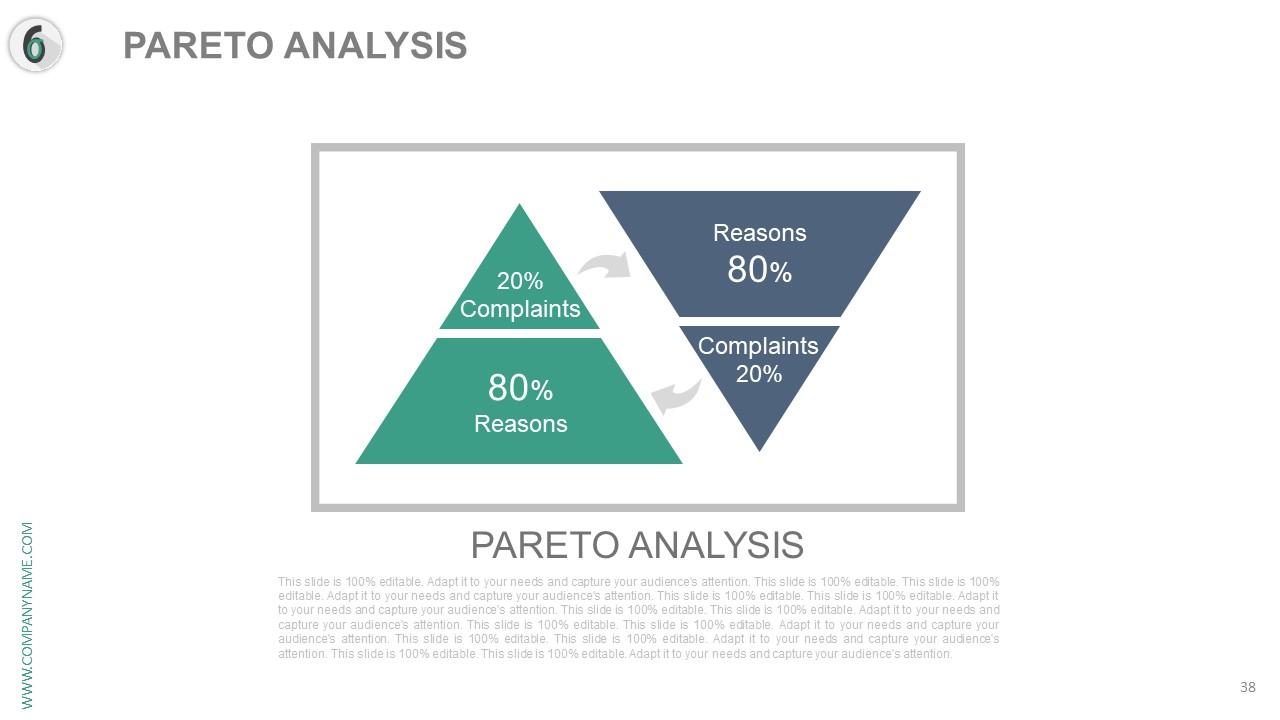
Slide 38: This slide displays Pareto Analysis.
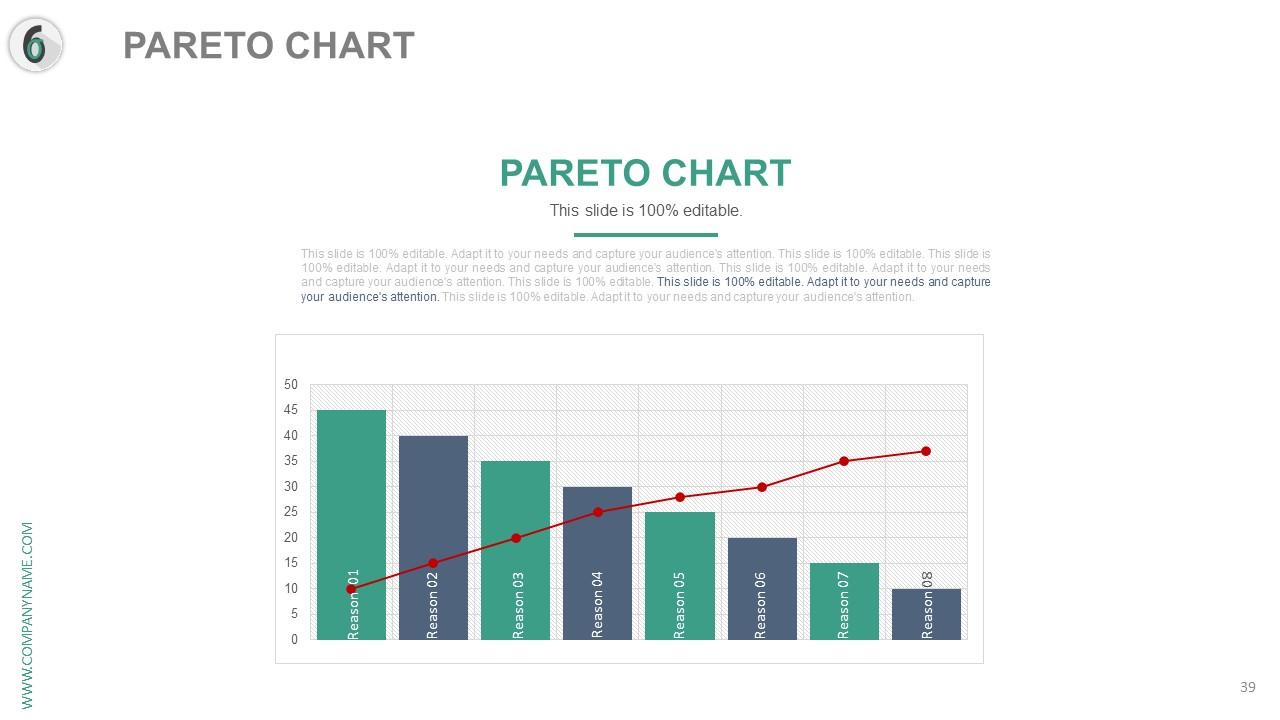
Slide 39: This slide displays Pareto Chart Analysis in graph form.
Slide 40: This slide also displays Pareto Analysis in graph form.
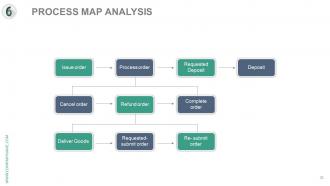
Slide 41: This slide shows PROCESS MAP ANALYSIS displaying- Issue order, Cancel order, Deliver Goods, Process order, Refund order, Requested- submit order, Requested Deposit, Complete order, Re- submit order, Deposit.
Slide 42: This slide shows STEP 4: IMPROVE.
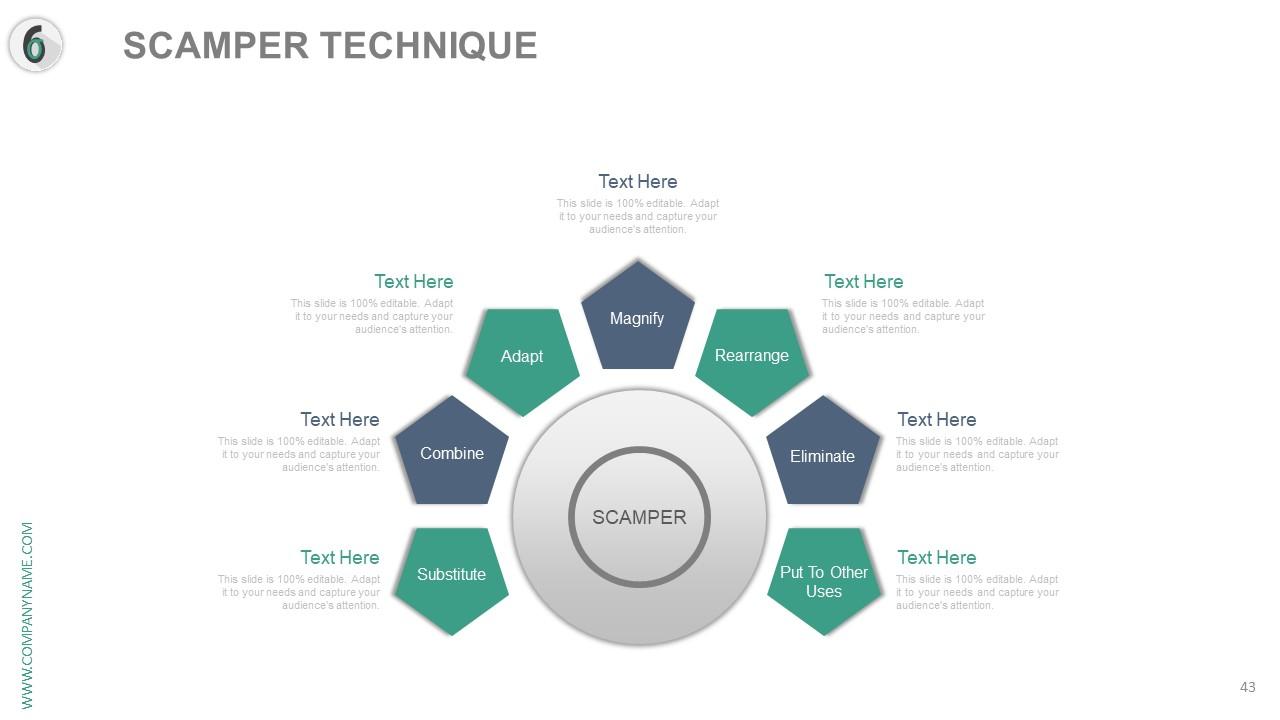
Slide 43: This slide displays the SCAMPER TECHNIQUE- Substitute Combine Adapt Magnify Rearrange Eliminate Put To Other Uses.
Slide 44: This slide displays the Scamper Technique showing- Reverse, Eliminate, Put To Another Use, Modify, Adapt, Combine, Substitute.
Slide 45: This slide is titled POSSIBLE SOLUTIONS in puzzle image form.
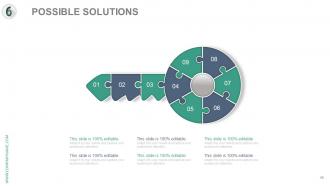
Slide 46: This slide is titled POSSIBLE SOLUTIONS in puzzle key image form.
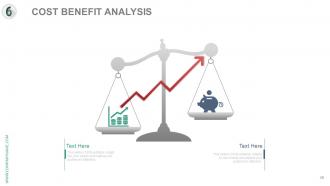
Slide 47: This slide shows Cost Benefit Analysis in balance image form.
Slide 48: This slide too shows Cost Benefit Analysis in balance image form.
Slide 49: This slide showcases Failure Mode Effect Analysis displaying- Ranking, Severity, Occurrence, Detectability.
Slide 50: This slide shows STEP 5: CONTROL
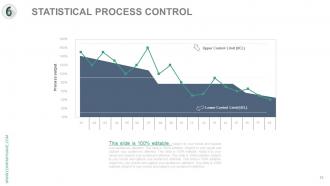
Slide 51: This slide shows STATISTICAL PROCESS CONTROL displaying- Upper Control Limit (UCL), Lower Control Limit (UCL) with Process output.
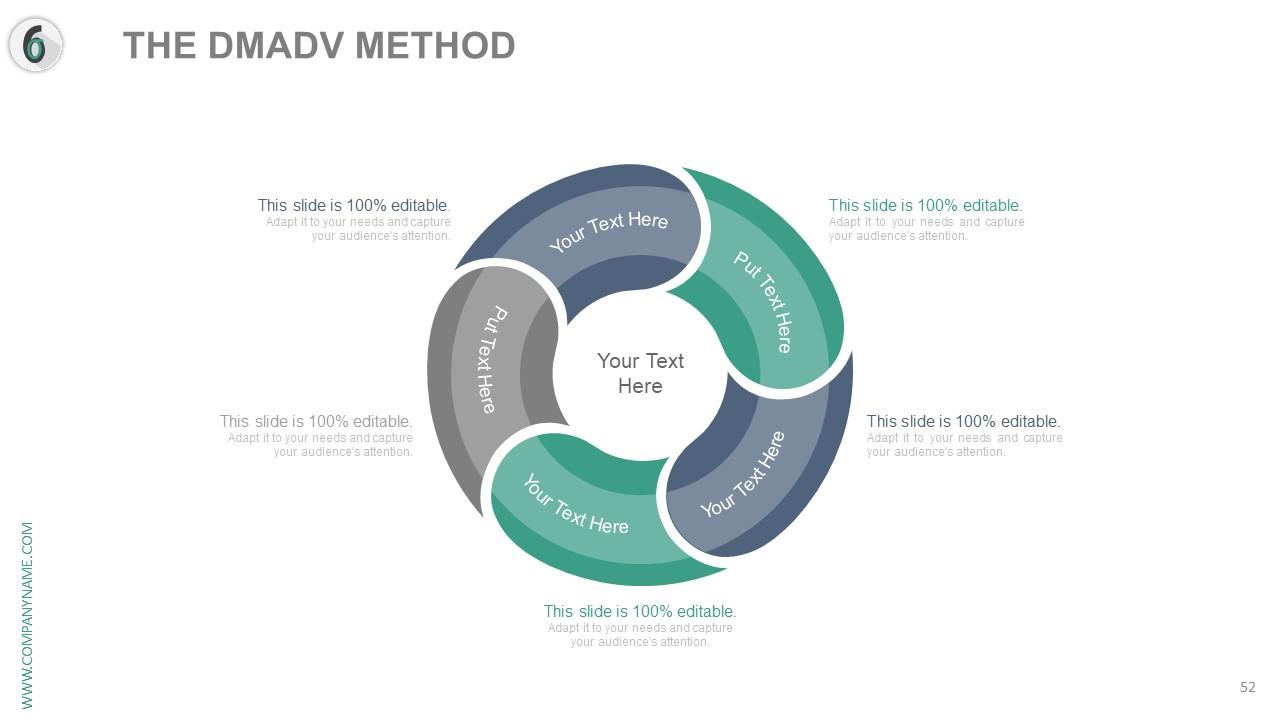
Slide 52: This slide presents The DMADV Method.
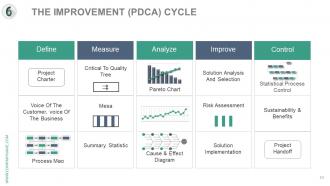
Slide 53: This slide elaborates The Improvement (PDCA) Cycle showcasing- Analyze: Pareto Chart, Cause & Effect Diagram. Improve: Solution Analysis And Selection, Solution Implementation, Risk Assessment. Control: Sustainability & Benefits, Project Handoff, Statistical Process Control. Meaure: Summary Statistic, Critical To Quality Tree. Define: Project Charter, Voice Of The Customer, voice Of The Business, Process Map.
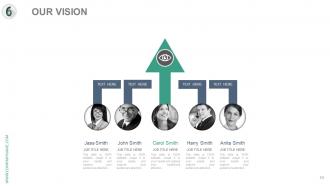
Slide 54: This is Our Vision slide. State it here.
Slide 55: This is Our team slide with name, designation and text boxes to state information.
Slide 56: This is a Target with Arrow slide. State your targets here.
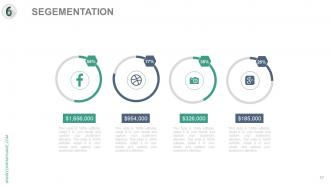
Slide 57: This slide is titled Segmentation to showcase market segments, product segments etc.
Slide 58: This is New Market Location slide of world map image. Mark specific locations for company growth, market etc. here.
Slide 59: This is a Timeline slide to present important dates, evolution, milestones etc.
Slide 60: This is a Thank You slide for acknowledgement with image.
Six sigma process analysis and approach complete powerpoint deck with slides with all 60 slides:
Use our Six Sigma Process Analysis And Approach Complete Powerpoint Deck With Slides to effectively help you save your valuable time. They are readymade to fit into any presentation structure.
-
Excellent template with unique design.
-
Unique and attractive product design.
-
Presentation Design is very nice, good work with the content as well.
-
Great experience, I would definitely use your services further.
-
Great quality slides in rapid time.
-
Top Quality presentations that are easily editable.
-
Unique research projects to present in meeting.
-
Unique research projects to present in meeting.
-
Unique research projects to present in meeting.


