Pricing Strategies PowerPoint Templates, Presentation Slides & PPT Templates
- Sub Categories
-
- 30 60 90 Day Plan
- About Us Company Details
- Action Plan
- Agenda
- Annual Report
- Audit Reports
- Balance Scorecard
- Brand Equity
- Business Case Study
- Business Communication Skills
- Business Plan Development
- Business Problem Solving
- Business Review
- Capital Budgeting
- Career Planning
- Change Management
- Color Palettes
- Communication Process
- Company Location
- Company Vision
- Compare
- Competitive Analysis
- Corporate Governance
- Cost Reduction Strategies
- Custom Business Slides
- Customer Service
- Dashboard
- Data Management
- Decision Making
- Digital Marketing Strategy
- Digital Transformation
- Disaster Management
- Diversity
- Equity Investment
- Financial Analysis
- Financial Services
- Financials
- Growth Hacking Strategy
- Human Resource Management
- Innovation Management
- Interview Process
- Knowledge Management
- Leadership
- Lean Manufacturing
- Legal Law Order
- Management
- Market Segmentation
- Marketing
- Media and Communication
- Meeting Planner
- Mergers and Acquisitions
- Metaverse
- Newspapers
- Operations and Logistics
- Organizational Structure
- Our Goals
- Performance Management
- Pitch Decks
- Pricing Strategies
- Process Management
- Product Development
- Product Launch Ideas
- Product Portfolio
- Project Management
- Purchasing Process
- Quality Assurance
- Quotes and Testimonials
- Real Estate
- Risk Management
- Sales Performance Plan
- Sales Review
- SEO
- Service Offering
- Six Sigma
- Social Media and Network
- Software Development
- Solution Architecture
- Stock Portfolio
- Strategic Management
- Strategic Planning
- Supply Chain Management
- Swimlanes
- System Architecture
- Team Introduction
- Testing and Validation
- Thanks-FAQ
- Time Management
- Timelines Roadmaps
- Value Chain Analysis
- Value Stream Mapping
- Workplace Ethic
-
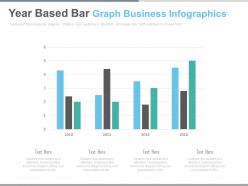
 Year based bar graph business infographics powerpoint slides
Presenting year based bar graph business infographics powerpoint slides. This Power Point template diagram with graphic of year based bar graph diagram. This PPT diagram contains the concept of data analysis. Use this PPT diagram for business and finance related presentations.
-
 Portfolio price analysis strategy ppt icons graphics
Presenting portfolio price analysis strategy ppt icons graphics. This Power Point template slide has been crafted with graphic of portfolio and finance icons. This PPT slide contains the concept of portfolio price strategy and analysis. Use this PPT slide for business and finance related presentations.
-
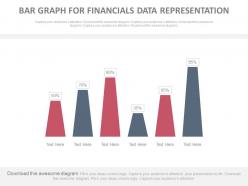
 Bar graph for financial data representation powerpoint slides
Presenting bar graph for financial data representation powerpoint slides. This Power Point template slide has been crafted with graphic of bar graph and data. This PPT slide contains the concept of financial data representation. Use this PPT slide for business and finance related presentations.
-
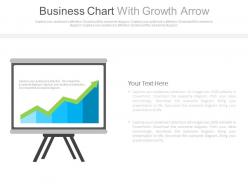
 Business chart with growth arrow for finance powerpoint slides
Presenting business chart with growth arrow for finance powerpoint slides. This Power Point template slide has been crafted with graphic of business chart and growth arrow. This PPT slide contains the concept of financial data analysis and growth representation. Use this PPT slide for business and finance related presentations.
-
 Date and days chart for financial process powerpoint slides
Presenting date and days chart for financial process powerpoint slides. This Power Point template slide has been crafted with graphic of date and days chart. This PPT slide contains the concept of financial process flow representation. Use this PPT slide for business and finance related presentations.
-
 Doughnut chart with percentage analysis powerpoint slides
Presenting doughnut chart with percentage analysis powerpoint slides. This Power Point template slide has been crafted with graphic of doughnut chart and percentage. This PPT slide contains the concept of financial data analysis representation. Use this PPT slide for business and finance related presentations.
-
 Financial data table for analysis powerpoint slides
Presenting financial data table for analysis powerpoint slides. This Power Point template slide has been crafted with graphic of data table. This PPT slide contains the concept of financial data analysis. Use this PPT slide for business and finance related presentations.
-
 Financial distribution tags for social media market share powerpoint slides
Presenting financial distribution tags for social media market share powerpoint slides. This Power Point template slide has been crafted with graphic of tags . This PPT slide contains the concept of financial distribution for social media market share. Use this PPT slide for business and finance related presentations.
-
 Five pie charts for financial percentage analysis powerpoint slides
Presenting five pie charts for financial percentage analysis powerpoint slides. This Power Point template slide has been crafted with graphic of five pie charts. This PPT slide contains the concept of financial percentage analysis. Use this PPT slide for business and finance related presentations.
-
 Five staged bar graph for business development and testing powerpoint slides
Presenting five staged bar graph for business development and testing powerpoint slides. This Power Point template slide has been crafted with graphic of five staged bar graph. This PPT slide contains the concept of business development and testing. Use this PPT slide for business and finance related presentations.
-
 Five staged bar graph for financial data analysis powerpoint slides
Presenting five staged bar graph for financial data analysis powerpoint slides. This Power Point template slide has been crafted with graphic of five staged bar graph. This PPT slide contains the concept of financial data analysis. Use this PPT slide for business and finance related presentations.
-
 Four staged pricing table for financial analysis powerpoint slides
Presenting four staged pricing table for financial analysis powerpoint slides. This Power Point template slide has been crafted with graphic of four staged pricing table. This PPT slide contains the concept of financial data analysis. Use this PPT slide for business and finance related presentations.
-
 Four tags chart for financial agenda analysis powerpoint slides
Presenting four tags chart for financial agenda analysis powerpoint slides. This Power Point template slide has been crafted with graphic of four tags chart. This PPT slide contains the concept of financial agenda analysis. Use this PPT slide for business and finance related presentations.
-
 Four tags for financial data and info analysis powerpoint slides
Presenting four tags for financial data and info analysis powerpoint slides. This Power Point template slide has been crafted with graphic of four tags. This PPT slide contains the concept of financial data and info analysis. Use this PPT slide for business and finance related presentations.
-
 Four tags for financial percentage and data powerpoint slides
Presenting four tags for financial percentage and data powerpoint slides. This Power Point template slide has been crafted with graphic of four tags. This PPT slide contains the concept of financial data and percentage analysis. Use this PPT slide for business and finance related presentations.
-
 Four tags for financial process analysis powerpoint slides
Presenting four tags for financial process analysis powerpoint slides. This Power Point template slide has been crafted with graphic of four tags. This PPT slide contains the concept of financial process flow analysis. Use this PPT slide for business and finance related presentations.
-
 Higher to lower pricing table for financial value updation powerpoint slides
Presenting higher to lower pricing table for financial value updation powerpoint slides. This Power Point template slide has been crafted with graphic of pricing table. This PPT slide contains the concept of higher to lower financial value updation and representation. Use this PPT slide for business and finance related presentations.
-
 Line chart for finance data analysis powerpoint slides
Perfect PPT slide for marketing and sales people, business analysts, market researchers. Completely editable content including fonts, text, colors, etc. Useful illustration of numerical figures using editable excel linked chart. Compatible with number of software options. Personalize the presentation with individual company name and logo. Excellence in picture quality even on wide screen output. Easy and quick downloading process. Flexible option for conversion in PDF or JPG formats. Compatible with Google slides.
-
 Three infographic tags for financial data representation powerpoint slides
Presenting three infographic tags for financial data representation powerpoint slides. This Power Point template slide has been crafted with graphic of three info graphic tags. This PPT slide contains the concept of financial data representation. Use this PPT slide for business and finance related presentations.
-
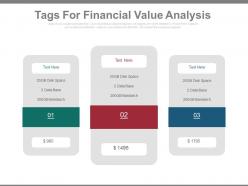
 Three tags for financial value analysis powerpoint slides
Presenting three tags for financial value analysis powerpoint slides. This Power Point template slide has been crafted with graphic of three tags. This PPT slide contains the concept of financial value analysis. Use this PPT slide for business and finance related presentations.
-
 Two awards for leader and business powerpoint slides
Presenting two awards for leader and business powerpoint slides. This Power Point template slide has been crafted with graphic of two awards. This PPT slide contains the concept of success milestones representation. Use this PPT slide for business and finance related presentations.
-
 Bar chart with years for financial data valuation powerpoint slides
Presenting bar chart with years for financial data valuation powerpoint slides. This Power Point template slide has been crafted with graphic of bar chart and finance icons. This PPT slide contains the concept of financial data valuation. Use this PPT slide for business and finance related presentations.
-
 Bar graph with percentage analysis powerpoint slides
Presenting bar graph with percentage analysis powerpoint slides. This is a bar graph with percentage analysis powerpoint slides. This is a five stage process. The stages in this process are financials.
-
 Bar graph with percentage for financial analysis powerpoint slides
Presenting bar graph with percentage for financial analysis powerpoint slides. This Power Point template slide has been crafted with graphic of bar graph and percentage icons. This PPT slide contains the concept of financial analysis. Use this PPT slide for business and finance related presentations.
-
 Dollar value linear chart for financial growth powerpoint slides
Presenting dollar value linear chart for financial growth powerpoint slides. This Power Point template slide has been crafted with graphic of dollar value linear chart icons. This PPT slide contains the concept of financial growth analysis. Use this PPT slide for business and finance related presentations.
-
 Five staged market trends percentage and icons powerpoint slides
Presenting five staged market trends percentage and icons powerpoint slides. This Power Point template slide has been crafted with graphic of five staged percentage and icons. This PPT slide contains the concept of financial growth analysis. Use this PPT slide for business and finance related presentations.
-
 Four staged business agenda icons diagram powerpoint slides
Presenting four staged business agenda icons diagram powerpoint slides. This Power Point template slide has been crafted with graphic of four staged agenda icons. This PPT slide contains the concept of business agenda analysis. Use this PPT slide for business and finance related presentations.
-
 Four text boxes with dollar values for financial management powerpoint slides
Presenting four text boxes with dollar values for financial management powerpoint slides. This Power Point template slide has been crafted with graphic of four text boxes and dollar diagram. This PPT slide contains the concept of financial management. Use this PPT slide for business and finance related presentations.
-
 Percentage chart for financial analysis powerpoint slides
Presenting percentage chart for financial analysis powerpoint slides. This Power Point template slide has been crafted with graphic of percentage chart diagram. This PPT slide contains the concept of financial analysis. Use this PPT slide for business and finance related presentations.
-
 Six staged business result charts and icons powerpoint slides
Presenting six staged business result charts and icons powerpoint slides. This Power Point template slide has been crafted with graphic of six staged result chart and icons diagram. This PPT slide contains the concept of business result analysis. Use this PPT slide for business and finance related presentations.
-
 Social media financial budget distribution charts powerpoint slides
Presenting social media financial budget distribution charts powerpoint slides. This Power Point template slide has been crafted with graphic of distribution chart diagram. This PPT slide contains the concept of financial budget distribution for social media usage. Use this PPT slide for business and finance related presentations.
-
 Tablet computer laptop for business communication powerpoint slides
Presenting tablet computer laptop for business communication powerpoint slides. This Power Point template slide has been crafted with graphic of tablet, computer and laptop diagram. This PPT slide contains the concept of business communication. Use this PPT slide for business and finance related presentations.
-
 Year based financial budget distribution chart powerpoint slides
Completely modifiable slide for financial budget distribution chart. Editable images, colors and text. Presentable and easy to comprehend info graphic format. The presentation template can be downloaded and saved in any desired format. Privilege of insertion of logo and trademarks for more personalization. Adaptable to wide screen view without the problem of pixilation. Beneficial and productive insight for industry professionals, teachers, students, strategists and management planners. Can be used with google slides.
-
 3d gfx for year 2014 financial updates powerpoint slides
Presenting 3d gfx for year 2014 financial updates powerpoint slides. This is a 3d gfx for year 2014 financial updates powerpoint slides. This is a three stage process. The stages in this process are financials.
-
 Bar graph with business steps and icons powerpoint slides
Presenting bar graph with business steps and icons powerpoint slides. This is a bar graph with business steps and icons powerpoint slides. This is a three stage process. The stages in this process are financials.
-
 Bar graph with growth line for financial updates powerpoint slides
Presenting bar graph with growth line for financial updates powerpoint slides. This is a bar graph with growth line for financial updates powerpoint slides. This is a one stage process. The stages in this process are financials.
-
 Bar graph with next quarter deals analysis powerpoint slides
Presenting bar graph with next quarter deals analysis powerpoint slides. This is a bar graph with next quarter deals analysis powerpoint slides. This is a six stage process. The stages in this process are financials.
-
 Bar graph with percentage values and team powerpoint slides
Presenting bar graph with percentage values and team powerpoint slides. This is a bar graph with percentage values and team powerpoint slides. This is a six stage process. The stages in this process are financials.
-
 Business result analysis monthly data chart powerpoint slides
Presenting business result analysis monthly data chart powerpoint slides. This is a business result analysis monthly data chart powerpoint slides. This is a ten stage process. The stages in this process are financials.
-
 Checklist for business finances with four categories powerpoint slides
Presenting checklist for business finances with four categories powerpoint slides. This is a checklist for business finances with four categories powerpoint slides. This is a one stage process. The stages in this process are financials.
-
 Column chart percentage analysis powerpoint slides
Presenting column chart percentage analysis powerpoint slides. This is a column chart percentage analysis powerpoint slides. This is a five stage process. The stages in this process are financials.
-
 Company detail product infographics slide powerpoint slides
Presenting company detail product infographics slide powerpoint slides. This is a company detail product infographics slide powerpoint slides. This is a one stage process. The stages in this process are financials.
-
 Creative bar graph for percentage analysis powerpoint slides
Presenting creative bar graph for percentage analysis powerpoint slides. This is a creative bar graph for percentage analysis powerpoint slides. This is a seven stage process. The stages in this process are financials.
-
 Creative bubble chart for financial analysis powerpoint slides
Presenting creative bubble chart for financial analysis powerpoint slides. This is a creative bubble chart for financial analysis powerpoint slides. This is a three stage process. The stages in this process are financials.
-
 Financial values analysis scale diagram powerpoint slides
Presenting financial values analysis scale diagram powerpoint slides. This is a financial values analysis scale diagram powerpoint slides. This is a six stage process. The stages in this process are financials.
-
 Five staged financial data analysis table powerpoint slides
Presenting five staged financial data analysis table powerpoint slides. This is a five staged financial data analysis table powerpoint slides. This is a five stage process. The stages in this process are financials.
-
 Four circle arrows and percentage for finance powerpoint slides
Presenting four circle arrows and percentage for finance powerpoint slides. This is a four circle arrows and percentage for finance powerpoint slides. This is a four stage process. The stages in this process are financials.
-
 Four pie charts with financial data powerpoint slides
Presenting four pie charts with financial data powerpoint slides. This is a four pie charts with financial data powerpoint slides. This is a four stage process. The stages in this process are financials.
-
 Four pie charts with percentage and years powerpoint slides
Presenting four pie charts with percentage and years powerpoint slides. This is a four pie charts with percentage and years powerpoint slides. This is a four stage process. The stages in this process are financials.
-
 Four staged semicircle chart with percentage powerpoint slides
Presenting four staged semicircle chart with percentage powerpoint slides. This is a four staged semicircle chart with percentage powerpoint slides. This is a four stage process. The stages in this process are financials.
-
 Four tags for financial matter analysis powerpoint slides
Presenting four tags for financial matter analysis powerpoint slides. This is a four tags for financial matter analysis powerpoint slides. This is a four stage process. The stages in this process are financials.
-
 Four tags with money info financial data powerpoint slides
Presenting four tags with money info financial data powerpoint slides. This is a four tags with money info financial data powerpoint slides. This is a four stage process. The stages in this process are financials.
-
 Line chart for financial data based on social media usage powerpoint slides
Presenting line chart for financial data based on social media usage powerpoint slides. This is a line chart for financial data based on social media usage powerpoint slides. This is a three stage process. The stages in this process are financials.
-
 Line chart with entertainment icons month based analysis powerpoint slides
Presenting line chart with entertainment icons month based analysis powerpoint slides. This is a line chart with entertainment icons month based analysis powerpoint slides. This is a three stage process. The stages in this process are financials.
-
 Percentage charts for financial revenue analysis powerpoint slides
Presenting percentage charts for financial revenue analysis powerpoint slides. This is a percentage charts for financial revenue analysis powerpoint slides. This is a three stage process. The stages in this process are financials.
-
 Pie chart with seven staged value segment powerpoint slides
Presenting pie chart with seven staged value segment powerpoint slides. This is a pie chart with seven staged value segment powerpoint slides. This is a one stage process. The stages in this process are financials.
-
 Three price tags dollar value analysis powerpoint slides
Presenting three price tags dollar value analysis powerpoint slides. This is a three price tags dollar value analysis powerpoint slides. This is a three stage process. The stages in this process are financials.
-
 Three tags with dollar values talktime days facility powerpoint slides
Presenting three tags with dollar values talktime days facility powerpoint slides. This is a three tags with dollar values talktime days facility powerpoint slides. This is a three stage process. The stages in this process are financials.
-
 Train diagram with business icons and percentage powerpoint slides
Presenting train diagram with business icons and percentage powerpoint slides. This is a train diagram with business icons and percentage powerpoint slides. This is a three stage process. The stages in this process are financials.
-
 World map with line chart for business trends powerpoint slides
Presenting world map with line chart for business trends powerpoint slides. This is a world map with line chart for business trends powerpoint slides. This is a one stage process. The stages in this process are financials.
-
Commendable slides with attractive designs. Extremely pleased with the fact that they are easy to modify. Great work!
-
Presentation Design is very nice, good work with the content as well.
-
Great experience, I would definitely use your services further.
-
Easy to edit slides with easy to understand instructions.
-
Use of different colors is good. It's simple and attractive.
-
Excellent work done on template design and graphics.
-
Excellent design and quick turnaround.
-
Unique research projects to present in meeting.
-
It saves your time and decrease your efforts in half.
-
Easily Editable.


