Pricing Strategies PowerPoint Templates, Presentation Slides & PPT Templates
- Sub Categories
-
- 30 60 90 Day Plan
- About Us Company Details
- Action Plan
- Agenda
- Annual Report
- Audit Reports
- Balance Scorecard
- Brand Equity
- Business Case Study
- Business Communication Skills
- Business Plan Development
- Business Problem Solving
- Business Review
- Capital Budgeting
- Career Planning
- Change Management
- Color Palettes
- Communication Process
- Company Location
- Company Vision
- Compare
- Competitive Analysis
- Corporate Governance
- Cost Reduction Strategies
- Custom Business Slides
- Customer Service
- Dashboard
- Data Management
- Decision Making
- Digital Marketing Strategy
- Digital Transformation
- Disaster Management
- Diversity
- Equity Investment
- Financial Analysis
- Financial Services
- Financials
- Growth Hacking Strategy
- Human Resource Management
- Innovation Management
- Interview Process
- Knowledge Management
- Leadership
- Lean Manufacturing
- Legal Law Order
- Management
- Market Segmentation
- Marketing
- Media and Communication
- Meeting Planner
- Mergers and Acquisitions
- Metaverse
- Newspapers
- Operations and Logistics
- Organizational Structure
- Our Goals
- Performance Management
- Pitch Decks
- Pricing Strategies
- Process Management
- Product Development
- Product Launch Ideas
- Product Portfolio
- Project Management
- Purchasing Process
- Quality Assurance
- Quotes and Testimonials
- Real Estate
- Risk Management
- Sales Performance Plan
- Sales Review
- SEO
- Service Offering
- Six Sigma
- Social Media and Network
- Software Development
- Solution Architecture
- Stock Portfolio
- Strategic Management
- Strategic Planning
- Supply Chain Management
- Swimlanes
- System Architecture
- Team Introduction
- Testing and Validation
- Thanks-FAQ
- Time Management
- Timelines Roadmaps
- Value Chain Analysis
- Value Stream Mapping
- Workplace Ethic
-
 Four colored tags and percentage analysis powerpoint slides
Presenting four colored tags and percentage analysis powerpoint slides. This Power Point template slide has been crafted with graphic of four colored tags and percentage icons. This PPT slide contains the concept of financial data analysis representation. Use this PPT slide for business and finance related presentations.
-
 Four staged financial chart and icons powerpoint slides
Presenting four staged financial chart and icons powerpoint slides. This Power Point template slide has been crafted with graphic of four staged financial chart and icons. This PPT slide contains the concept of financial data analysis. Use this PPT slide for business and finance related presentations.
-
 Four tags for business planning analysis powerpoint slides
Presenting four tags for business planning analysis powerpoint slides. This Power Point template slide has been crafted with graphic of four tags. This PPT slide contains the concept of business planning analysis. Use this PPT slide for business and finance related presentations.
-
 Four tags for financial data analysis powerpoint slides
Presenting four tags for financial data analysis powerpoint slides. This Power Point template slide has been crafted with graphic of four tags. This PPT slide contains the concept of financial data analysis. Use this PPT slide for business and finance related presentations.
-
 Percentage chart with data analysis powerpoint slides
Presenting percentage chart with data analysis powerpoint slides. This Power Point template slide has been crafted with graphic of percentage chart. This PPT slide contains the concept of data analysis. Use this PPT slide for business and finance related presentations.
-
 Percentage chart with social media icons for work profile powerpoint slides
Presenting percentage chart with social media icons for work profile powerpoint slides. This Power Point template slide has been crafted with graphic of percentage chart and social media icons. This PPT slide contains the concept of data analysis and work profile creation. Use this PPT slide for business and finance related presentations.
-
 Saving piggy mobile dollars financial planning powerpoint slides
Presenting saving piggy mobile dollars financial planning powerpoint slides. This Power Point template slide has been crafted with graphic of piggy bank, dollars and mobile icons. This PPT slide contains the concept of financial planning. Use this PPT slide for business and finance related presentations.
-
 Sequential timeline made with pie chart and percentage powerpoint slides
Presenting sequential timeline made with pie chart and percentage powerpoint slides. This Power Point template slide has been crafted with graphic of sequential timeline and pie chart This PPT slide contains the concept of financial data analysis and planning. Use this PPT slide for business and finance related presentations.
-
 Three sequential money pots for financial growth analysis powerpoint slides
Presenting three sequential money pots for financial growth analysis powerpoint slides. This Power Point template slide has been crafted with graphic of three sequential money pots. This PPT slide contains the concept of financial growth analysis. Use this PPT slide for business and finance related presentations.
-
 Triangle with percentage organization chart powerpoint slides
Presenting triangle with percentage organization chart powerpoint slides. This Power Point template slide has been crafted with graphic of triangle and percentage..This PPT slide contains the concept of financial data analysis. Use this PPT slide for business and finance related presentations.
-
 Bar graph for financial analysis powerpoint slides
Presenting bar graph for financial analysis powerpoint slides. This Power Point template slide has been crafted with graphic of bar graph. This PPT slide contains the concept of financial data analysis. Use this PPT slide for business and finance related presentations.
-
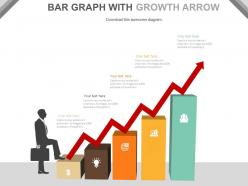 Bar graph with red growth arrow and icons for success powerpoint slides
Presenting bar graph with red growth arrow and icons for success powerpoint slides. This Power Point template slide has been crafted with graphic of bar graph and red growth arrow. This PPT slide contains the concept of financial growth analysis and success. Use this PPT slide for business and finance related presentations.
-
 Board for financial analysis with bar graph powerpoint slides
Presenting board for financial analysis with bar graph powerpoint slides. This Power Point template slide has been crafted with graphic of bar graph and board. This PPT slide contains the concept of financial analysis. Use this PPT slide for business and finance related presentations.
-
 Chart for financial infographics analysis powerpoint slides
Presenting chart for financial infographics analysis powerpoint slides. This Power Point template slide has been crafted with graphic of chart and icons. This PPT slide contains the concept of financial analysis. Use this PPT slide for business and finance related presentations.
-
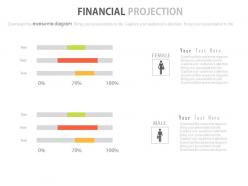 Financial projection line charts powerpoint slides
Presenting financial projection line charts powerpoint slides. This Power Point template slide has been crafted with graphic of projection line chart and icons. This PPT slide contains the concept of financial projection for future and analysis. Use this PPT slide for business and finance related presentations.
-
 Five staged financial percentage chart powerpoint slides
Presenting five staged financial percentage chart powerpoint slides. This Power Point template slide has been crafted with graphic of five staged percentage chart. This PPT slide contains the concept of financial analysis. Use this PPT slide for business and finance related presentations.
-
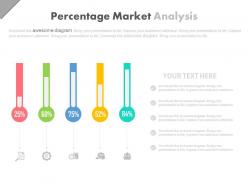 Five staged percentage market analysis powerpoint slides
Presenting five staged percentage market analysis powerpoint slides. This Power Point template slide has been crafted with graphic of five staged percentage chart. This PPT slide contains the concept of financial growth and market analysis. Use this PPT slide for business and finance related presentations.
-
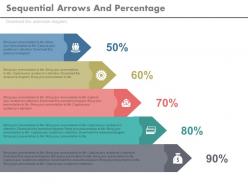 Five staged sequential arrows and percentage powerpoint slides
Presenting five staged sequential arrows and percentage powerpoint slides. This Power Point template slide has been crafted with graphic of five staged arrow and percentage chart. This PPT slide contains the concept of financial growth analysis. Use this PPT slide for business and finance related presentations.
-
 Five staged stair and icons diagram powerpoint slides
Presenting five staged stair and icons diagram powerpoint slides. This Power Point template slide has been crafted with graphic of five staged stair and icons chart. This PPT slide contains the concept of financial growth and success analysis. Use this PPT slide for business and finance related presentations.
-
 Four arrows labels with percentage charts powerpoint slides
Presenting four arrows labels with percentage charts powerpoint slides. This Power Point template slide has been crafted with graphic of four arrows labels and percentage chart. This PPT slide contains the concept of financial data analysis. Use this PPT slide for business and finance related presentations.
-
 Four buttons for our services powerpoint slides
Presenting four buttons for our services powerpoint slides. This Power Point template slide has been crafted with graphic of four buttons. This PPT slide contains the concept of our services representation. Use this PPT slide for business and finance related presentations.
-
 Four different price tags for finance powerpoint slides
Presentation slide graphic of four different price tags for finance. Can be used by marketers, sales people, business analysts, etc. Compatible with number of software options. Colors and text can be easily changed as the PPT slide is completely editable. Personalize the presentation with individual company name and logo. Available in both Standard and Widescreen slide size. Easy and quick downloading process. Flexible option for conversion in PDF or JPG formats. Can use with Google slides.
-
 Four tags for business activity levels powerpoint slides
Presenting four tags for business activity levels powerpoint slides. This Power Point template slide has been crafted with graphic of four tags. This PPT slide contains the concept of business activity levels representation. Use this PPT slide for business and finance related presentations.
-
 Four text boxes for about us powerpoint slides
Presenting four text boxes for about us powerpoint slides. This Power Point template slide has been crafted with graphic of four text boxes. This PPT slide contains the concept of about us representation. Use this PPT slide for business and finance related presentations.
-
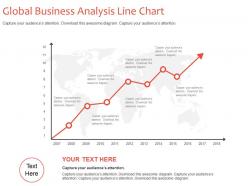 Global business analysis line chart powerpoint slides
Presenting global business analysis line chart powerpoint slides. This Power Point template slide has been crafted with graphic of line chart. This PPT slide contains the concept of global business analysis representation. Use this PPT slide for business and finance related presentations.
-
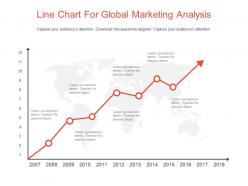 Line chart for global marketing analysis powerpoint slides
Presenting line chart for global marketing analysis powerpoint slides. This Power Point template slide has been crafted with graphic of line chart. This PPT slide contains the concept of global marketing analysis representation. Use this PPT slide for business and marketing related presentations.
-
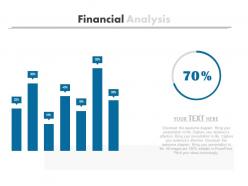 Percentage cycle with bar graph for financial analysis powerpoint slides
Presenting percentage cycle with bar graph for financial analysis powerpoint slides. This Power Point template slide has been crafted with graphic of percentage cycle and bar graph. This PPT slide contains the concept of financial analysis. Use this PPT slide for business and finance related presentations.
-
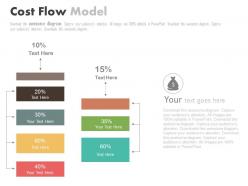 Seven staged cost flow model powerpoint slides
Presenting seven staged cost flow model powerpoint slides. This Power Point template slide has been crafted with graphic of seven staged cost flow model. This PPT slide contains the concept of financial analysis. Use this PPT slide for business and finance related presentations.
-
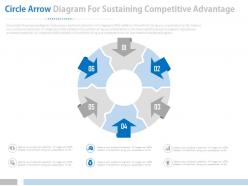 Six staged circle arrow diagram for sustaining competitive advantage powerpoint slides
Presenting six staged circle arrow diagram for sustaining competitive advantage powerpoint slides. This Power Point template slide has been crafted with graphic of six staged circle arrow diagram. This PPT slide contains the concept of sustaining competitive advantage. Use this PPT slide for business and finance related presentations.
-
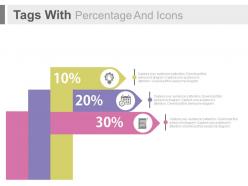 Three tags with percentage and icons powerpoint slides
Presenting three tags with percentage and icons powerpoint slides. This Power Point template slide has been crafted with graphic of three tags and percentage diagram. This PPT slide contains the concept of financial data analysis. Use this PPT slide for business and finance related presentations.
-
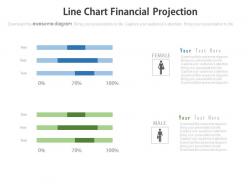 Two line charts financial projection powerpoint slides
Presenting two line charts financial projection powerpoint slides. This Power Point template slide has been crafted with graphic of two line chart. This PPT slide contains the concept of financial projection. Use this PPT slide for business and finance related presentations.
-
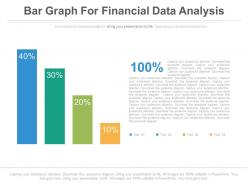 Bar graph for financial data analysis powerpoint slides
Presenting bar graph for financial data analysis powerpoint slides. This Power Point template diagram with graphic of bar graph and finance icons. This PPT diagram contains the concept of financial data analysis. Use this PPT diagram for business and finance related presentations.
-
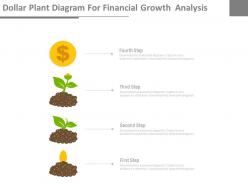 Dollar plant diagram for financial growth analysis powerpoint slides
Presenting dollar plant diagram for financial growth analysis powerpoint slides. This Power Point template diagram with graphic of dollar plant and finance icons. This PPT diagram contains the concept of financial growth analysis. Use this PPT diagram for business and finance related presentations.
-
 Financial analysis table with five segments powerpoint slides
Presenting financial analysis table with five segments powerpoint slides. This Power Point template diagram with graphic of finance table with five segments. This PPT diagram contains the concept of financial analysis. Use this PPT diagram for business and finance related presentations.
-
 Financial planning with icons for analysis powerpoint slides
Presenting financial planning with icons for analysis powerpoint slides. This Power Point template diagram with graphic of finance icons. This PPT diagram contains the concept of financial planning and analysis. Use this PPT diagram for business and finance related presentations.
-
 Five circles and icons for social media networking powerpoint slides
Presenting five circles and icons for social media networking powerpoint slides. This Power Point template diagram with graphic of five circles and icons. This PPT diagram contains the concept of social media networking. Use this PPT diagram for business and internet related presentations.
-
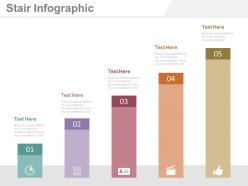 Five staged bar graph for financial management analysis powerpoint slides
Presenting five staged bar graph for financial management analysis powerpoint slides. This Power Point template diagram with graphic of five staged bar graph and icons. This PPT diagram contains the concept of financial management analysis. Use this PPT diagram for business and finance related presentations.
-
 Four circle chart with finance percentage diagram powerpoint slides
Presentation slide representing circle charts with finance percentages. Useful combination of charts and percentages. Compatible with number of software options. Colors, text and fonts can be easily changed as the PPT slide is completely editable. Personalize the presentation with individual company name and logo. Available in both Standard and Widescreen slide size. Easy and quick downloading process. Flexible option for conversion in PDF or JPG formats. Can use with Google slides.
-
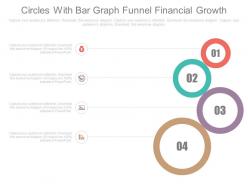 Four circles bar graph financial growth analysis powerpoint slides
Presenting four circles bar graph financial growth analysis powerpoint slides. This Power Point template diagram with graphic of four circles and bar graph. This PPT diagram contains the concept of financial growth analysis. Use this PPT diagram for business and finance related presentations.
-
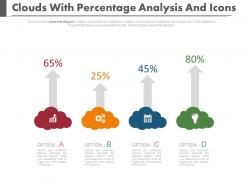 Four clouds with percentage analysis and icons powerpoint slides
Presenting four clouds with percentage analysis and icons powerpoint slides. This Power Point template diagram with graphic of four clouds and percentage. This PPT diagram contains the concept of financial analysis. Use this PPT diagram for business and finance related presentations.
-
 Four directional financial analysis chart powerpoint slides
Presenting four directional financial analysis chart powerpoint slides. This Power Point template diagram with graphic of four directional chart. This PPT diagram contains the concept of financial analysis. Use this PPT diagram for business and finance related presentations.
-
 Four dollar tags for financial analysis powerpoint slides
Presenting four dollar tags for financial analysis powerpoint slides. This Power Point template diagram with graphic of four dollar tags. This PPT diagram contains the concept of financial analysis. Use this PPT diagram for business and finance related presentations.
-
 Four pyramids with percentage analysis powerpoint slides
Presenting four pyramids with percentage analysis powerpoint slides. This Power Point template diagram with graphic of four pyramid and percentage. This PPT diagram contains the concept of percentage analysis. Use this PPT diagram for business and finance related presentations.
-
 Four staged financial tags for analysis powerpoint slides
Presenting four staged financial tags for analysis powerpoint slides. This Power Point template diagram with graphic of four staged tags. This PPT diagram contains the concept of financial analysis. Use this PPT diagram for business and finance related presentations.
-
 Four staged gender ratio analysis chart powerpoint slides
Presenting four staged gender ratio analysis chart powerpoint slides. This Power Point template diagram with graphic of four staged gender ratio chart. This PPT diagram contains the concept of gender ratio analysis. Use this PPT diagram for business and finance related presentations.
-
 Four staged pricing table with icons powerpoint slides
The visuals bear a high-class image display with no error of pixilation. The option of unlimited customization stays with you to experiment with the colour scheme, orientation features, and size adjustment. Save the said template in various file formats with an easy download option. The templates are fully congruent to Google slides. Explore the feasible options to recast the slides with a complete guide that follows the Ppt.
-
 Four tags and icons for financial update powerpoint slides
The visuals impose a stunning impact with its high-resolution picture quality. Download the template in various file formats available. Conduct an easy play of templates in Google slides and other software options. Utilize the unlimited customize options to fabricate the Ppt as per your suitability. Insert the desired text and other details of your company with a few clicks.
-
 Four tags and icons with percentage analysis powerpoint slides
Presenting four tags and icons with percentage analysis powerpoint slides. This Power Point template diagram with graphic of four staged tags and icons. This PPT diagram contains the concept of percentage analysis. Use this PPT diagram for business and finance related presentations.
-
 Four tags for pricing tables and analysis powerpoint slides
Compelling mix of PPT icons, text, content and background. Pre designed PowerPoint Infographic. Harmonious with large number of software options. Hassle free adaptation in any format. Easy to embrace personalized elements like company logo and name. Hassle free editing of font, color, shade, shape and orientation. Excellence in picture quality even on wide screen output. Used by marketers, businessman, strategists, educationists, financiers, students and stakeholders.
-
 Four tags for total sales analysis powerpoint slides
Presenting four tags for total sales analysis powerpoint slides. This Power Point template diagram with graphic of four tags and icons. This PPT diagram contains the concept of total sales analysis. Use this PPT diagram for business and finance related presentations.
-
 Four tags with dollar values for financial analysis powerpoint slides
Presenting four tags with dollar values for financial analysis powerpoint slides. This is a four tags with dollar values for financial analysis powerpoint slides. This is a four stage process. The stages in this process are financials.
-
 Six staged percentage analysis chart powerpoint slides
Presenting six staged percentage analysis chart powerpoint slides. This Power Point template diagram with graphic of six staged percentage chart. This PPT diagram contains the concept of financial analysis. Use this PPT diagram for business and finance related presentations.
-
 Three social networks google plus viber and linkdin powerpoint slides
Presenting three social networks google plus viber and linkdin powerpoint slides. This Power Point template diagram with graphic of three social networks. This PPT diagram contains the concept of social networking for google,viber and LinkedIn. Use this PPT diagram for business and finance related presentations.
-
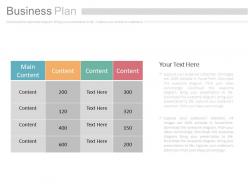 Three staged business planning diagram powerpoint slides
No risk of picture pixilation whatever be the size of display screen. Allow instant downloading and saving of the slide design. Follow the provided instructions to modify the layout and customize it. Fix the background with your business trademark or logo. Use additional icons available to download. Beneficial for the business managers, traders, presenters and the relevant individuals in a trading company.
-
 Three staged sales info year based chart powerpoint slides
Presenting three staged sales info year based chart powerpoint slides. This Power Point template diagram with graphic of three staged year info chart diagram. This PPT diagram contains the concept of year based sales planning. Use this PPT diagram for business and sales related presentations.
-
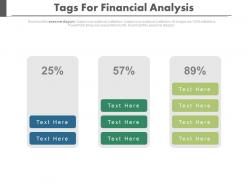 Three staged tags for financial analysis diagram powerpoint slides
Presenting three staged tags for financial analysis diagram powerpoint slides. This Power Point template diagram with graphic of three staged tags diagram. This PPT diagram contains the concept of financial analysis. Use this PPT diagram for business and finance related presentations.
-
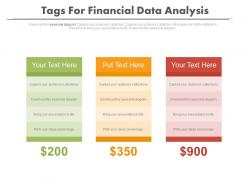 Three tags for financial data analysis powerpoint slides
Presenting three tags for financial data analysis powerpoint slides. This Power Point template diagram with graphic of three staged tags diagram. This PPT diagram contains the concept of financial data analysis. Use this PPT diagram for business and finance related presentations.
-
 Triangle with percentage financial analysis powerpoint slides
Presenting triangle with percentage financial analysis powerpoint slides. This Power Point template diagram with graphic of triangle and percentage diagram. This PPT diagram contains the concept of financial analysis. Use this PPT diagram for business and finance related presentations.
-
 Two data driven chart for comparison powerpoint slides
Presenting two data driven chart for comparison powerpoint slides. This Power Point template diagram with graphic of two data driven chart diagram. This PPT diagram contains the concept of data comparison analysis. Use this PPT diagram for business and finance related presentations.
-
 Two data driven comparison charts for analysis powerpoint slides
Presenting two data driven comparison charts for analysis powerpoint slides. This Power Point template diagram with graphic of two data driven chart diagram. This PPT diagram contains the concept of data comparison analysis. Use this PPT diagram for business and finance related presentations.
-
Appreciate the research and its presentable format.
-
The Designed Graphic are very professional and classic.
-
Editable templates with innovative design and color combination.
-
Best Representation of topics, really appreciable.
-
Great product with effective design. Helped a lot in our corporate presentations. Easy to edit and stunning visuals.
-
Very unique and reliable designs.
-
Colors used are bright and distinctive.
-
Awesome presentation, really professional and easy to edit.
-
Commendable slides with attractive designs. Extremely pleased with the fact that they are easy to modify. Great work!
-
Easy to edit slides with easy to understand instructions.


