Heatmap visualization
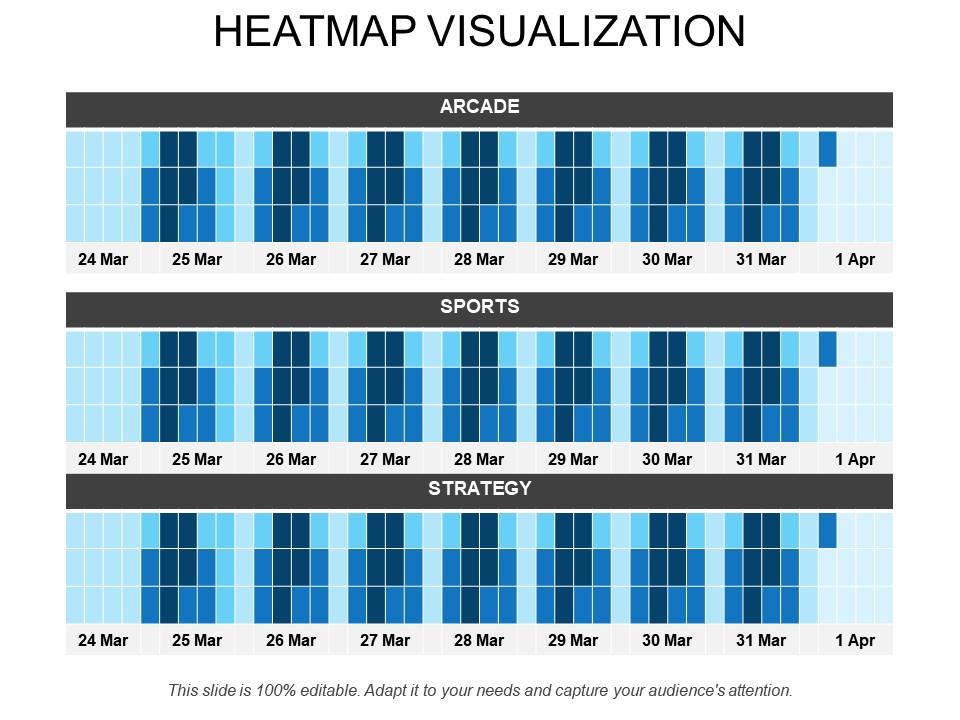
Visualize the volume of activities organized within a dataset by using the Heatmap Visualization PowerPoint graphic. You can plot different numerical data values by the specific color intensities with the aid of this correlation heatmap PPT slideshow. With the help of the heatmap chart presentation template, you can determine how to utilize the color-code systems to evaluate the particular data. You can showcase numerous factors in this data graphical representation PowerPoint layout that enables you to assess a large amount of information easily. Illustrate the user behavior on specific webpages with the assistance of business mapping PPT visual. You can create an overall report on the economic statistics of your company and thus explain the working of a heatmap using the web analytics PowerPoint slide. Included here are various high-grade icons with which you can make your presentation simple and easy to understand. You can maximize the value or density of records of your website by downloading our ready-to-use statistical graphics PPT theme.
You must be logged in to download this presentation.
 Impress your
 audience
Editable
of Time
PowerPoint presentation slides
Presenting the Heatmap Visualization PPT visual which is designed professionally for your convenience. Can be changed into various formats like PDF. PNG, and JPG. The slide is readily available in both 4:3 and 16:9 aspect ratio. You can customize the font, color, font size, and font types of the slides as per your needs. This template is compatible with Google Slides which makes it easily accessible at once.
People who downloaded this PowerPoint presentation also viewed the following :
Heatmap visualization with all 5 slides:
Display cerebral capability with our Heatmap Visualization. Convince folks you have a good brain.
-
Editable templates with innovative design and color combination.
-
Easily Understandable slides.


