Performance Management PowerPoint Templates, PPT Presentation & Slide Graphics
- Sub Categories
-
- 30 60 90 Day Plan
- About Us Company Details
- Action Plan
- Agenda
- Annual Report
- Audit Reports
- Balance Scorecard
- Brand Equity
- Business Case Study
- Business Communication Skills
- Business Plan Development
- Business Problem Solving
- Business Review
- Capital Budgeting
- Career Planning
- Change Management
- Color Palettes
- Communication Process
- Company Location
- Company Vision
- Compare
- Competitive Analysis
- Corporate Governance
- Cost Reduction Strategies
- Custom Business Slides
- Customer Service
- Dashboard
- Data Management
- Decision Making
- Digital Marketing Strategy
- Digital Transformation
- Disaster Management
- Diversity
- Equity Investment
- Financial Analysis
- Financial Services
- Financials
- Growth Hacking Strategy
- Human Resource Management
- Innovation Management
- Interview Process
- Knowledge Management
- Leadership
- Lean Manufacturing
- Legal Law Order
- Management
- Market Segmentation
- Marketing
- Media and Communication
- Meeting Planner
- Mergers and Acquisitions
- Metaverse
- Newspapers
- Operations and Logistics
- Organizational Structure
- Our Goals
- Performance Management
- Pitch Decks
- Pricing Strategies
- Process Management
- Product Development
- Product Launch Ideas
- Product Portfolio
- Project Management
- Purchasing Process
- Quality Assurance
- Quotes and Testimonials
- Real Estate
- Risk Management
- Sales Performance Plan
- Sales Review
- SEO
- Service Offering
- Six Sigma
- Social Media and Network
- Software Development
- Solution Architecture
- Stock Portfolio
- Strategic Management
- Strategic Planning
- Supply Chain Management
- Swimlanes
- System Architecture
- Team Introduction
- Testing and Validation
- Thanks-FAQ
- Time Management
- Timelines Roadmaps
- Value Chain Analysis
- Value Stream Mapping
- Workplace Ethic
-
 Impact matrix high low priority
Presenting this set of slides with name - Impact Matrix High Low Priority. This is a four stage process. The stages in this process are Impact Matrix, Impact Heatmap.
-
 Impact matrix high low probability
Presenting this set of slides with name - Impact Matrix High Low Probability. This is a four stage process. The stages in this process are Impact Matrix, Impact Heatmap.
-
 Impact matrix high medium low risk
Presenting this set of slides with name - Impact Matrix High Medium Low Risk. This is a four stage process. The stages in this process are Impact Matrix, Impact Heatmap.
-
 Impact matrix importance influence stakeholder
Presenting this set of slides with name - Impact Matrix Importance Influence Stakeholder. This is a four stage process. The stages in this process are Impact Matrix, Impact Heatmap.
-
 Impact matrix investment money time wastage
Presenting this set of slides with name - Impact Matrix Investment Money Time Wastage. This is a four stage process. The stages in this process are Impact Matrix, Impact Heatmap.
-
 Impact matrix output resources product quality
Presenting this set of slides with name - Impact Matrix Output Resources Product Quality. This is a six stage process. The stages in this process are Impact Matrix, Impact Heatmap.
-
 Impact matrix performance level formal dynamic process
Presenting this set of slides with name - Impact Matrix Performance Level Formal Dynamic Process. This is a three stage process. The stages in this process are Impact Matrix, Impact Heatmap.
-
 Impact matrix plan immediate leave consider
Presenting this set of slides with name - Impact Matrix Plan Immediate Leave Consider. This is a four stage process. The stages in this process are Impact Matrix, Impact Heatmap.
-
 Impact matrix sales strategy pricing impact
Presenting this set of slides with name - Impact Matrix Sales Strategy Pricing Impact. This is a four stage process. The stages in this process are Impact Matrix, Impact Heatmap.
-
 Break even analysis chart showing fixed and total costs
Presenting this set of slides with name - Break Even Analysis Chart Showing Fixed And Total Costs. This is a four stage process. The stages in this process are Break Even Analysis, Break Even Point, Break Even Level.
-
 Break even analysis chart showing total cost and revenue
Presenting this set of slides with name - Break Even Analysis Chart Showing Total Cost And Revenue. This is a three stage process. The stages in this process are Break Even Analysis, Break Even Point, Break Even Level.
-
 Break even analysis showing fixed costs with margin on variable costs
Presenting this set of slides with name - Break Even Analysis Showing Fixed Costs With Margin On Variable Costs. This is a two stage process. The stages in this process are Break Even Analysis, Break Even Point, Break Even Level.
-
 Break even analysis showing sales volume analysis
Presenting this set of slides with name - Break Even Analysis Showing Sales Volume Analysis. This is a eleven stage process. The stages in this process are Break Even Analysis, Break Even Point, Break Even Level.
-
 Break even analysis table showing products total costs and revenue
Presenting this set of slides with name - Break Even Analysis Table Showing Products Total Costs And Revenue. This is a two stage process. The stages in this process are Break Even Analysis, Break Even Point, Break Even Level.
-
 Break even analysis table showing production costs and sales
Presenting this set of slides with name - Break Even Analysis Table Showing Production Costs And Sales. This is a six stage process. The stages in this process are Break Even Analysis, Break Even Point, Break Even Level.
-
 Break even analysis table with fixed and variable costs
Presenting this set of slides with name - Break Even Analysis Table With Fixed And Variable Costs. This is a three stage process. The stages in this process are Break Even Analysis, Break Even Point, Break Even Level.
-
 Break even analysis table with fixed and variable costs ppt
Presenting this set of slides with name - Break Even Analysis Table With Fixed And Variable Costs Ppt. This is a three stage process. The stages in this process are Break Even Analysis, Break Even Point, Break Even Level.
-
 Break even analysis with description and amount
Presenting this set of slides with name - Break Even Analysis With Description And Amount. This is a three stage process. The stages in this process are Break Even Analysis, Break Even Point, Break Even Level.
-
 Components of cost of production and break even analysis
Presenting this set of slides with name - Components Of Cost Of Production And Break Even Analysis. This is a eight stage process. The stages in this process are Break Even Analysis, Break Even Point, Break Even Level.
-
 Business results icons powerpoint presentation
Presenting this set of slides with name - Business Results Icons Powerpoint Presentation. This is a three stage process. The stages in this process are Business Results, Business Outcomes, Business Output.
-
 Business results info graphics with bar chart and graph
Presenting this set of slides with name - Business Results Info Graphics With Bar Chart And Graph. This is a three stage process. The stages in this process are Business Results, Business Outcomes, Business Output.
-
 Business results key drivers powerpoint slides design ideas
Presenting this set of slides with name - Business Results Key Drivers Powerpoint Slides Design Ideas. This is a three stage process. The stages in this process are Business Results, Business Outcomes, Business Output.
-
 Business results related factors
Presenting this set of slides with name - Business Results Related Factors. This is a four stage process. The stages in this process are Business Results, Business Outcomes, Business Output.
-
 Business results with pie chart
Presenting this set of slides with name - Business Results With Pie Chart. This is a seven stage process. The stages in this process are Business Results, Business Outcomes, Business Output.
-
 Business results with yearly steps
Presenting this set of slides with name - Business Results With Yearly Steps. This is a five stage process. The stages in this process are Business Results, Business Outcomes, Business Output.
-
 Analytic data chart of business kpi image showing employee working on desktop
Presenting this set of slides with name - Analytic Data Chart Of Business Kpi Image Showing Employee Working On Desktop. This is a three stage process. The stages in this process are Business Kpi, Business Dashboard, Business Metrics.
-
 Business key performance indicator showing analytic data of business kpi in desktop
Presenting this set of slides with name - Business Key Performance Indicator Showing Analytic Data Of Business Kpi In Desktop. This is a four stage process. The stages in this process are Business Kpi, Business Dashboard, Business Metrics.
-
 Business kpi contain visualization aid of analytic data in form of bar chart
Presenting this set of slides with name - Business Kpi Contain Visualization Aid Of Analytic Data In Form Of Bar Chart. This is a four stage process. The stages in this process are Business Kpi, Business Dashboard, Business Metrics.
-
 Business kpi showing graphs key performance indicator in tablets and documents
Presenting this set of slides with name - Business Kpi Showing Graphs Key Performance Indicator In Tablets And Documents. This is a four stage process. The stages in this process are Business Kpi, Business Dashboard, Business Metrics.
-
 Business kpi showing key performance indicator of company through target point and line graph
Presenting this set of slides with name - Business Kpi Showing Key Performance Indicator Of Company Through Target Point And Line Graph. This is a three stage process. The stages in this process are Business Kpi, Business Dashboard, Business Metrics.
-
 Business kpi showing summary of key performance indicator data representation in line graph and pie chart
Presenting this set of slides with name - Business Kpi Showing Summary Of Key Performance Indicator Data Representation In Line Graph And Pie Chart. This is a three stage process. The stages in this process are Business Kpi, Business Dashboard, Business Metrics.
-
 Dashboard for business kpi showing data of key performance indicator in graph representation
Presenting this set of slides with name - Dashboard For Business Kpi Showing Data Of Key Performance Indicator In Graph Representation. This is a four stage process. The stages in this process are Business Kpi, Business Dashboard, Business Metrics.
-
 Employee looking at the graph of business kpi in tablet covering bar graphs and pie charts
Presenting this set of slides with name - Employee Looking At The Graph Of Business Kpi In Tablet Covering Bar Graphs And Pie Charts. This is a four stage process. The stages in this process are Business Kpi, Business Dashboard, Business Metrics.
-
 Graphical representation of business kpi with employee working on data doing calculations
Presenting this set of slides with name - Graphical Representation Of Business Kpi With Employee Working On Data Doing Calculations. This is a four stage process. The stages in this process are Business Kpi, Business Dashboard, Business Metrics.
-
 Summary of key performance showing graphical representation of business kpi in bar graphs and pie charts
Presenting this set of slides with name - Summary Of Key Performance Showing Graphical Representation Of Business Kpi In Bar Graphs And Pie Charts. This is a three stage process. The stages in this process are Business Kpi, Business Dashboard, Business Metrics.
-
 Visualization representation of business kpi data showing chart and graph of financial data
Presenting this set of slides with name - Visualization Representation Of Business Kpi Data Showing Chart And Graph Of Financial Data. This is a four stage process. The stages in this process are Business Kpi, Business Dashboard, Business Metrics.
-
 Kpi branding awareness image usage communication
Presenting this set of slides with name - Kpi Branding Awareness Image Usage Communication. This is a six stage process. The stages in this process are Kpi, Dashboard, Metrics.
-
 Kpi customers churn rate contact volume
Presenting this set of slides with name - Kpi Customers Churn Rate Contact Volume. This is a four stage process. The stages in this process are Kpi, Dashboard, Metrics.
-
 Kpi customers lifetime value acquisition retention
Presenting this set of slides with name - Kpi Customers Lifetime Value Acquisition Retention. This is a five stage process. The stages in this process are Kpi, Dashboard, Metrics.
-
 Kpi icons powerpoint slide background designs
Presenting this set of slides with name - Kpi Icons Powerpoint Slide Background Designs. This is a eight stage process. The stages in this process are Kpi, Dashboard, Metrics.
-
 Kpi marketing organic traffic sales revenue
Presenting this set of slides with name - Kpi Marketing Organic Traffic Sales Revenue. This is a ten stage process. The stages in this process are Kpi, Dashboard, Metrics.
-
 Kpi of financial capital market ratios
Presenting this set of slides with name - Kpi Of Financial Capital Market Ratios. This is a seven stage process. The stages in this process are Kpi, Dashboard, Metrics.
-
 Process kpi customer product support defect lob measure
Presenting this set of slides with name - Process Kpi Customer Product Support Defect Lob Measure. This is a three stage process. The stages in this process are Kpi, Dashboard, Metrics.
-
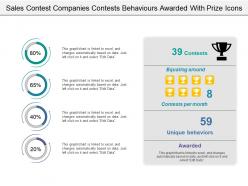 Sales contest companies contests behaviors awarded with prize icons
Presenting this set of slides with name - Sales Contest Companies Contests Behaviors Awarded With Prize Icons. This is a four stage process. The stages in this process are Sales Contest, Sales Competition, Sales Opposition.
-
 Sales contest metrics momentum involvement with graph and human image
Presenting this set of slides with name - Sales Contest Metrics Momentum Involvement With Graph And Human Image. This is a three stage process. The stages in this process are Sales Contest, Sales Competition, Sales Opposition.
-
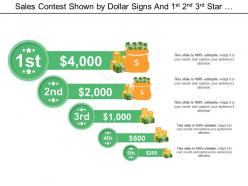 Sales contest shown by dollar signs and 1st 2nd 3rd star position
Presenting this set of slides with name - Sales Contest Shown By Dollar Signs And 1st 2nd 3rd Star Position. This is a five stage process. The stages in this process are Sales Contest, Sales Competition, Sales Opposition.
-
 Sales contest shown by humans crossing finishing point with dollar
Presenting this set of slides with name - Sales Contest Shown By Humans Crossing Finishing Point With Dollar. This is a four stage process. The stages in this process are Sales Contest, Sales Competition, Sales Opposition.
-
 Sales contest shown by humans running and percentage medal
Presenting this set of slides with name - Sales Contest Shown By Humans Running And Percentage Medal. This is a six stage process. The stages in this process are Sales Contest, Sales Competition, Sales Opposition.
-
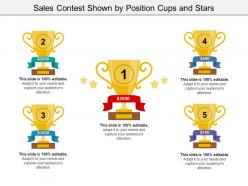 Sales contest shown by position cups and stars
Presenting this set of slides with name - Sales Contest Shown By Position Cups And Stars. This is a five stage process. The stages in this process are Sales Contest, Sales Competition, Sales Opposition.
-
 Sales contest shown by prize cup with stars
Presenting this set of slides with name - Sales Contest Shown By Prize Cup With Stars. This is a one stage process. The stages in this process are Sales Contest, Sales Competition, Sales Opposition.
-
 Sales contest shown by the winner and clips on rope
Presenting this set of slides with name - Sales Contest Shown By The Winner And Clips On Rope. This is a three stage process. The stages in this process are Sales Contest, Sales Competition, Sales Opposition.
-
 Sales contest shown by three humans dollar coins and cup holding
Presenting this set of slides with name - Sales Contest Shown By Three Humans Dollar Coins And Cup Holding. This is a three stage process. The stages in this process are Sales Contest, Sales Competition, Sales Opposition.
-
 Sales contest shown by us map background and top three positions
Presenting this set of slides with name - Sales Contest Shown By Us Map Background And Top Three Positions. This is a three stage process. The stages in this process are Sales Contest, Sales Competition, Sales Opposition.
-
 Progress report gear bulb boxes mobile
Presenting this set of slides with name - Progress Report Gear Bulb Boxes Mobile. This is a four stage process. The stages in this process are Progress Report, Growth Report, Improvement Report.
-
 Progress report in thermometer reading
Presenting this set of slides with name - Progress Report In Thermometer Reading. This is a three stage process. The stages in this process are Progress Report, Growth Report, Improvement Report.
-
 Progress report in traffic signal form
Presenting this set of slides with name - Progress Report In Traffic Signal Form. This is a three stage process. The stages in this process are Progress Report, Growth Report, Improvement Report.
-
 Progress report product comparison
Presenting this set of slides with name - Progress Report Product Comparison. This is a four stage process. The stages in this process are Progress Report, Growth Report, Improvement Report.
-
 Progress report sheet from jan to dec
Presenting this set of slides with name - Progress Report Sheet From Jan To Dec. This is a eight stage process. The stages in this process are Progress Report, Growth Report, Improvement Report.
-
 Progress report statistics in gear and lens
Presenting this set of slides with name - Progress Report Statistics In Gear And Lens. This is a three stage process. The stages in this process are Progress Report, Growth Report, Improvement Report.
-
 Progress report text image example of ppt
Presenting this set of slides with name - Progress Report Text Image Example Of Ppt. This is a five stage process. The stages in this process are Progress Report, Growth Report, Improvement Report.
-
Innovative and attractive designs.
-
Thanks for all your great templates they have saved me lots of time and accelerate my presentations. Great product, keep them up!
-
Commendable slides with attractive designs. Extremely pleased with the fact that they are easy to modify. Great work!
-
I discovered this website through a google search, the services matched my needs perfectly and the pricing was very reasonable. I was thrilled with the product and the customer service. I will definitely use their slides again for my presentations and recommend them to other colleagues.
-
Understandable and informative presentation.
-
Top Quality presentations that are easily editable.
-
Great designs, Easily Editable.
-
Qualitative and comprehensive slides.
-
Colors used are bright and distinctive.
-
Editable templates with innovative design and color combination.


