Budget Vs Actual Variance Analysis Powerpoint Presentation Slides
Plan, analyze and manage business budgets with our content ready Budget Vs Actual Variance Analysis PowerPoint Presentation Slides. The variance analysis in cost accounting PowerPoint complete deck comprises of self-explanatory templates such as actual cost vs budget, month-wise forecasting, overhead cost analysis, quarterly budget analysis, variance analysis, actual vs target variance, budget vs plan vs forecast, forecast, and projection, etc. Interpret the reason for variance of actual outcomes against forecasted behavior in finance using the professionally designed budget projection PowerPoint presentation. Make use of this interactive finance budgeting PPT presentation to visualize your budget data and statistics. Utilize the visually appealing financial forecasting PowerPoint templates to establish periodic reviews of actual expenses as compared to the budget. Furthermore, budget variance analysis PowerPoint presentation can help you to identify potential cost overruns and revenue shortfalls. Download the high-quality actual vs budget variance PPT visuals to determine the difference between projected revenues and expenditures. Our Budget Vs Actual Variance Analysis Powerpoint Presentation Slides don't allow the going to get heavy. They bring in an element of fun.
You must be logged in to download this presentation.
 Impress your
 audience
Editable
of Time
PowerPoint presentation slides
Enhance your audience's knowledge with this well researched Budget Vs Actual Variance Analysis Powerpoint Presentation Slides. This deck comprises of a total of twenty slides with each slide explained in detail. Yes, these PPT slides are completely customizable. Edit the color, text, and font size. Add or delete the content from the slide. Download PowerPoint templates in both widescreen and standard screen. The presentation is fully supported by Google Slides. It can be easily converted into JPG or PDF format.
People who downloaded this PowerPoint presentation also viewed the following :
Content of this Powerpoint Presentation
Slide 1: This slide introduces Budget vs Actual Variance Analysis. State Your Company Name and begin.
Slide 2: This slide shows Actual Cost vs Budget in tabular form.
Slide 3: This slide presents Month Wise Budget Forecasting.
Slide 4: This slide displays Overhead Cost Budget Analysis.
Slide 5: This slide represents Quarterly Budget Analysis in tabular form.
Slide 6: This slide showcases Master Budget vs Actual: Variance Analysis with variable and fixed costs.
Slide 7: This slide shows Actual vs Budget Analysis with categories as original budget, variable cost per unit and flexible budget.
Slide 8: This slide presents Actual vs Target Variance.
Slide 9: This slide displays Budget vs Plan vs Forecast. You can add data as per requirements.
Slide 10: This slide represents Forecast vs Actual Budget.
Slide 11: This slide showcases Forecast and Projection on monthly basis.
Slide 12: This slide shows Budget vs Forecast vs Actual.
Slide 13: This slide displays icons for Budget vs Actual Variance Analysis.
Slide 14: This slide is titled as Additional Slides for moving forward.
Slide 15: This slide shows Scatter Chart with two products comparison.
Slide 16: This slide displays Clustered Bar Chart. You can change data as per requirements.
Slide 17: This is Our Goal slide. Show your firm's goals here.
Slide 18: This slide is titled as Post It Notes. Post your important notes here.
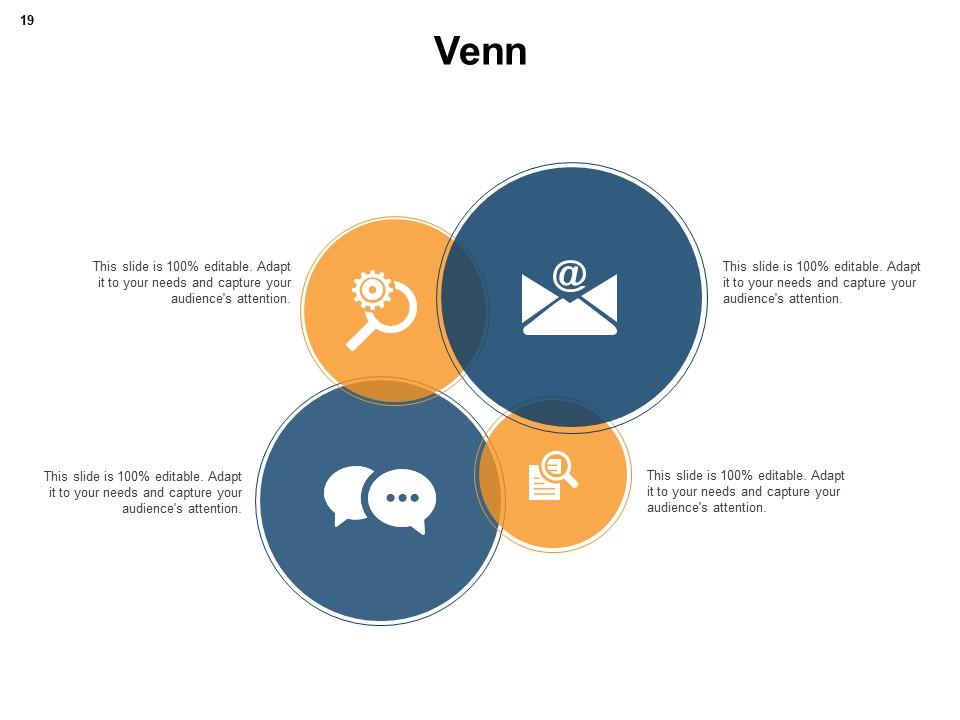
Slide 19: This is a Venn slide with text boxes to show information.
Slide 20: This is a Thank You slide with address, contact numbers and email address.
Budget Vs Actual Variance Analysis Powerpoint Presentation Slides with all 20 slides:
Use our Budget Vs Actual Variance Analysis Powerpoint Presentation Slides to effectively help you save your valuable time. They are readymade to fit into any presentation structure.
-
Editable templates with innovative design and color combination.
-
Colors used are bright and distinctive.
-
Out of the box and creative design.
-
Topic best represented with attractive design.
-
Nice and innovative design.


