Financials PowerPoint Templates, Financial Statement PPT Templates
- Sub Categories
-
- 30 60 90 Day Plan
- About Us Company Details
- Action Plan
- Agenda
- Annual Report
- Audit Reports
- Balance Scorecard
- Brand Equity
- Business Case Study
- Business Communication Skills
- Business Plan Development
- Business Problem Solving
- Business Review
- Capital Budgeting
- Career Planning
- Change Management
- Color Palettes
- Communication Process
- Company Location
- Company Vision
- Compare
- Competitive Analysis
- Corporate Governance
- Cost Reduction Strategies
- Custom Business Slides
- Customer Service
- Dashboard
- Data Management
- Decision Making
- Digital Marketing Strategy
- Digital Transformation
- Disaster Management
- Diversity
- Equity Investment
- Financial Analysis
- Financial Services
- Financials
- Growth Hacking Strategy
- Human Resource Management
- Innovation Management
- Interview Process
- Knowledge Management
- Leadership
- Lean Manufacturing
- Legal Law Order
- Management
- Market Segmentation
- Marketing
- Media and Communication
- Meeting Planner
- Mergers and Acquisitions
- Metaverse
- Newspapers
- Operations and Logistics
- Organizational Structure
- Our Goals
- Performance Management
- Pitch Decks
- Pricing Strategies
- Process Management
- Product Development
- Product Launch Ideas
- Product Portfolio
- Project Management
- Purchasing Process
- Quality Assurance
- Quotes and Testimonials
- Real Estate
- Risk Management
- Sales Performance Plan
- Sales Review
- SEO
- Service Offering
- Six Sigma
- Social Media and Network
- Software Development
- Solution Architecture
- Stock Portfolio
- Strategic Management
- Strategic Planning
- Supply Chain Management
- Swimlanes
- System Architecture
- Team Introduction
- Testing and Validation
- Thanks-FAQ
- Time Management
- Timelines Roadmaps
- Value Chain Analysis
- Value Stream Mapping
- Workplace Ethic
-
 Improved customer service experience pie charts ppt images
Presenting improved customer service experience pie charts ppt images. This is a improved customer service experience pie charts ppt images. This is a four stage process. The stages in this process are increased efficiency, better business decision making, improved customer experience and engagement, achieved financial savings.
-
 Technology growth rate statistics powerpoint images
Presenting technology growth rate statistics powerpoint images. This is a technology growth rate statistics powerpoint images. This is a three stage process. The stages in this process are business, marketing, percentage, finance, success.
-
 Budget and financial snapshot powerpoint shapes
Presenting budget and financial snapshot powerpoint shapes. This is a budget and financial snapshot powerpoint shapes. This is a two stage process. The stages in this process are sales, operating income, net income.
-
 Financial statement analysis powerpoint presentation slides
This PowerPoint presentation contains 74 slides. PowerPoint templates are 100 percent editable. Presentation templates are accessible in both formats standard and widescreen. All slides provided in this product are compatible with Google Slides. This PPT is useful for the professional financial analyst to measure the value of a company and its stock or debt.
-
 Industry analysis framework pie chart powerpoint slide show
Presenting industry analysis framework pie chart powerpoint slide show. This is a industry analysis framework pie chart powerpoint slide show. This is a six stage process. The stages in this process are industry analysis framework pie chart,market analysis market share brand.
-
 Project cost feasibility study ppt example
Presenting project cost feasibility study ppt example. This is a project cost feasibility study ppt example. This is a two stage process. The stages in this process are project cost feasibility study,our cost.
-
 5 years line graph trend comparison powerpoint presentation
Presenting 5 years line graph trend comparison powerpoint presentation. This is a 5 years line graph trend comparison powerpoint presentation. This is a three stage process. The stages in this process are year, planning, business, marketing, success.
-
 Performance evaluation dashboard excel charts powerpoint topics
Presenting performance evaluation dashboard excel charts powerpoint topics. This is a performance evaluation dashboard excel charts powerpoint topics. This is a four stage process. The stages in this process are graph, finance, dashboard, pie, business.
-
 Target performance measurement of business goals ppt images
Presenting target performance measurement of business goals ppt images. This is a target performance measurement of business goals ppt images. This is a two stage process. The stages in this process are target, business, goals, finance, graph.
-
 Trend and performance review of kpis ppt infographics
Presenting trend and performance review of kpis ppt infographics. This is a trend and performance review of kpis ppt infographics. This is a nine stage process. The stages in this process are graph, finance, business, marketing, year.
-
 Cost analysis in managerial economics ppt icon
Presenting cost analysis in managerial economics ppt icon. This is a cost analysis in managerial economics ppt icon. This is a three stage process. The stages in this process are cost benefit analysis, media tactic, cost, benefit.
-
 Business model assessment powerpoint graphics
Presenting business model assessment powerpoint graphics. This is a business model assessment powerpoint graphics. This is a three stage process. The stages in this process are business model, assessment, financial, presentation.
-
 Improving business revenue bar graph ppt diagrams
Presenting improving business revenue bar graph ppt diagrams. This is a improving business revenue bar graph ppt diagrams. This is a six stage process. The stages in this process are business, finance, percentage, marketing, strategy, success, analysis.
-
 Financial comparison powerpoint templates download
Presenting financial comparison powerpoint templates download. This is a financial comparison powerpoint templates download. This is a four stage process. The stages in this process are analysis, management, business, marketing, strategy, success.
-
 Product sales data powerpoint slide designs download
Presenting product sales data powerpoint slide designs download. This is a product sales data powerpoint slide designs download. This is a four stage process. The stages in this process are business, strategy, finance, success, marketing.
-
 Global internet usage powerpoint images
Presenting global internet usage powerpoint images. This is a global internet usage powerpoint images. This is a three stage process. The stages in this process are numbers of internet users, numbers of mobile users, numbers of social media users, number of internet users are increasing.
-
 New product launch marketing plan ppt diagrams
Presenting new product launch marketing plan ppt diagrams. This is a new product launch marketing plan ppt diagrams. This is a eight stage process. The stages in this process are growth, business, marketing, success, development.
-
 Financial comparison chart powerpoint slide influencers
Presenting financial comparison chart powerpoint slide influencers. This is a financial comparison chart powerpoint slide influencers. This is a four stage process. The stages in this process are dollar, business, symbol, finance, management.
-
 Financial comparison data powerpoint templates
Presenting financial comparison data powerpoint templates. This is a financial comparison data powerpoint templates. This is a four stage process. The stages in this process are business, marketing, management, dollar, finance.
-
 Funding requirements for a project powerpoint slide influencers
Presenting funding requirements for a project powerpoint slide influencers. This is a funding requirements for a project powerpoint slide influencers. This is a four stage process. The stages in this process are mill, how much are we raising, how much have we raised, how will we spend the money, production mill, marketing mill.
-
 How much money needed ppt example file
Presenting how much money needed ppt example file. This is a how much money needed ppt example file. This is a three stage process. The stages in this process are how will we spend the money, how much have we raised, how much are we raising, production, marketing.
-
 Bar graph for rate of employee turnover example of ppt presentation
Presenting bar graph for rate of employee turnover example of ppt presentation. This is a bar graph for rate of employee turnover example of ppt presentation. This is a five stage process. The stages in this process are rate of turnover, voluntary, total.
-
 Competency rating of employees horizontal bar chart sample ppt presentation
Presenting competency rating of employees horizontal bar chart sample ppt presentation. This is a competency rating of employees horizontal bar chart sample ppt presentation. This is a eight stage process. The stages in this process are managerial efficiency, resource planning, develop and implements, financial accounting, financial analysis, financial planning, provides direction, directiveness.
-
 Employees hr metrics graph powerpoint images
Presenting employees hr metrics graph powerpoint images. This is a employees hr metrics graph powerpoint images. This is a five stage process. The stages in this process are below bachelor degree, bachelor degree, post graduate diploma, master degree, doctorate.
-
 Horizontal bar chart for comparison powerpoint slide ideas
Presenting horizontal bar chart for comparison PPT slide. This presentation graph chart is fully editable in PowerPoint. You can customize the font type, font size, colors of the chart and background color as per your requirement. The slide is fully compatible with Google slides and can be saved in JPG or PDF format without any hassle. High quality graphics and icons ensure that there is no deteriorating in quality on enlarging their size. Have the tendency to boost the overall impression of your presentation.
-
 Hr dashboard editable powerpoint slide images
Stunning HR dashboard editable PPT slideshow. Loaded with incomparable benefits. Readymade PPT graphic helps in saving time and effort. Can be personalized by adding company trademark, logo, brand and symbols. Can be utilized for displaying both simple and complex information. Include or exclude slide content as per your individual need. Colors and text can be easily changed as the PPT slide is completely editable. Useful for every business leader and professional, project management team, business analysts, etc.
-
 Hr dashboard snapshot metrics powerpoint slide influencers
Presenting hr dashboard snapshot metrics powerpoint slide influencers. This is a hr dashboard metrics powerpoint slide influencers. This is a four stage process. The stages in this process are open positions by divisions, key metrics, total employees, employee churn.
-
 Speedometer dashboard for performance measurement powerpoint slide backgrounds
Presenting speedometer dashboard for performance measurement powerpoint slide backgrounds. This is a speedometer dashboard for performance measurement powerpoint slide backgrounds. This is a three stage process. The stages in this process are measure, meter, dashboard, speedometer, needle.
-
 Staff acquisition source horizontal bar chart powerpoint slide backgrounds
Presenting staff acquisition source horizontal bar chart powerpoint slide backgrounds. This is a staff acquisition source horizontal bar chart powerpoint slide backgrounds. This is a seven stage process. The stages in this process are campus interview, career fair, recruitment vendor, employee referral, web groups, job portals, print media.
-
 Workforce diversity by age group clustered bar chart powerpoint slide deck template
Presenting workforce diversity by age group clustered bar chart powerpoint slide deck template. This is a workforce diversity by age group clustered bar chart powerpoint slide deck template. This is a three stage process. The stages in this process are total workforce, male, female.
-
 Workforce diversity by gender powerpoint slide design ideas
Presenting workforce diversity by gender powerpoint slide design ideas. This is a workforce diversity by gender powerpoint slide design ideas. This is a two stage process. The stages in this process are male employees, female employees, new hires, left employment.
-
 Workforce diversity by region clustered bar graph powerpoint slide design templates
Presenting workforce diversity by region clustered bar graph powerpoint slide design templates. This is a workforce diversity by region clustered bar graph powerpoint slide design templates. This is a four stage process. The stages in this process are employees headcount, new employees hire, employees left job.
-
 Market analysis dashboard powerpoint slide designs
Presenting market analysis dashboard powerpoint slide designs. This is a market analysis dashboard powerpoint slide designs. This is a two stage process. The stages in this process are stakeholders and market, business leverage, global contracts contract coverage, centralized resources, agility to execute, standard process to work globally, manage contract demand.
-
 Value proposition in marketing powerpoint slides design
Presenting value proposition in marketing powerpoint slides design. This is a value proposition in marketing powerpoint slides design. This is a three stage process. The stages in this process are business relationships, competitors analysis, media marketing, category, series.
-
 Circular cycle diagram for different audit types powerpoint templates
Presenting circular cycle diagram for different audit types powerpoint templates. This is a circular cycle diagram for different audit types powerpoint templates. This is a five stage process. The stages in this process are financial statements audit, operational audis, forensic audits, compliance audits, comprehensive audits.
-
 Financial data for analyzing company growth powerpoint show
Presenting financial data for analyzing company growth powerpoint show. This is a financial data for analyzing company growth powerpoint show. This is a three stage process. The stages in this process are business, marketing, success, price, presentation.
-
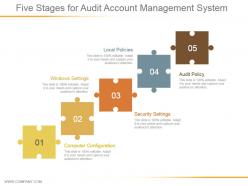 Five stages for audit account management system powerpoint slide deck
Presenting five stages for audit account management system powerpoint slide deck. This is a five stages for audit account management system powerpoint slide deck. This is a five stage process. The stages in this process are local policies, windows settings, security settings, audit policy, computer configuration.
-
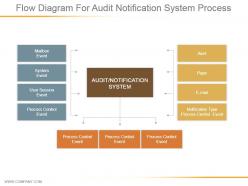 Flow diagram for audit notification system process
Presenting flow diagram for audit notification system process. This is a flow diagram for audit notification system process. This is a one stage process. The stages in this process are mailbox event, system event, user session event, process control event, page.
-
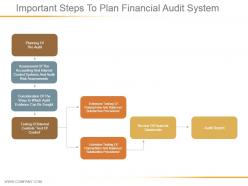 Important steps to plan financial audit system ppt diagrams
Presenting important steps to plan financial audit system ppt diagrams. This is a important steps to plan financial audit system ppt diagrams. This is a four stage process. The stages in this process are planning of the audit, extensive testing of transactions and balances substantive procedures, extensive testing of transactions and balances substantive procedures, testing of internal controls ?test of control?, consideration of the ways in which audit evidence can be sought, assessment of the accounting and internal control systems and audit risk assessments.
-
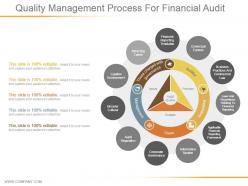 Quality management process for financial audit ppt model
Presenting quality management process for financial audit ppt model. This is a quality management process for financial audit ppt model. This is a eleven stage process. The stages in this process are financial reporting timetable, attracting talent, ligation environment, broader cultural, audit regulation.
-
 Root cause diagram for audit testing system ppt presentation
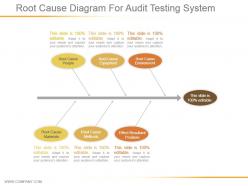
Presenting root cause diagram for audit testing system ppt presentation. This is a root cause diagram for audit testing system ppt presentation. This is a six stage process. The stages in this process are root cause people, root cause equipment, root cause environment, effect resultant problem.
-
 Three speedometers for defining future sales goal ppt slide examples
Presenting three speedometers for defining future sales goal ppt slide examples. This is a three speedometers for defining future sales goal ppt slide examples. This is a three stage process. The stages in this process are business, marketing, planning, presentation, technology.
-
 4 boxes for pricing plan financial analysis sample of ppt
Presenting 4 boxes for pricing plan financial analysis sample of ppt. This is a 4 boxes for pricing plan financial analysis sample of ppt. This is a four stage process. The stages in this process are finance, strategy, marketing, management, process.
-
 Weighing scale template for comparison presentation layouts
Presenting weighing scale template for comparison presentation layouts. This is a weighing scale template for comparison presentation layouts. This is a two stage process. The stages in this process are business, strategy, marketing, finance, compare.
-
 Bar graph with arrow for career planning ppt summary
Presenting bar graph with arrow for career planning ppt summary. This is a bar graph with arrow for career planning ppt summary. This is a six stage process. The stages in this process are business, finance, marketing, strategy, planning, success, arrow.
-
 Three text boxes for financial service ppt samples
Presenting three text boxes for financial service ppt samples. This is a three text boxes for financial service ppt samples. This is a five stage process. The stages in this process are business, marketing, strategy, financial, analysis, success.
-
 Financial metrics analysis snapshot powerpoint slide show
Presenting financial metrics analysis snapshot powerpoint slide show. This is a financial metrics analysis snapshot powerpoint slide show. This is a two stage process. The stages in this process are sales, operating income, net income.
-
 4 metric dashboard of performance indicators example of ppt
Presenting 4 metric dashboard of performance indicators example of ppt. This is a 4 metric dashboard of performance indicators example of ppt. This is a four stage process. The stages in this process are dashboard, finance, percentage, business, marketing.
-
 Magnifying glass for finance and accounting ppt slide
Presenting magnifying glass for finance and accounting ppt slide. This is a magnifying glass for finance and accounting ppt slide. This is a four stage process. The stages in this process are icons, magnify, search, strategy, finance.
-
 The different types of crowdsourcing powerpoint topics
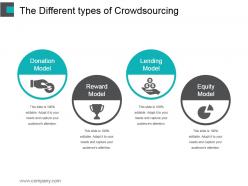
Presenting the different types of crowdsourcing powerpoint topics. This is a the different types of crowdsourcing powerpoint topics. This is a four stage process. The stages in this process are donation model, reward model, lending model, equity model.
-
 Understanding reward based crowdfunding ppt diagrams
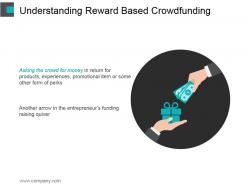
Presenting understanding reward based crowdfunding ppt diagrams. This is a understanding reward based crowdfunding ppt diagrams. This is a one stage process. The stages in this process are reward, money, finance, crowdfunding, opportunity.
-
 Value of crowdfunding powerpoint layout
Presenting value of crowdfunding powerpoint layout. This is a value of crowdfunding powerpoint layout. This is a one stage process. The stages in this process are reward, money, finance, crowdfunding, opportunity.
-
 Budget management sample of ppt
Presenting budget management sample of ppt. This is a budget management sample of ppt. This is a one stage process. The stages in this process are hand, currency, finance, dollar, symbol.
-
 Company financial status example ppt presentation
Presenting company financial status example ppt presentation. This is a company financial status example ppt presentation. This is a three stage process. The stages in this process are finance, symbol, dollar, business, economy.
-
 Crowdfunding benefits sample ppt presentation
Presenting crowdfunding benefits sample ppt presentation. This is a crowdfunding benefits sample ppt presentation. This is a three stage process. The stages in this process are idea bulb, business, marketing, investment, finance.
-
 Crowdfunding business ideas good ppt example
Presenting crowdfunding business ideas good ppt example. This is a crowdfunding business ideas good ppt example. This is a three stage process. The stages in this process are business, technology, idea bulb, hand, innovation.
-
 Crowdfunding models powerpoint images
Presenting crowdfunding models powerpoint images. This is a crowdfunding models powerpoint images. This is a four stage process. The stages in this process are donation model, reward model, lending model, equity model.
-
 Effect of crowdfunding powerpoint slide
Presenting effect of crowdfunding powerpoint slide. This is a effect of crowdfunding powerpoint slide. This is a three stage process. The stages in this process are a little money, a lot of people, the power of crowd funding, by pooling small contributions of money, from groups of people who share common interests, everyone has the power to achieve financial goals.
-
 How crowdfunding market works powerpoint slide background picture
Presenting how crowdfunding market works powerpoint slide background picture. This is a how crowdfunding market works powerpoint slide background picture. This is a three stage process. The stages in this process are global market, categories, risk and opportunity, donation, reward, equity, lending, mixed others, reward, donation reward mix, donations.
-
 Magnifying glass for performance management powerpoint slide deck samples
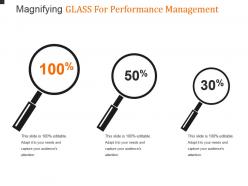
Presenting magnifying glass for performance management powerpoint slide deck samples. This is a magnifying glass for performance management powerpoint slide deck samples. This is a three stage process. The stages in this process are magnifier glass, business, marketing, research, finance.
-
Great quality product.
-
Great product with highly impressive and engaging designs.
-
Unique research projects to present in meeting.
-
Innovative and Colorful designs.
-
Very unique, user-friendly presentation interface.
-
Perfect template with attractive color combination.
-
Very well
-
Very well designed and informative templates.
-
Good research work and creative work done on every template.
-
Excellent design and quick turnaround.


