Financial Analysis & Management PowerPoint Templates, Presentation Examples & PPT Slides
- Sub Categories
-
- 30 60 90 Day Plan
- About Us Company Details
- Action Plan
- Agenda
- Annual Report
- Audit Reports
- Balance Scorecard
- Brand Equity
- Business Case Study
- Business Communication Skills
- Business Plan Development
- Business Problem Solving
- Business Review
- Capital Budgeting
- Career Planning
- Change Management
- Color Palettes
- Communication Process
- Company Location
- Company Vision
- Compare
- Competitive Analysis
- Corporate Governance
- Cost Reduction Strategies
- Custom Business Slides
- Customer Service
- Dashboard
- Data Management
- Decision Making
- Digital Marketing Strategy
- Digital Transformation
- Disaster Management
- Diversity
- Equity Investment
- Financial Analysis
- Financial Services
- Financials
- Growth Hacking Strategy
- Human Resource Management
- Innovation Management
- Interview Process
- Knowledge Management
- Leadership
- Lean Manufacturing
- Legal Law Order
- Management
- Market Segmentation
- Marketing
- Media and Communication
- Meeting Planner
- Mergers and Acquisitions
- Metaverse
- Newspapers
- Operations and Logistics
- Organizational Structure
- Our Goals
- Performance Management
- Pitch Decks
- Pricing Strategies
- Process Management
- Product Development
- Product Launch Ideas
- Product Portfolio
- Project Management
- Purchasing Process
- Quality Assurance
- Quotes and Testimonials
- Real Estate
- Risk Management
- Sales Performance Plan
- Sales Review
- SEO
- Service Offering
- Six Sigma
- Social Media and Network
- Software Development
- Solution Architecture
- Stock Portfolio
- Strategic Management
- Strategic Planning
- Supply Chain Management
- Swimlanes
- System Architecture
- Team Introduction
- Testing and Validation
- Thanks-FAQ
- Time Management
- Timelines Roadmaps
- Value Chain Analysis
- Value Stream Mapping
- Workplace Ethic
-
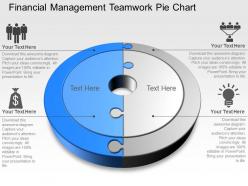 Financial management teamwork pie chart powerpoint template slide
Fully editable financial management teamwork pie chart PPT slideshow. Use of high-resolution images and the graphics. Ease to share the Presentation slide in standard and widescreen view. Valuable for the business presenters, management and the entrepreneurs. Compatible with Google slides as well. Replace the watermark with your company’s name or logo. Convertible into numerous format options like JPEG, JPG or PDF. User friendly structure of the slides. Access to edit the content, style, size and orientation of the PPT slides.
-
 Four staged bar graph for business application powerpoint template slide
We are proud to present our four staged bar graph for business application powerpoint template slide. This power point template diagram has been crafted with graphic of four staged bar graph. This PPT diagram contains the concept of business application. Use this PPT diagram for business and finance related presentations.
-
 Growth arrow for business deal and financial analysis powerpoint template slide
They are very competent and immense quality Presentation graphics. These PowerPoint diagrams, matrix charts, designs, style, pattern, size and PowerPoint images can be amendable according to need. It is an exclusive tool convenient and useful for business professionals, students, management scholars, researchers etc from diverse sectors. They have a very gentle and easy downloading option.
-
 Growth bar graph for business and financial analysis powerpoint template slide
Meticulous PowerPoint template very convenient for management scholars, professionals from various fields etc., Comfortably adjustable into different configurations like PDF or JPG, Easy to insert your brand name or company emblem in the PPT templates , Redraft able subject matter, PowerPoint images, types , font etc., Dressed well with all Google slides and other operating software’s.
-
 Pie chart for result analysis powerpoint template slide
Presentation slide runs jitter free on all software. Slides can be downloaded easily. More customization by inserting your company’s logo, trademark. No space constraints. PPT graphics never pixelate once projected on widescreen. Add/insert title and sub-title at your discretion. Slides compatible with Google slides. Convert to JPG/PDF formats rapidly. Useful for businesses, educational institutes, project management, financial organizations and NGO’s.
-
 Two staged puzzle diagram for business and finance powerpoint template slide
We are proud to present our two staged puzzle diagram for business and finance powerpoint template slide. Graphic of two staged puzzle diagram has been used to design this power point template diagram. This PPT diagram contains the concept of business and finance problem solving. Use this PPT diagram for business and finance presentations.
-
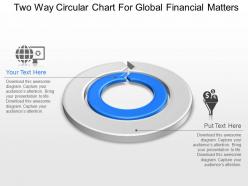 Two way circular chart for global financial matters powerpoint template slide
We are proud to present our two way circular chart for global financial matters powerpoint template slide. Graphic of two way circular chart has been used to craft this power point template diagram. This PPT diagram contains the concept of global financial matters. This PPT diagram can be used for business and finance related presentations.
-
 Three staged lego blocks finance business diagram powerpoint template slide
Presentation slideshow goes well with Google slides. PPT diagram can be show in standard and widescreen view. Entirely alterable PowerPoint design as editing is enabled. Simple to download and share with the audience. Similar designs comes with different nodes and stages. Perfect for finance industry and business leaders.
-
 Three staged bar graph with global business strategy powerpoint template slide
We are proud to present our three staged bar graph with global business strategy powerpoint template slide. Graphic of three staged bar graph has been used to craft this power point template diagram. This PPT diagram contains the concept of business strategy .Use this PPT diagram for business and management related presentations.
-
 Du timeline bar graph with icons powerpoint template
Presenting du timeline bar graph with icons powerpoint template. Presenting du timeline bar graph with icons powerpoint template. Presenting du timeline bar graph with icons powerpoint template. This Power Point template diagram has been crafted with graphic of timeline and bar graph diagram. This PPT diagram contains the concept of business result analysis. Use this PPT diagram for business and marketing related presentations.
-
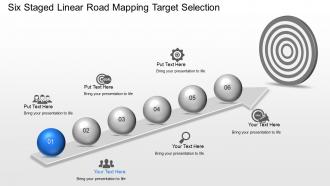 Jl six staged linear road mapping target selection powerpoint template
Easy to use with Google slides. PPT plans work superbly with all PowerPoint things. Easy and quick to incorporate titles and sub titles in slides. Edit printed styles, substance, shading and thought as showed by your necessities. Can be sufficiently changed over into PDF or JPG positions. Superior resolution template design graphics. Ideal for business affiliation gathering, experts, authorities, marketing experts, IT affiliations, managing a record, promoters, masters, and pioneers.
-
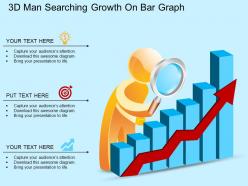 Eb 3d man searching growth on bar graph powerpoint template
Presenting eb 3d man searching growth on bar graph powerpoint template. This Power Point template diagram has been crafted with graphic of 3d man and bar graph. This PPT diagram contains the concept of growth. Use this PPT diagram for business and marketing related presentations.
-
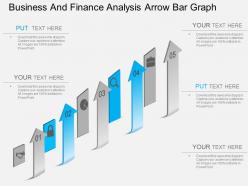 Ei business and finance analysis arrow bar graph powerpoint template
Utilization of cutting edge determination of pictures and the symbols in the slides. Permit altering of the size, style and introduction of the slide symbols. Inconvenience free inclusion of the organization's name or watermark. If guidelines to alter and change the slide symbol outline. Flexible with multiple format options like JPEG, JPG or PDF. Accessible an assortment of symbols to download and supplant in the slides. Valuable for the expert moderators and the business chiefs, financiers, businessmen, entrepreneurs, investors, and funding companies.
-
 Mi graphic of see saw for balance concept powerpoint template
These Presentation designs, contents, themes, symbols are perfectly reorganize able according to necessity. They have sufficient space to reinstate the dummy data with the company logo, emblem etc. These Presentation graphics are germane for the business experts, students and other professionals from divergent sectors. These PowerPoint images are simply customizable in to other file configuration like PDF or JPG.
-
 Is five staged bar graph and icons powerpoint template
Presenting is five staged bar graph and icons powerpoint template. Graphic of five staged bar graph and icons has been used to craft this power point template diagram. This PPT diagram contains concept of business result analysis representation. Use this PPT diagram for business and marketing related presentations.
-
 Ml pie chart percentage growth indication powerpoint template
Presenting ml pie chart percentage growth indication powerpoint template. This Power Point template diagram has been crafted with graphic of pie chart and percentage diagram. This PPT diagram contains the concept of growth indication. Use this PPT diagram for business and marketing related presentations.
-
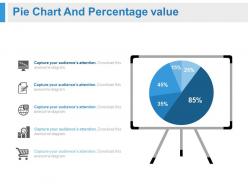 White board with pie chart and percentage powerpoint slides
Presenting white board with pie chart and percentage powerpoint slides. This Power Point template slide has been crafted with graphic of white board and pie chart diagram. This PPT slide contains the concept of business result analysis. Use this PPT slide for business and finance related presentations.
-
 Bar graph for elearning report analysis powerpoint slides
Presenting bar graph for elearning report analysis powerpoint slides. This Power Point template slide has been crafted with graphic of bar graph, book and globe. This PPT slide contains the concept of global e-learning report analysis. Use this PPT slide and build an innovative presentation.
-
 Bar graph with icons for business analysis powerpoint slides
Presenting bar graph with icons for business analysis powerpoint slides. This Power Point template slide has been crafted with graphic of bar graph and finance icons. This PPT slide contains the concept of business and financial analysis. Use this PPT slide for business and finance related presentations.
-
 Bulb with dollar coins and notes financial investment powerpoint slides
Presenting bulb with dollar coins and notes financial investment powerpoint slides. This Power Point template slide has been crafted with graphic of bulb and dollar coins. This PPT slide contains the concept of financial investment. Use this PPT slide for business and finance related presentations.
-
 Business result analysis bar graph powerpoint slides
Presenting business result analysis bar graph powerpoint slides. This Power Point template slide has been crafted with graphic of business man and bar graph .This PPT slide contains the concept of business result analysis. Use this PPT slide for business and finance related presentations.
-
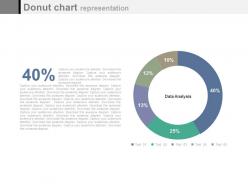 Circle donut chart with percentage graph powerpoint slides
Presenting circle donut chart with percentage graph powerpoint slides. This Power Point template slide has been crafted with graphic of circle donut chart and percentage graph .This PPT slide contains the concept of financial analysis. Use this PPT slide for business and finance related presentations.
-
 Circle of infographics for business and marketing powerpoint slides
Presenting circle of infographics for business and marketing powerpoint slides. This Power Point template slide has been crafted with graphic of circle info graphics .This PPT slide contains the concept of business and marketing strategy. Use this PPT slide for business and finance related presentations.
-
 Five staged blocks for process flow powerpoint slides
Presenting five staged blocks for process flow powerpoint slides. This Power Point template slide has been crafted with graphic of five staged blocks .This PPT slide contains the concept of business process flow. Use this PPT slide for business and finance related presentations.
-
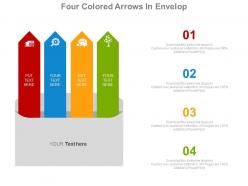 Four colored arrows in envelop for communication strategy powerpoint slides
Presenting four colored arrows in envelop for communication strategy powerpoint slides. This Power Point template slide has been crafted with graphic of four colored arrows in envelop. This PPT slide contains the concept of business communication strategy. Use this PPT slide for business and finance related presentations.
-
 Four colored tags for global business target achievement powerpoint slides
Presenting four colored tags for global business target achievement powerpoint slides. This Power Point template slide has been crafted with graphic of four colored tags in envelop. This PPT slide contains the concept of global business target achievement. Use this PPT slide for business and finance related presentations.
-
 Four petrol pump graphics for financial percentage powerpoint slides
Presenting four petrol pump graphics for financial percentage powerpoint slides. This Power Point template slide has been crafted with graphic of four petrol pump graphics. This PPT slide contains the concept of financial percentage analysis. Use this PPT slide for business and finance related presentations.
-
 Funnel design chart with icons powerpoint slides
Presenting funnel design chart with icons powerpoint slides. This Power Point template slide has been crafted with graphic of funnel design chart and icons. This PPT slide contains the concept of result analysis. Use this PPT slide for business and finance related presentations.
-
 Funnel diagram with dollar symbol powerpoint slides
Presenting funnel diagram with dollar symbol powerpoint slides. This Power Point template slide has been crafted with graphic of funnel diagram and dollar symbol. This PPT slide contains the concept of financial analysis and process flow. Use this PPT slide for business and finance related presentations.
-
 Mobile with icons for financial strategy powerpoint slides
Presenting mobile with icons for financial strategy powerpoint slides. This Power Point template slide has been crafted with graphic of mobile and icons. This PPT slide contains the concept of financial strategy and analysis. Use this PPT slide for business and finance related presentations.
-
 Six pie charts for financial percentage analysis powerpoint slides
Six pie charts for financial percentage analysis PowerPoint Slide. Editable shapes, colors and text. Presentable and easy to comprehend info graphic format. Presentation designs accessible in standard and widescreen view. The presentation template can be downloaded and saved in any desired format. Privilege of insertion of logo and trademarks for more personalization. Fully adaptable PPT slides with Google slides. Easy to edit and customize as per your needs.
-
 Six staged icons growth arrow for process flow powerpoint slides
Presenting six staged icons growth arrow for process flow powerpoint slides. This Power Point template slide has been crafted with graphic of six staged arrow and icons. This PPT slide contains the concept of process flow analysis. Use this PPT slide for business and finance related presentations.
-
 Six staged orbit diagram for business powerpoint slides
Presenting six staged orbit diagram for business powerpoint slides. This Power Point template slide has been crafted with graphic of six staged orbit diagram. This PPT slide contains the concept of business process flow analysis. Use this PPT slide for business and finance related presentations.
-
 Three staged business success strategy diagram powerpoint slides
Presentation slide is useful for owners, managers and accountants. Presentation slide offers attractive and professional color scheme. Font style and size can be easily altered and entered. PPT icon is easy for proofing and editing. Offers modification in font, color and orientation. Can be viewed in 4: 3 standard screen size or 16:9 wide screen size.
-
 Four pie charts with percentage analysis powerpoint slides
Presenting four pie charts with percentage analysis powerpoint slides. This is a four pie charts with percentage analysis powerpoint slides. This is a four stage process. The stages in this process are financials.
-
 Four staged donut charts for financial analysis powerpoint slides
Presenting four staged donut charts for financial analysis powerpoint slides. This Power Point template slide has been crafted with graphic of four donut charts diagram. This PPT diagram contains the concept of financial analysis. Use this PPT diagram slide for business and finance related presentations.
-
 Alternative flow chart for business communication powerpoint slides
Presenting alternative flow chart for business communication powerpoint slides. This Power Point template diagram has been crafted with graphic of alternative flow chart diagram. This PPT diagram contains the concept of business communication. Use this PPT diagram for business and management related presentations.
-
 Annual report with financial analysis powerpoint slides
Presenting annual report with financial analysis powerpoint slides. This Power Point template diagram has been crafted with graphic of annual report diagram. This PPT diagram contains the concept of financial analysis. Use this PPT diagram for business and finance related presentations.
-
 Arrow upward and downward with percentage chart powerpoint slides
Presenting arrow upward and downward with percentage chart powerpoint slides. This Power Point template diagram has been crafted with graphic of arrow in upward and downward directions with percentage chart diagram. This PPT diagram contains the concept of financial process flow. Use this PPT diagram for business and finance related presentations.
-
 Automatic email marketing target strategy and analysis powerpoint slides
Presenting automatic email marketing target strategy and analysis powerpoint slides. This Power Point template diagram has been crafted with graphic of automatic email system diagram. This PPT diagram contains the concept of email marketing target strategy and analysis. Use this PPT diagram for business and finance related presentations.
-
 Bar graph with business success analysis powerpoint slides
Presenting bar graph with business success analysis powerpoint slides. This Power Point template diagram has been crafted with graphic of bar graph diagram. This PPT diagram contains the concept of business success analysis. Use this PPT diagram for business and finance related presentations.
-
 Business circle process chart with business icons powerpoint slides
Presenting business circle process chart with business icons powerpoint slides. This Power Point template diagram has been crafted with graphic of business circle process chart and icons diagram. This PPT diagram contains the concept of business process analysis. Use this PPT diagram for business and finance related presentations.
-
 Business pie chart with percentage analysis powerpoint slides
Presenting business pie chart with percentage analysis powerpoint slides. This Power Point template diagram has been crafted with graphic of business pie chart and percentage diagram. This PPT diagram contains the concept of business and finance result analysis. Use this PPT diagram for business and finance related presentations.
-
 Business plan timeline for planning analysis powerpoint slides
Presenting business plan timeline for planning analysis powerpoint slides. This Power Point template diagram has been crafted with graphic of business plan timeline diagram. This PPT diagram contains the concept of business planning analysis and timeline formation. Use this PPT diagram for business and finance related presentations.
-
 Business template with dollar banking solutions powerpoint slides
Presenting business template with dollar banking solutions powerpoint slides. This Power Point template diagram has been crafted with graphic of business template with dollar diagram. This PPT diagram contains the concept of banking solutions representations. Use this PPT diagram for business and finance related presentations.
-
 Circle chart with percentage analysis powerpoint slides
Presenting circle chart with percentage analysis powerpoint slides. This Power Point template diagram has been crafted with graphic of business template with circle chart and percentage diagram. This PPT diagram contains the concept of financial data analysis. Use this PPT diagram for business and finance related presentations.
-
 Five arrows with percentage service distribution chart powerpoint slides
Presenting five arrows with percentage service distribution chart powerpoint slides. This Power Point template diagram has been crafted with graphic of five arrows and percentage diagram. This PPT diagram contains the concept of service distribution. Use this PPT diagram for business and finance related presentations.
-
 Five hexagons with business annual report powerpoint slides
Presenting five hexagons with business annual report powerpoint slides. This Power Point template diagram has been crafted with graphic of five hexagons diagram. This PPT diagram contains the concept of making annual business report for analysis. Use this PPT diagram for business and finance related presentations.
-
 Five staged annual report for business powerpoint slides
Presenting five staged annual report for business powerpoint slides. This Power Point template diagram has been crafted with graphic of five staged annual report diagram. This PPT diagram contains the concept of annual report analysis. Use this PPT diagram for business and finance related presentations.
-
 Five staged bar graph with icons powerpoint slides
Presenting five staged bar graph with icons powerpoint slides. This Power Point template diagram has been crafted with graphic of five staged bar graph and icons diagram. This PPT diagram contains the concept of business result analysis. Use this PPT diagram for business and finance related presentations.
-
 Five staged business tags for agenda powerpoint slides
Presenting five staged business tags for agenda powerpoint slides. This Power Point template diagram has been crafted with graphic of five staged business tags diagram. This PPT diagram contains the concept of business agenda analysis. Use this PPT diagram for business and finance related presentations.
-
 Five staged sequential arrow diagram powerpoint slides
Presenting five staged sequential arrow diagram powerpoint slides. This Power Point template diagram has been crafted with graphic of five staged sequential arrow diagram. This PPT diagram contains the concept of business process flow. Use this PPT diagram for business and finance related presentations.
-
 Five staged water taps and percentage analysis powerpoint slides
Presenting five staged water taps and percentage analysis powerpoint slides. This Power Point template diagram has been crafted with graphic of five staged water taps and percentage diagram. This PPT diagram contains the concept of business data analysis. Use this PPT diagram for business and finance related presentations.
-
 Five tags arrow tags for financial analysis powerpoint slides
Presenting five tags arrow tags for financial analysis powerpoint slides. This Power Point template diagram has been crafted with graphic of five arrow tags diagram. This PPT diagram contains the concept of financial analysis. Use this PPT diagram for business and finance related presentations.
-
 Five vertical arrows with icons for business analysis powerpoint slides
Presenting five vertical arrows with icons for business analysis powerpoint slides. This Power Point template diagram has been crafted with graphic of five vertical arrow and icons diagram. This PPT diagram contains the concept of business analysis. Use this PPT diagram for business and finance related presentations.
-
 Four pie charts for financial data analysis powerpoint slides
Presenting four pie charts for financial data analysis powerpoint slides. This Power Point template diagram has been crafted with graphic of four pie charts diagram. This PPT diagram contains the concept of financial data analysis. Use this PPT diagram for business and finance related presentations.
-
 Four stage target chart for process flow powerpoint slides
Presenting four stage target chart for process flow powerpoint slides. This Power Point template diagram has been crafted with graphic of four staged target chart diagram. This PPT diagram contains the concept of process flow. Use this PPT diagram for business and finance related presentations.
-
 Four staged automatic email marketing powerpoint slides
Presenting four staged automatic email marketing powerpoint slides. This Power Point template diagram has been crafted with graphic of email diagram. This PPT diagram contains the concept of automatic email marketing. Use this PPT diagram for business and marketing related presentations.
-
 Four staged bar graph for financial investment analysis powerpoint slides
Presenting four staged bar graph for financial investment analysis powerpoint slides. This Power Point template diagram has been crafted with graphic of four staged bar graph diagram. This PPT diagram contains the concept of financial investment analysis. Use this PPT diagram for business and finance related presentations.
-
 Four staged bar graph percentage analysis powerpoint slides
Presenting four staged bar graph percentage analysis powerpoint slides. This Power Point template diagram has been crafted with graphic of four staged bar graph and percentage diagram. This PPT diagram contains the concept of business result analysis. Use this PPT diagram for business and finance related presentations.
-
Easily Understandable slides.
-
Great experience, I would definitely use your services further.
-
Excellent products for quick understanding.
-
Great experience, I would definitely use your services further.
-
Presentation Design is very nice, good work with the content as well.
-
Editable templates with innovative design and color combination.
-
Top Quality presentations that are easily editable.
-
Appreciate the research and its presentable format.
-
Commendable slides with attractive designs. Extremely pleased with the fact that they are easy to modify. Great work!
-
Top Quality presentations that are easily editable.


