Dashboard PowerPoint Slides, KPi Dashboard PPT Templates
- Sub Categories
-
- 30 60 90 Day Plan
- About Us Company Details
- Action Plan
- Agenda
- Annual Report
- Audit Reports
- Balance Scorecard
- Brand Equity
- Business Case Study
- Business Communication Skills
- Business Plan Development
- Business Problem Solving
- Business Review
- Capital Budgeting
- Career Planning
- Change Management
- Color Palettes
- Communication Process
- Company Location
- Company Vision
- Compare
- Competitive Analysis
- Corporate Governance
- Cost Reduction Strategies
- Custom Business Slides
- Customer Service
- Dashboard
- Data Management
- Decision Making
- Digital Marketing Strategy
- Digital Transformation
- Disaster Management
- Diversity
- Equity Investment
- Financial Analysis
- Financial Services
- Financials
- Growth Hacking Strategy
- Human Resource Management
- Innovation Management
- Interview Process
- Knowledge Management
- Leadership
- Lean Manufacturing
- Legal Law Order
- Management
- Market Segmentation
- Marketing
- Media and Communication
- Meeting Planner
- Mergers and Acquisitions
- Metaverse
- Newspapers
- Operations and Logistics
- Organizational Structure
- Our Goals
- Performance Management
- Pitch Decks
- Pricing Strategies
- Process Management
- Product Development
- Product Launch Ideas
- Product Portfolio
- Project Management
- Purchasing Process
- Quality Assurance
- Quotes and Testimonials
- Real Estate
- Risk Management
- Sales Performance Plan
- Sales Review
- SEO
- Service Offering
- Six Sigma
- Social Media and Network
- Software Development
- Solution Architecture
- Stock Portfolio
- Strategic Management
- Strategic Planning
- Supply Chain Management
- Swimlanes
- System Architecture
- Team Introduction
- Testing and Validation
- Thanks-FAQ
- Time Management
- Timelines Roadmaps
- Value Chain Analysis
- Value Stream Mapping
- Workplace Ethic
-
 Sales performance summary dashboard snapshot presentation outline
Presenting sales performance summary dashboard snapshot presentation outline PPT slide. High-resolution slide design visuals. No fear of image pixelation when projected on a wide screen. It has compatibility with numerous software options available both online and offline. It is compatible with numerous format options. Ease of customization and personalization. Ease of editing in color and orientation of the slide visual. There is freedom to add the company logo, name and trademark as part of personalization. Thoroughly used by business professionals, students and teachers as part of their presentation.
-
 Net promoter score scale template powerpoint graphics
Presenting net promoter score scale PPT template. This Presentation graphic is eloquent and beneficial for the students, researchers, specialists from various fields. The composition features of this PowerPoint image allow you to modify the appearance and layout. This PPT design has enough scope to insert the title or subtitles respectively. The impeccable Presentation design is well acquainted with all Google Slides. They also provide an option to add your business logo too.
-
 Net promoter score survey template powerpoint slide
Presenting Net Promoter Score Survey Template PowerPoint Slide. Made up of high-resolution graphics. Easy to download and can be saved in a variety of formats. Access to open on a widescreen preview. Compatible with the Google Slides and PowerPoint software. Edit the style, size, and the background of the slide icons as per your needs. Useful for business owners, students, and managers. Can be viewed on standard screen and widescreen without any fear of pixelation.
-
 Process operational performance metrics presentation slides
Presenting process operational performance metrics presentation slides. PPT is useful in process performance measurement and improvement related slideshows. You can open the design template with Google Slides and PowerPoint. Images are fully supported on standard and wide screen views. Diagrams are fully editable in PowerPoint. You can change all the design components including font type, color, size, shape, background, images etc.
-
 Sales operational performance metrics sample ppt files
Presenting sales operational performance metrics sample PPT files PPT slide. This sales performance template has designed by professionals while sharing the sales strategies and you can also easily edit this template in PowerPoint. You are enabled to edit the font type, size & color, diagram color, and background color as well according to the requirement. You can insert the organization name, trademark, and tagline in this template. You can even use icons of own choice by simply replacing the previous icon as thousands of editable icons available on this webpage.
-
 Survey reports dashboard sample presentation ppt
Presenting survey reports dashboard sample presentation PPT slide. Download this slide in 2 screen sizes i.e. standard screen and widescreen. It can be converted and saved into various formats. Its compatibility with Google Slides makes it accessible at once. Change the colors, font type and font size of this template as per your presentation theme. Add your desired information in the text placeholders.
-
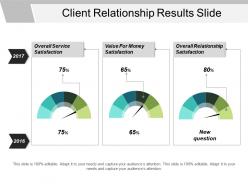 Client relationship results slide powerpoint slide background
Presenting client relationship results slide PowerPoint slide background PowerPoint shape which is 100% editable. This PPT slide is data driven i.e. excel linked easy to customize and enables you to personalize it as per your own criteria. The presentation slide is fully compatible with Google slides, multiple format and software options. In case of any assistance, kindly take instructions from our presentation design services and it is easy to download in a very short span of time. The images, layouts, designs are of high quality and ensures quality in widescreen.
-
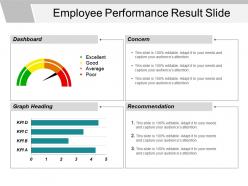 Employee performance result slide powerpoint slide influencers
Presenting Employee Performance Result Slide PowerPoint Slide Influencers. Download this slide and save this in JPG and PDF formats along with the various other formats. A user can display this employee performance result template on either standard or wide screen. The infographic performance slide design is completely compatible with Google Slides and fully customizable in PowerPoint. Sharing of employee performance slide with large segment is easy due to its superb pixel quality. You can modify the color, text, font style & font size and aspect ratio of this infographic employee performance slide.
-
 Workplace ethics results slide powerpoint slide show
Presenting Workplace Ethics Results Slide PowerPoint Slide Show.. A presenter can easily edit all kind of feature or even text of this business ethics slide as per his requirement. You can modify the font size, font color & font style of this slide. This template is completely compatible with Google Slides. You can make changes in the graphical illustrations, aspect ratio, color of the workplace ethics template because the template is 100% customizable. Download this slide in JPG and PDF format .
-
 Task completion dashboard presentation examples
Presenting Task Completion Dashboard Presentation Examples. It is a professionally designed template with relevant visual content. Get easy access to the customizable slide. You can edit the color, and the font size of the slide. Background and the number of fields can be altered too. The slide is compatible with Google Slides and can be exported in PDF, JPEG or JPG formats. Avail it in standard screen and full-screen size.
-
 Dashboard example of ppt presentation
Presenting Dashboard Example of PPT Presentation Template which is fully editable. Modify the color, fonts, font type and font size of the template as per your requirements. You can open and save your presentation in various formats like PDF, JPG and PNG. The template is adaptable with Google Slides, which makes it accessible at once. You can add or delete the content wherever required. This slide is available in both standard and widescreen sizes. Present it to your audience with confidence because of its splendid pixel quality.
-
 Dashboard snapshot powerpoint ideas
Presenting Dashboard Snapshot PowerPoint Ideas template. This slide with high quality graphics is completely editable and professionally designed. With an option to change the size, style, and color of the font, this slide is ready to use. You can alter the text and color of the diagram as well as the background as per your preference. The PPT slide is compatible with Google Slides, which makes it easily accessible. You can customize and save the file as JPG or PDF formats. You can avail this PPT slide in both standard as well as widescreen sizes.
-
 Dashboard presentation examples
Presenting Dashboard Presentation Examples which is completely editable. You can easily download this template into various formats like PDF, PNG, and JPEG. This slide is compatible with Google Slides. You can make as many changes as you want on the slide without any complications. Access this slide in both 4:9 and 16:9 ratio.
-
 Dashboard snapshot powerpoint slide inspiration
Presenting Dashboard Snapshot PowerPoint Slide Inspiration template. Transform this layout into various image or document formats like JPEG, JPG or PDF. Slide supports both the standard(4:3) and widescreen(16:9) aspect ratios. Further, it is compatible with Google Slides and MS PowerPoint. Modify the style, size, background and other attributes of the presentation. High-quality graphics will ensure that the quality is not affected.
-
 3 optimize icon with circular meter and red indicator
Presenting 3 optimize icon with circular meter and red indicator. This is a 3 optimize icon with circular meter and red indicator. This is a three stage process. The stages in this process are optimize icon, analyze icon, engineering icon.
-
 3 optimize icon with settings icon and meter
Presenting 3 optimize icon with settings icon and meter. This is a 3 optimize icon with settings icon and meter. This is a three stage process. The stages in this process are optimize icon, analyze icon, engineering icon.
-
 3 optimize icon with stopwatch and indicator
Presenting 3 optimize icon with stopwatch and indicator. This is a 3 optimize icon with stopwatch and indicator. This is a three stage process. The stages in this process are optimize icon, analyze icon, engineering icon.
-
 4 optimize icon with circular meter and red indicator
Presenting 4 optimize icon with circular meter and red indicator. This is a 4 optimize icon with circular meter and red indicator. This is a four stage process. The stages in this process are optimize icon, analyze icon, engineering icon.
-
 4 optimize icon with settings icon and meter
Presenting 4 optimize icon with settings icon and meter. This is a 4 optimize icon with settings icon and meter. This is a four stage process. The stages in this process are optimize icon, analyze icon, engineering icon.
-
 4 optimize icon with stopwatch and indicator
Presenting 4 optimize icon with stopwatch and indicator. This is a 4 optimize icon with stopwatch and indicator. This is a four stage process. The stages in this process are optimize icon, analyze icon, engineering icon.
-
 5 optimize icon with circular meter and red indicator
Presenting 5 optimize icon with circular meter and red indicator. This is a 5 optimize icon with circular meter and red indicator. This is a five stage process. The stages in this process are optimize icon, analyze icon, engineering icon.
-
 5 optimize icon with settings icon and meter
Presenting 5 optimize icon with settings icon and meter. This is a 5 optimize icon with settings icon and meter. This is a five stage process. The stages in this process are optimize icon, analyze icon, engineering icon.
-
 5 optimize icon with stopwatch and indicator
Presenting 5 optimize icon with stopwatch and indicator. This is a 5 optimize icon with stopwatch and indicator. This is a five stage process. The stages in this process are optimize icon, analyze icon, engineering icon.
-
 6 optimize icon with circular meter and red indicator
Presenting 6 optimize icon with circular meter and red indicator. This is a 6 optimize icon with circular meter and red indicator. This is a six stage process. The stages in this process are optimize icon, analyze icon, engineering icon.
-
 6 optimize icon with settings icon and meter
Presenting 6 optimize icon with settings icon and meter. This is a 6 optimize icon with settings icon and meter. This is a six stage process. The stages in this process are optimize icon, analyze icon, engineering icon.
-
 6 optimize icon with stopwatch and indicator
Presenting 6 optimize icon with stopwatch and indicator. This is a 6 optimize icon with stopwatch and indicator. This is a six stage process. The stages in this process are optimize icon, analyze icon, engineering icon.
-
 7 optimize icon with circular meter and red indicator
Presenting 7 optimize icon with circular meter and red indicator. This is a 7 optimize icon with circular meter and red indicator. This is a seven stage process. The stages in this process are optimize icon, analyze icon, engineering icon.
-
 7 optimize icon with settings icon and meter
Presenting 7 optimize icon with settings icon and meter. This is a 7 optimize icon with settings icon and meter. This is a seven stage process. The stages in this process are optimize icon, analyze icon, engineering icon.
-
 7 optimize icon with stopwatch and indicator
Presenting 7 optimize icon with stopwatch and indicator. This is a 7 optimize icon with stopwatch and indicator. This is a seven stage process. The stages in this process are optimize icon, analyze icon, engineering icon.
-
 Dashboard snapshot ppt slide design
Presenting dashboard snapshot ppt slide design. This is a dashboard ppt slide design. This is a three stage process. The stages in this process are low, medium, high, dashboard, measurement.
-
 Dashboard snapshot presentation outline
Presenting dashboard presentation outline. This is a dashboard snapshot presentation outline . This is a one stage process. The stages in this process are high speed, low, medium, dashboard, strategy.
-
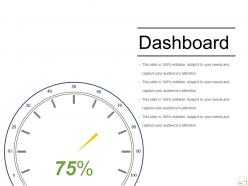 Dashboard snapshot sample of ppt presentation
Presenting dashboard sample of ppt presentation. This is a dashboard snapshot sample of ppt presentation. This is a one stage process. The stages in this process are dashboard, percentage, business, management, process.
-
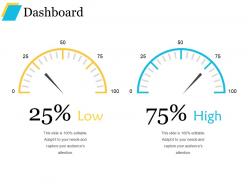 Dashboard powerpoint presentation templates
Presenting dashboard powerpoint presentation templates. This is a dashboard powerpoint presentation templates. This is a two stage process. The stages in this process are low, high, dashboard, technology, business.
-
 Dashboard powerpoint slide templates download
Presenting dashboard powerpoint slide templates download. This is a dashboard powerpoint slide templates download. This is a one stage process. The stages in this process are low, medium, high, dashboard.
-
 Dashboard powerpoint templates download
Presenting dashboard powerpoint templates download. This is a dashboard powerpoint templates download. This is a one stage process. The stages in this process are medium, low, high, dashboard.
-
 Quality management dashboard powerpoint graphics
Presenting quality management dashboard powerpoint graphics. This is a quality management dashboard powerpoint graphics. This is a six stage process. The stages in this process are purpose and overview, scope, roles and responsibilities, metrics and tools, review and audit plan, corrective plan.
-
 Dashboard Snapshot ppt infographic template
Presenting dashboard ppt infographic template. This is a dashboard snapshot ppt infographic template. This is a three stage process. The stages in this process are dashboard, low, high, medium.
-
 Dashboard powerpoint slide graphics
Presenting dashboard powerpoint slide graphics. This is a dashboard powerpoint slide graphics. This is a three stage process. The stages in this process are dashboard, low, medium, high.
-
 Dashboard powerpoint images template 2
Presenting dashboard powerpoint images template 2. This is a dashboard powerpoint images template 2. This is a three stage process. The stages in this process are low, medium, high, dashboard, measurement.
-
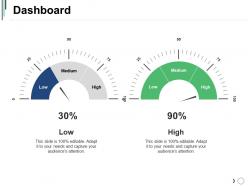 Dashboard powerpoint slide background designs
Presenting this set of slides with name - Dashboard Powerpoint Slide Background Designs. This is a two stage process. The stages in this process are Dashboard, Marketing, Strategy, Planning, Finance.
-
 Dashboard powerpoint slide background image
Presenting dashboard powerpoint slide background image. This is a dashboard powerpoint slide background image. This is a three stage process. The stages in this process are dashboard, percentage, business, marketing, strategy.
-
 Launch monitoring dashboard snapshot ppt design
Presenting launch monitoring dashboard Snapshot ppt design. This is a launch monitoring dashboard ppt design. This is a three stage process. The stages in this process are return on investment, target units sold, customer satisfaction, low, medium, high.
-
 Product quality check ppt slide
Presenting the Product Quality Check PPT Slide template. The slide is fully editable in PowerPoint and other office suites. Alter the font style, font color, and other attributes within seconds. The PPT is compatible with Google Slides. Convert this template into numerous images or document formats like JPEG or PDF. High-quality graphics ensure that distortion does not occur. Moreover, both standard(4:3) and widescreen(16:9) viewing angles are supported for clarity.
-
 Brand performance dashboard powerpoint slides design
Presenting brand performance dashboard powerpoint slides design. This is a brand performance dashboard powerpoint slides design. This is a three stage process. The stages in this process are customer recognition, enhanced sales, competitive edge, dashboard, measurement.
-
 Brand performance dashboard snapshot ppt background template
Presenting brand performance dashboard snapshot ppt background template. This is a brand performance dashboard ppt background template. This is a three stage process. The stages in this process are customer recognition, enhanced sales, competitive edge, dashboard, business.
-
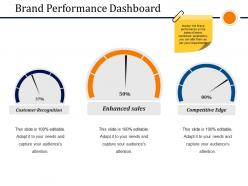 Brand performance dashboard snapshot ppt sample presentations
Presenting brand performance dashboard ppt sample presentations. This is a brand performance dashboard Snapshot ppt sample presentations. This is a three stage process. The stages in this process are customer recognition, enhanced sales, competitive edge
-
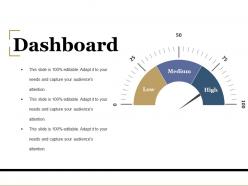 Dashboard powerpoint slide rules
Presenting dashboard powerpoint slide rules. This is a dashboard powerpoint slide rules. This is a three stage process. The stages in this process are business, marketing, strategy, planning, dashboard.
-
 Brand performance dashboard powerpoint slide ideas
Presenting brand performance dashboard powerpoint slide ideas. This is a brand performance dashboard powerpoint slide ideas. This is a three stage process. The stages in this process are low, medium, high, dashboard, measurement.
-
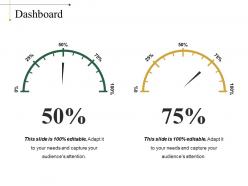 Dashboard powerpoint slide presentation tips
Presenting dashboard powerpoint slide presentation tips. This is a dashboard powerpoint slide presentation tips. This is a two stage process. The stages in this process are dashboard, percentage, business, marketing, process.
-
 Dashboard powerpoint slide presentation sample
Presenting dashboard powerpoint slide presentation sample. This is a dashboard powerpoint slide presentation sample. This is a three stage process. The stages in this process are dashboard, business, marketing, process.
-
 Dashboard snapshot powerpoint shapes
Presenting dashboard snapshot powerpoint shapes. This is a dashboard powerpoint shapes. This is a three stage process. The stages in this process are low, medium, high, dashboard, measurement.
-
 Brand performance dashboard snapshot ppt images gallery
Presenting brand performance dashboard snapshot ppt images gallery. This is a brand performance dashboard snapshot ppt images gallery. This is a three stage process. The stages in this process are customer recognition, enhanced sales, competitive edge, dashboard, business.
-
 Brand performance dashboard snapshot ppt example
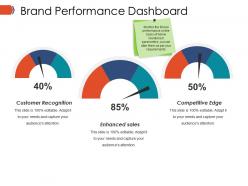
Presenting brand performance dashboard snapshot ppt example. This is a brand performance dashboard ppt example. This is a three stage process. The stages in this process are customer recognition, enhanced sales, competitive edge.
-
 Change management performance dashboard powerpoint slide designs
Presenting change management performance dashboard powerpoint slide designs. This is a change management performance dashboard powerpoint slide designs. This is a three stage process. The stages in this process are critical, high, low, medium, none.
-
 Dashboard powerpoint slide deck samples
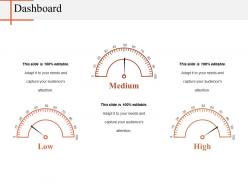
Presenting this set of slides with name - Dashboard Powerpoint Slide Deck Samples. This is a three stage process. The stages in this process are Dashboard, Strategy, Finance, Planning, Measure.
-
 Dashboard powerpoint slide background picture
Presenting dashboard powerpoint slide background picture. This is a dashboard powerpoint slide background picture. This is a two stage process. The stages in this process are dashboard, low, high, business, marketing.
-
 Dashboard powerpoint slide design templates 1
Presenting dashboard powerpoint slide design templates 1. This is a dashboard powerpoint slide design templates 1. This is a three stage process. The stages in this process are dashboard, percentage, business, marketing, strategy.
-
 Project phases data driven speedometer dashboard snapshot
Presenting project phases data driven speedometer dashboard. This is a project phases data driven speedometer dashboard snapshot. This is a four stage process. The stages in this process are project phases templates, project steps, project methods.
-
 Customer satisfaction powerpoint images
Presenting customer satisfaction powerpoint images. This is a customer satisfaction powerpoint images. This is a three stage process. The stages in this process are key performance indicators, percentage, year, measurement, dashboard.
-
 Customer satisfaction powerpoint slide background designs
Presenting customer satisfaction powerpoint slide background designs. This is a customer satisfaction powerpoint slide background designs. This is a three stage process. The stages in this process are overall satisfaction with service, satisfaction with value for money, overall satisfaction with relationship, business, percentage.
-
Excellent template with unique design.
-
Content of slide is easy to understand and edit.
-
Easily Editable.
-
Nice and innovative design.
-
Colors used are bright and distinctive.
-
Illustrative design with editable content. Exceptional value for money. Highly pleased with the product.
-
Excellent work done on template design and graphics.
-
Easily Editable.
-
Easy to edit slides with easy to understand instructions.
-
Excellent template with unique design.


