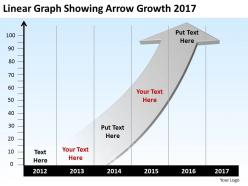
Product roadmap timeline linear graph showing arrow growth 2017 powerpoint templates slides
Display the change and the business processes well in this product roadmap timeline linear graph showing arrow growth 2017 PowerPoint templates slides3 design. This PPT template icon is used to demonstrate the change over the time as a series of the data points connected with a single line or some straight line segments on two different axes. While comparing two different data sets, line graphs are useful only if the axes do follow the similar scales. The line graphs genuinely depend on the type of information or the data that you may be trying to convey. Additionally the charts, area, bar graphs and the range of stock may present the data in a better way. The categorical data may depend on the type of information and the data information that you may be trying to convey in some way. Thus simplify your filed of science and statistics through visual characteristics.Not every presentation needs to needs to take hours of planning. Be ready now with our ready to use Product Roadmap Timeline Linear Graph Showing Arrow Growth 2017 powerpoint Templates Slides.
You must be logged in to download this presentation.
 Impress your
 audience
Editable
of Time
PowerPoint presentation slides
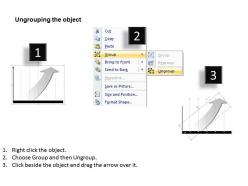
High resolution images and icons in the slides. Replace the content with useful and relevant information. Edit the color, size, style and orientation of the slide icons. Slide icons are compatible with Google Slides. Useful for the daily business presenters, and business leaders.
People who downloaded this PowerPoint presentation also viewed the following :
Product roadmap timeline linear graph showing arrow growth 2017 powerpoint templates slides with all 4 slides:
Lovely clean design available 24/7. Our Product Roadmap Timeline Linear Graph Showing Arrow Growth 2017 powerpoint Templates Slides are always here to help your presentations look their best.
-
Unique design & color.
-
Graphics are very appealing to eyes.


